Cryptocurrency
Last BTC price dip before a $30K breakout? Bitcoin wipes weekend gains
A limp monthly close ends with Bitcoin closing its weekend futures gap, but BTC price action continues to disappoint.
Bitcoin returned to a key focal point on June 1 as the monthly close delivered disappointment.
Data from Cointelegraph Markets Pro and TradingView confirmed a lackluster end to May for BTC/USD, which slid below $27,000. The pair erased its entire uptick seen over the weekend, coming full circle to act in a familiar range on the day. This centered on the area immediately below $27,000, with Bitcoin frequently visiting it since the middle of April.
In doing so this time around, however, BTC/USD “filled” a gap in CME futures outstanding since the weekend trip higher.
“When these gaps fill, the bottom is usually near,” popular trader Jelle wrote in part of the day’s social media commentary.
An additional post argued that BTC price action would soon break out to $30,000, completing a “falling wedge” construction with waning volatility.
Despite the gap fill, fellow trader Daan Crypto Trades remained risk-off until a clearer direction became apparent.
“Confluence at the $26750 region with the CME gap as well as the Golden Pocket on the Fibonacci retracement. Will see how price reacts when/if it gets there,” he commented alongside a one-hour chart.
“Currently not in a place for me to consider any trades.”
Trader Skew likewise got few positive cues from order book composition and trader activity.
“Gap filled now, weak market though,” he summarized on the day.
“To be bullish would be strength above $27.4K & $27.2K (index exchanges).”
Bitcoin “straddling” key liquidity gap
Bitcoin’s price finished May down 7%, data from monitoring resource CoinGlass shows — something of an average performance for a highly varied month. The largest cryptocurrency is 5.5% lower in Q2, contrasting Q1 gains of over 70%.
Analyzing multiple timeframes, the trading suite DecenTrader saw little reason to expect an abrupt trend change yet. Warning of “moderately bearish” or “declining” signals on its proprietary trading instruments, it flagged downside support levels tied to key moving averages (MAs).
These are $26,250, $26,000 and $23,035 for the 200-week, 20-week and 200-day MAs, respectively.
“Liquidity wise, Bitcoin is still straddling. Downside is currently protected by the 200WMA. Upside, all meaningful liquidity is above $30k,” it added in part of a Twitter thread, reiterating findings from co-founder Philip Swift the day prior.


After experiencing a rapid downturn, Ethereum has found itself supported by a substantial zone, comprising the 100-day moving average and a critical price range between the 0.5 and 0.618 Fibonacci levels. Consequently, a bullish rebound is anticipated in the medium term.
By Shayan
The Daily Chart
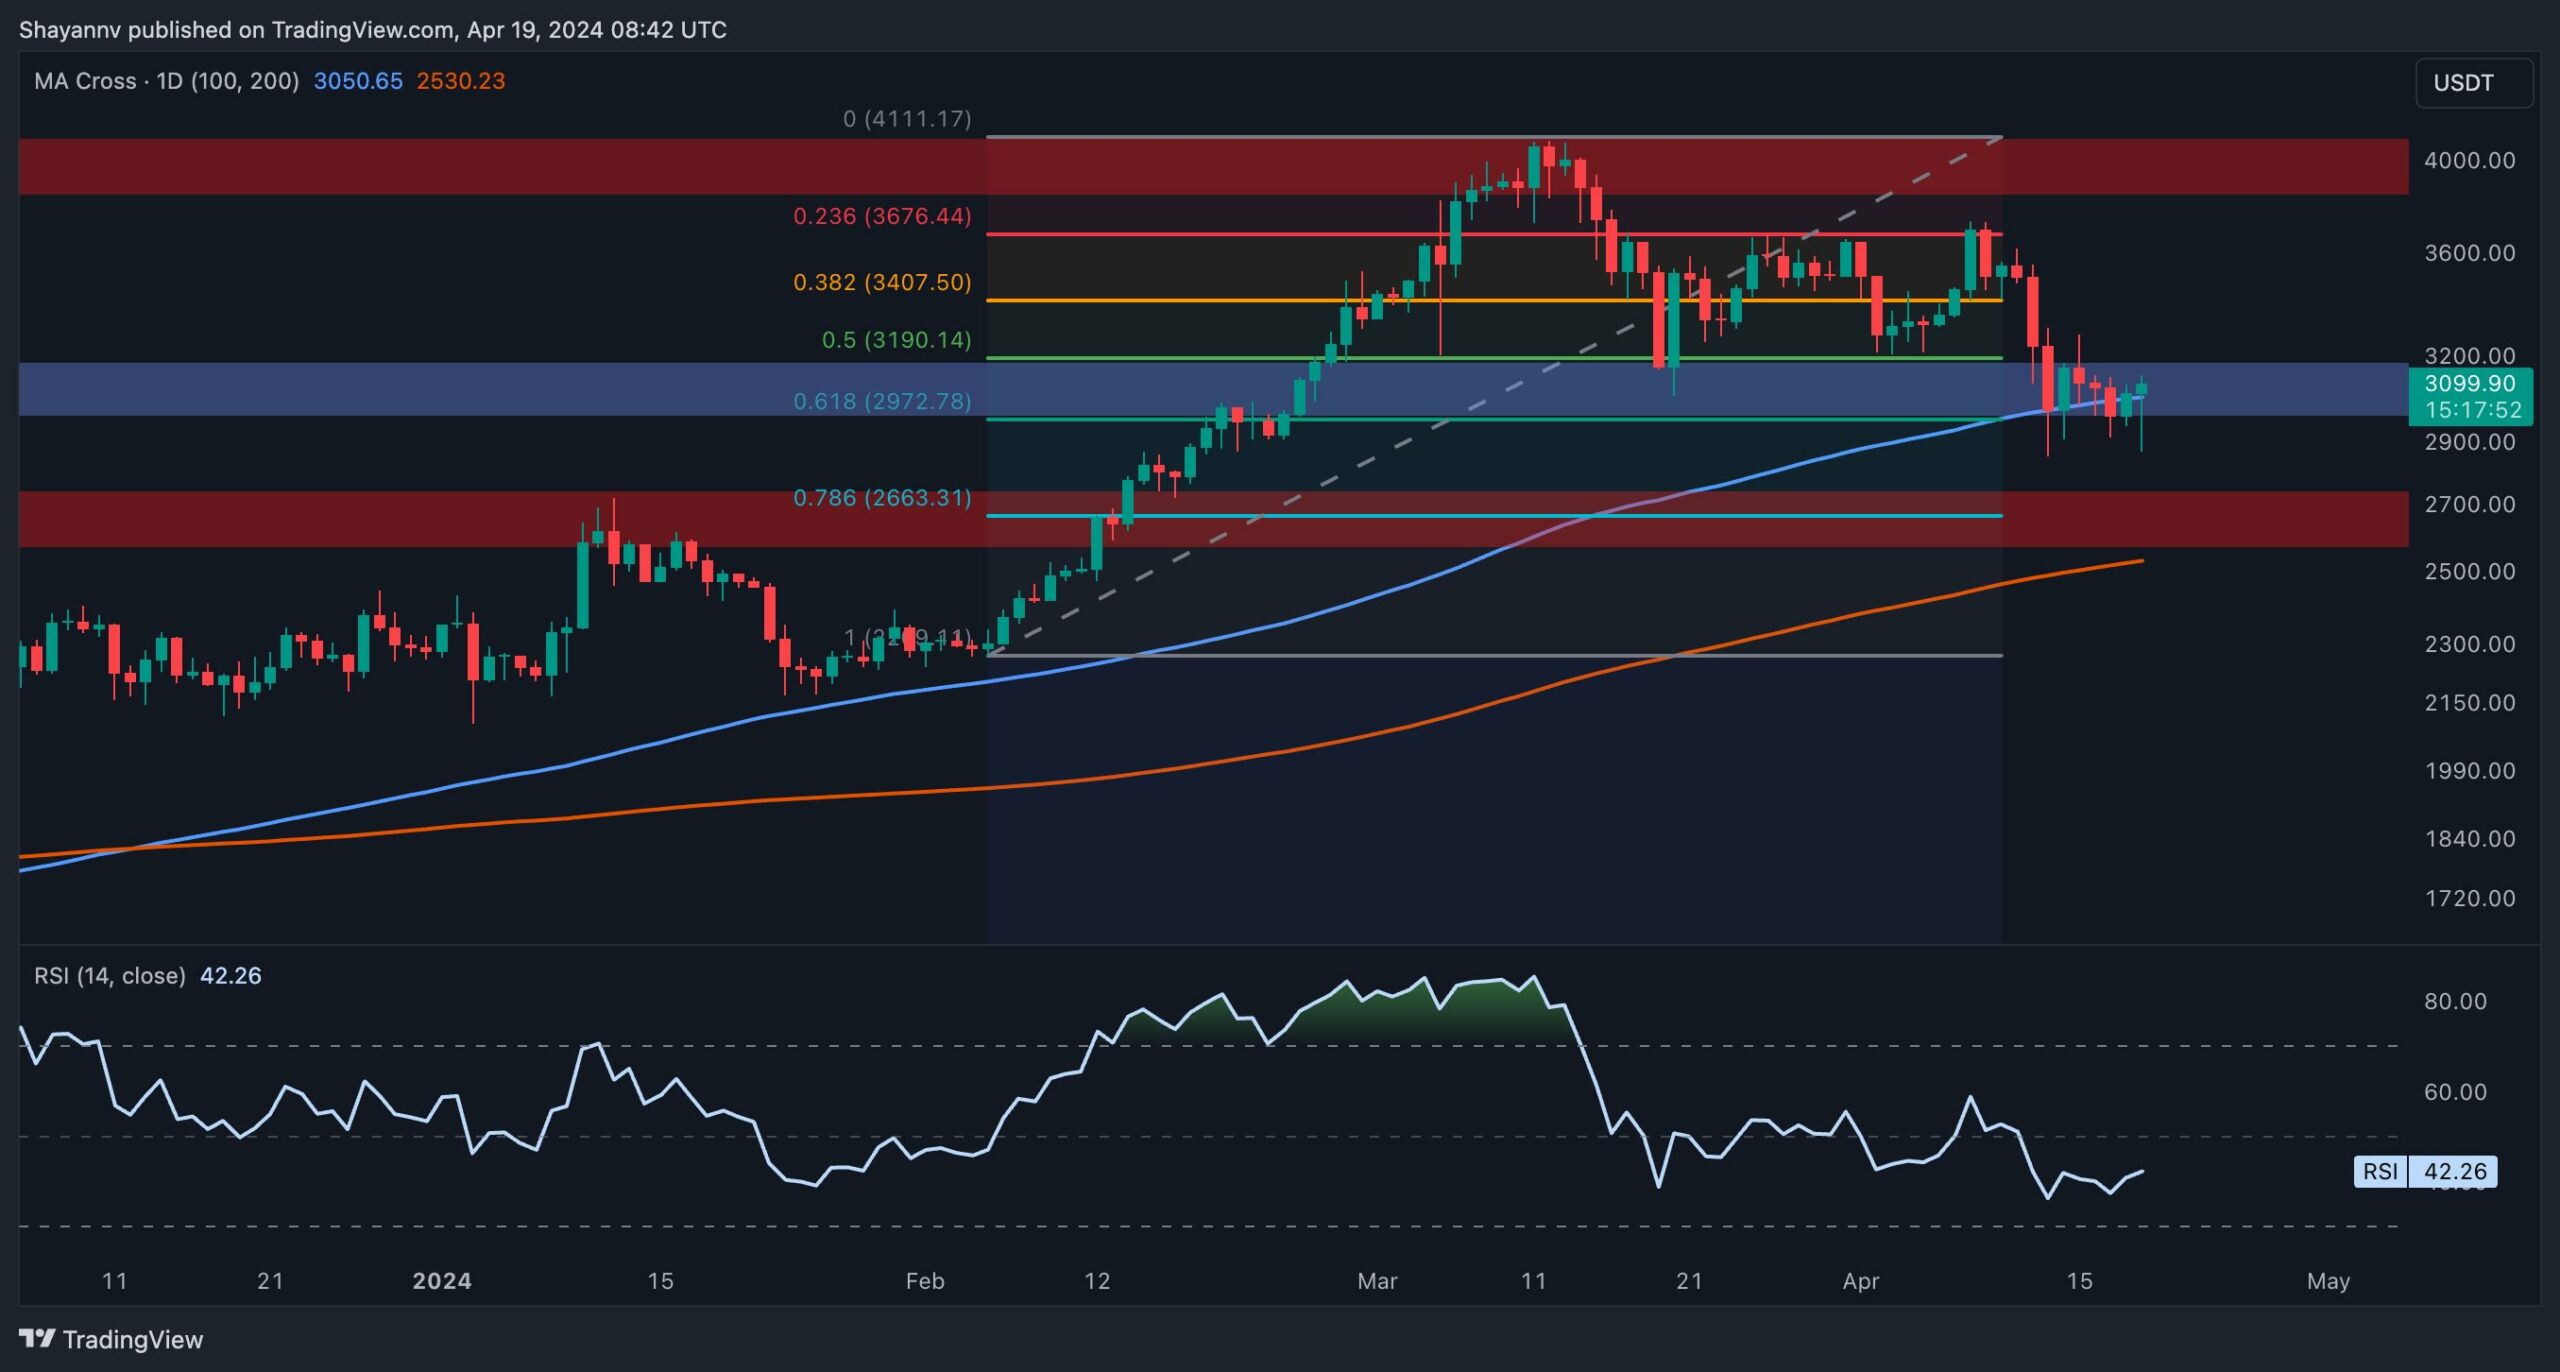
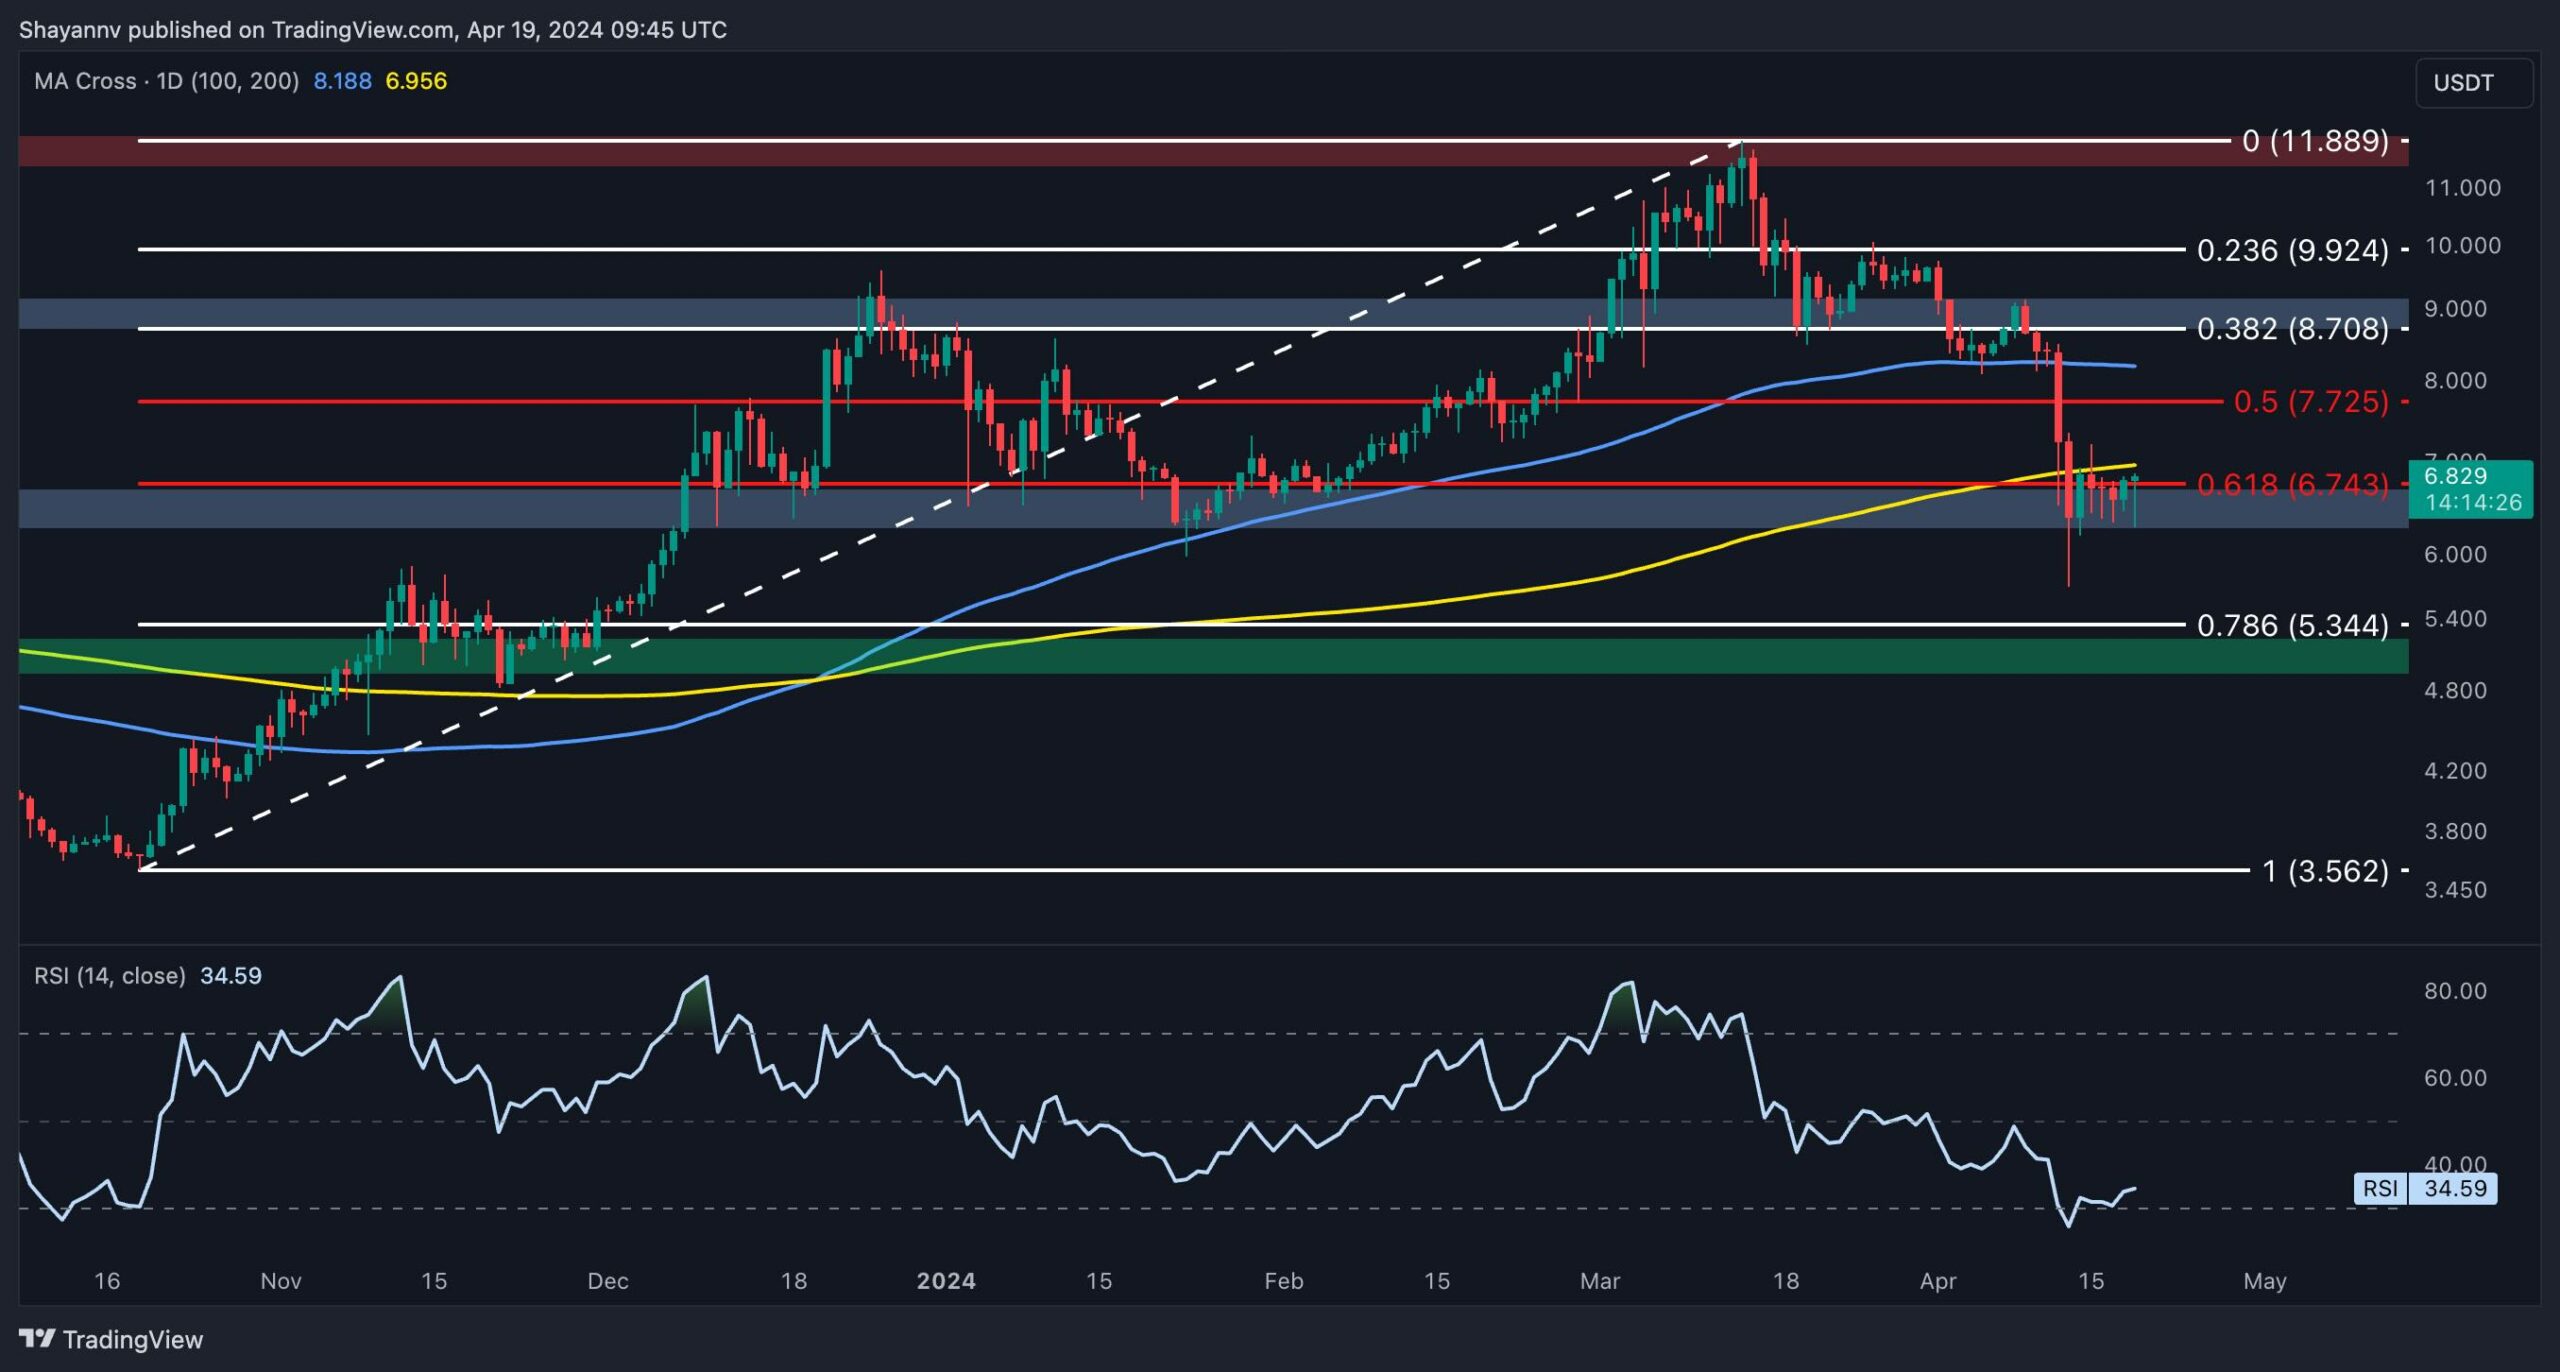
A thorough examination of the daily chart reveals an extended period of corrective retracements, culminating in the price finding support within a pivotal zone.
This zone encompasses the 100-day moving average at $3050 and the significant price range between the 0.5 ($3190) and 0.618 ($2972) Fibonacci levels.
This range carries significance as it attracts considerable demand, potentially hindering further downward pressure from market sellers. Additionally, a minor bullish divergence between the price and the RSI indicator suggests the potential for a bullish resurgence, targeting a reclaim of the $3.5K threshold. However, despite the bullish indications, an unexpected breach below this critical support zone could trigger a cascade effect toward the 200-day moving average at $2.5K.

The 4-Hour Chart
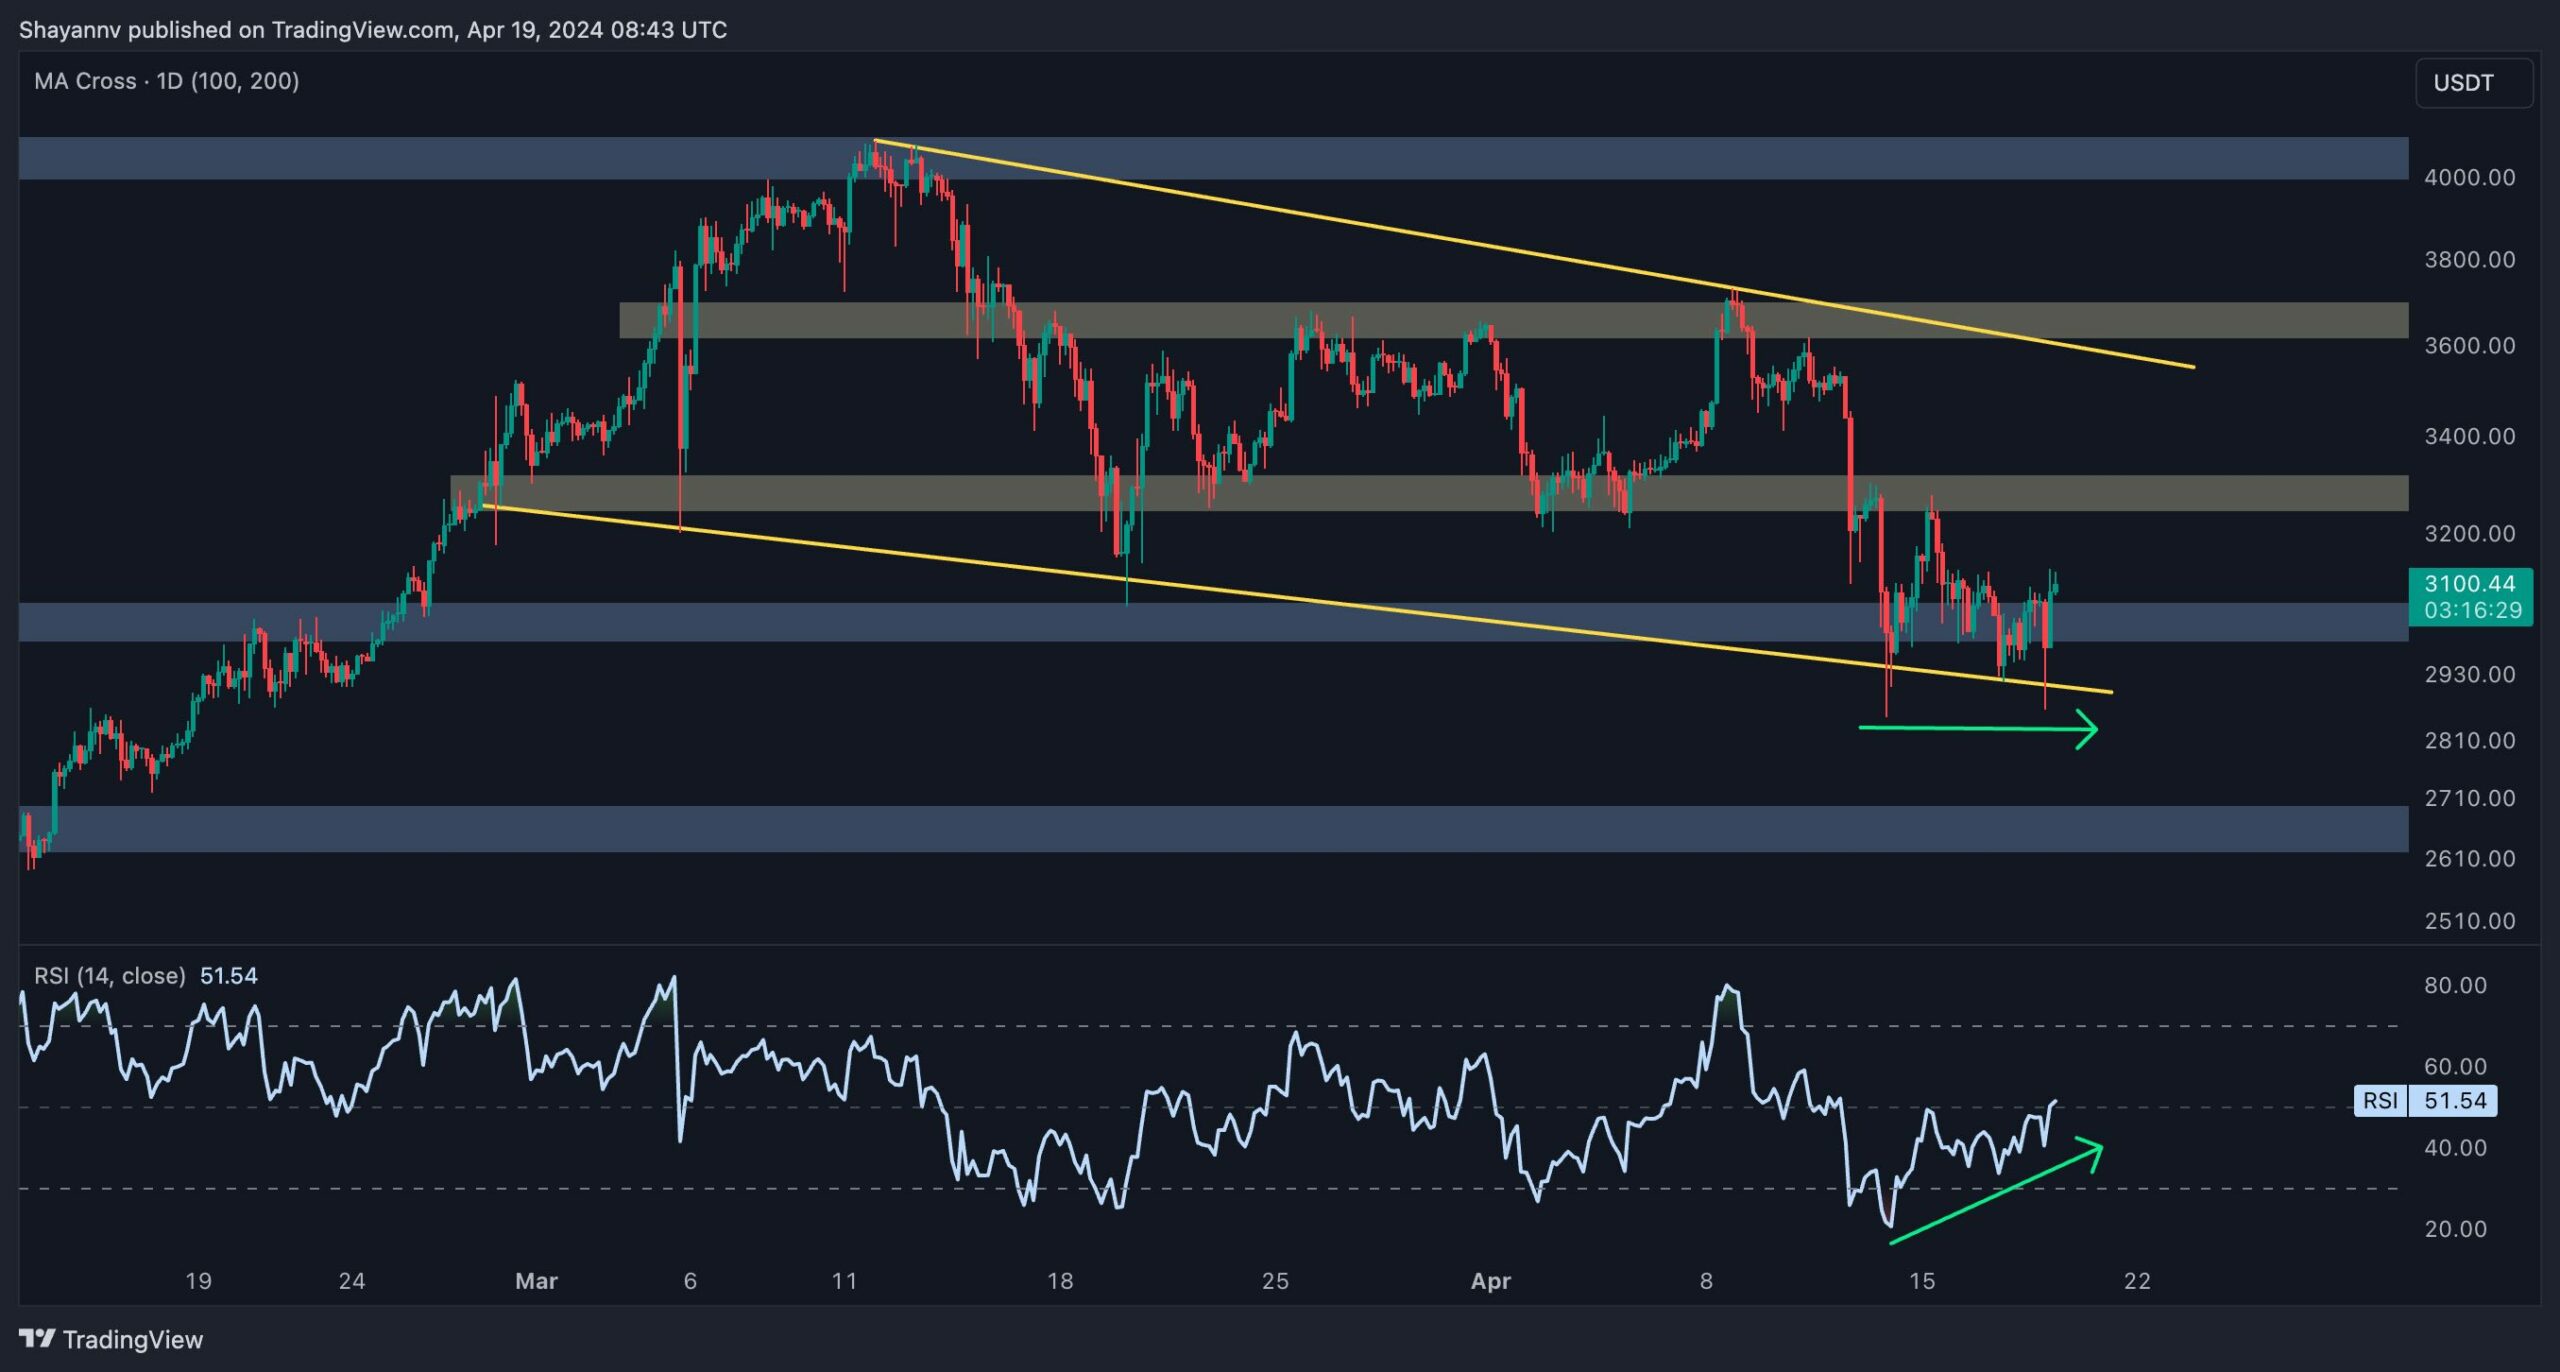
A closer inspection of the 4-hour chart reveals the formation of a descending wedge pattern during a multi-month consolidation correction. Following a significant decline, the price has reached the lower boundary of the wedge and the support region around $3K.
Nonetheless, given the potential buying pressure within this crucial range, the price has entered a consolidation phase characterized by minimal volatility.
This price action highlights a tug-of-war between buyers and sellers. Nevertheless, a noticeable divergence between the price and the RSI indicator on the 4-hour timeframe suggests the strength of buyers, increasing the likelihood of a bullish upswing in the medium term. In such a scenario, the next target for the price would be the critical resistance level at $3.5K. Conversely, should a break below this support occur, a descent toward the $2.7K support becomes increasingly probable.
By Shayan
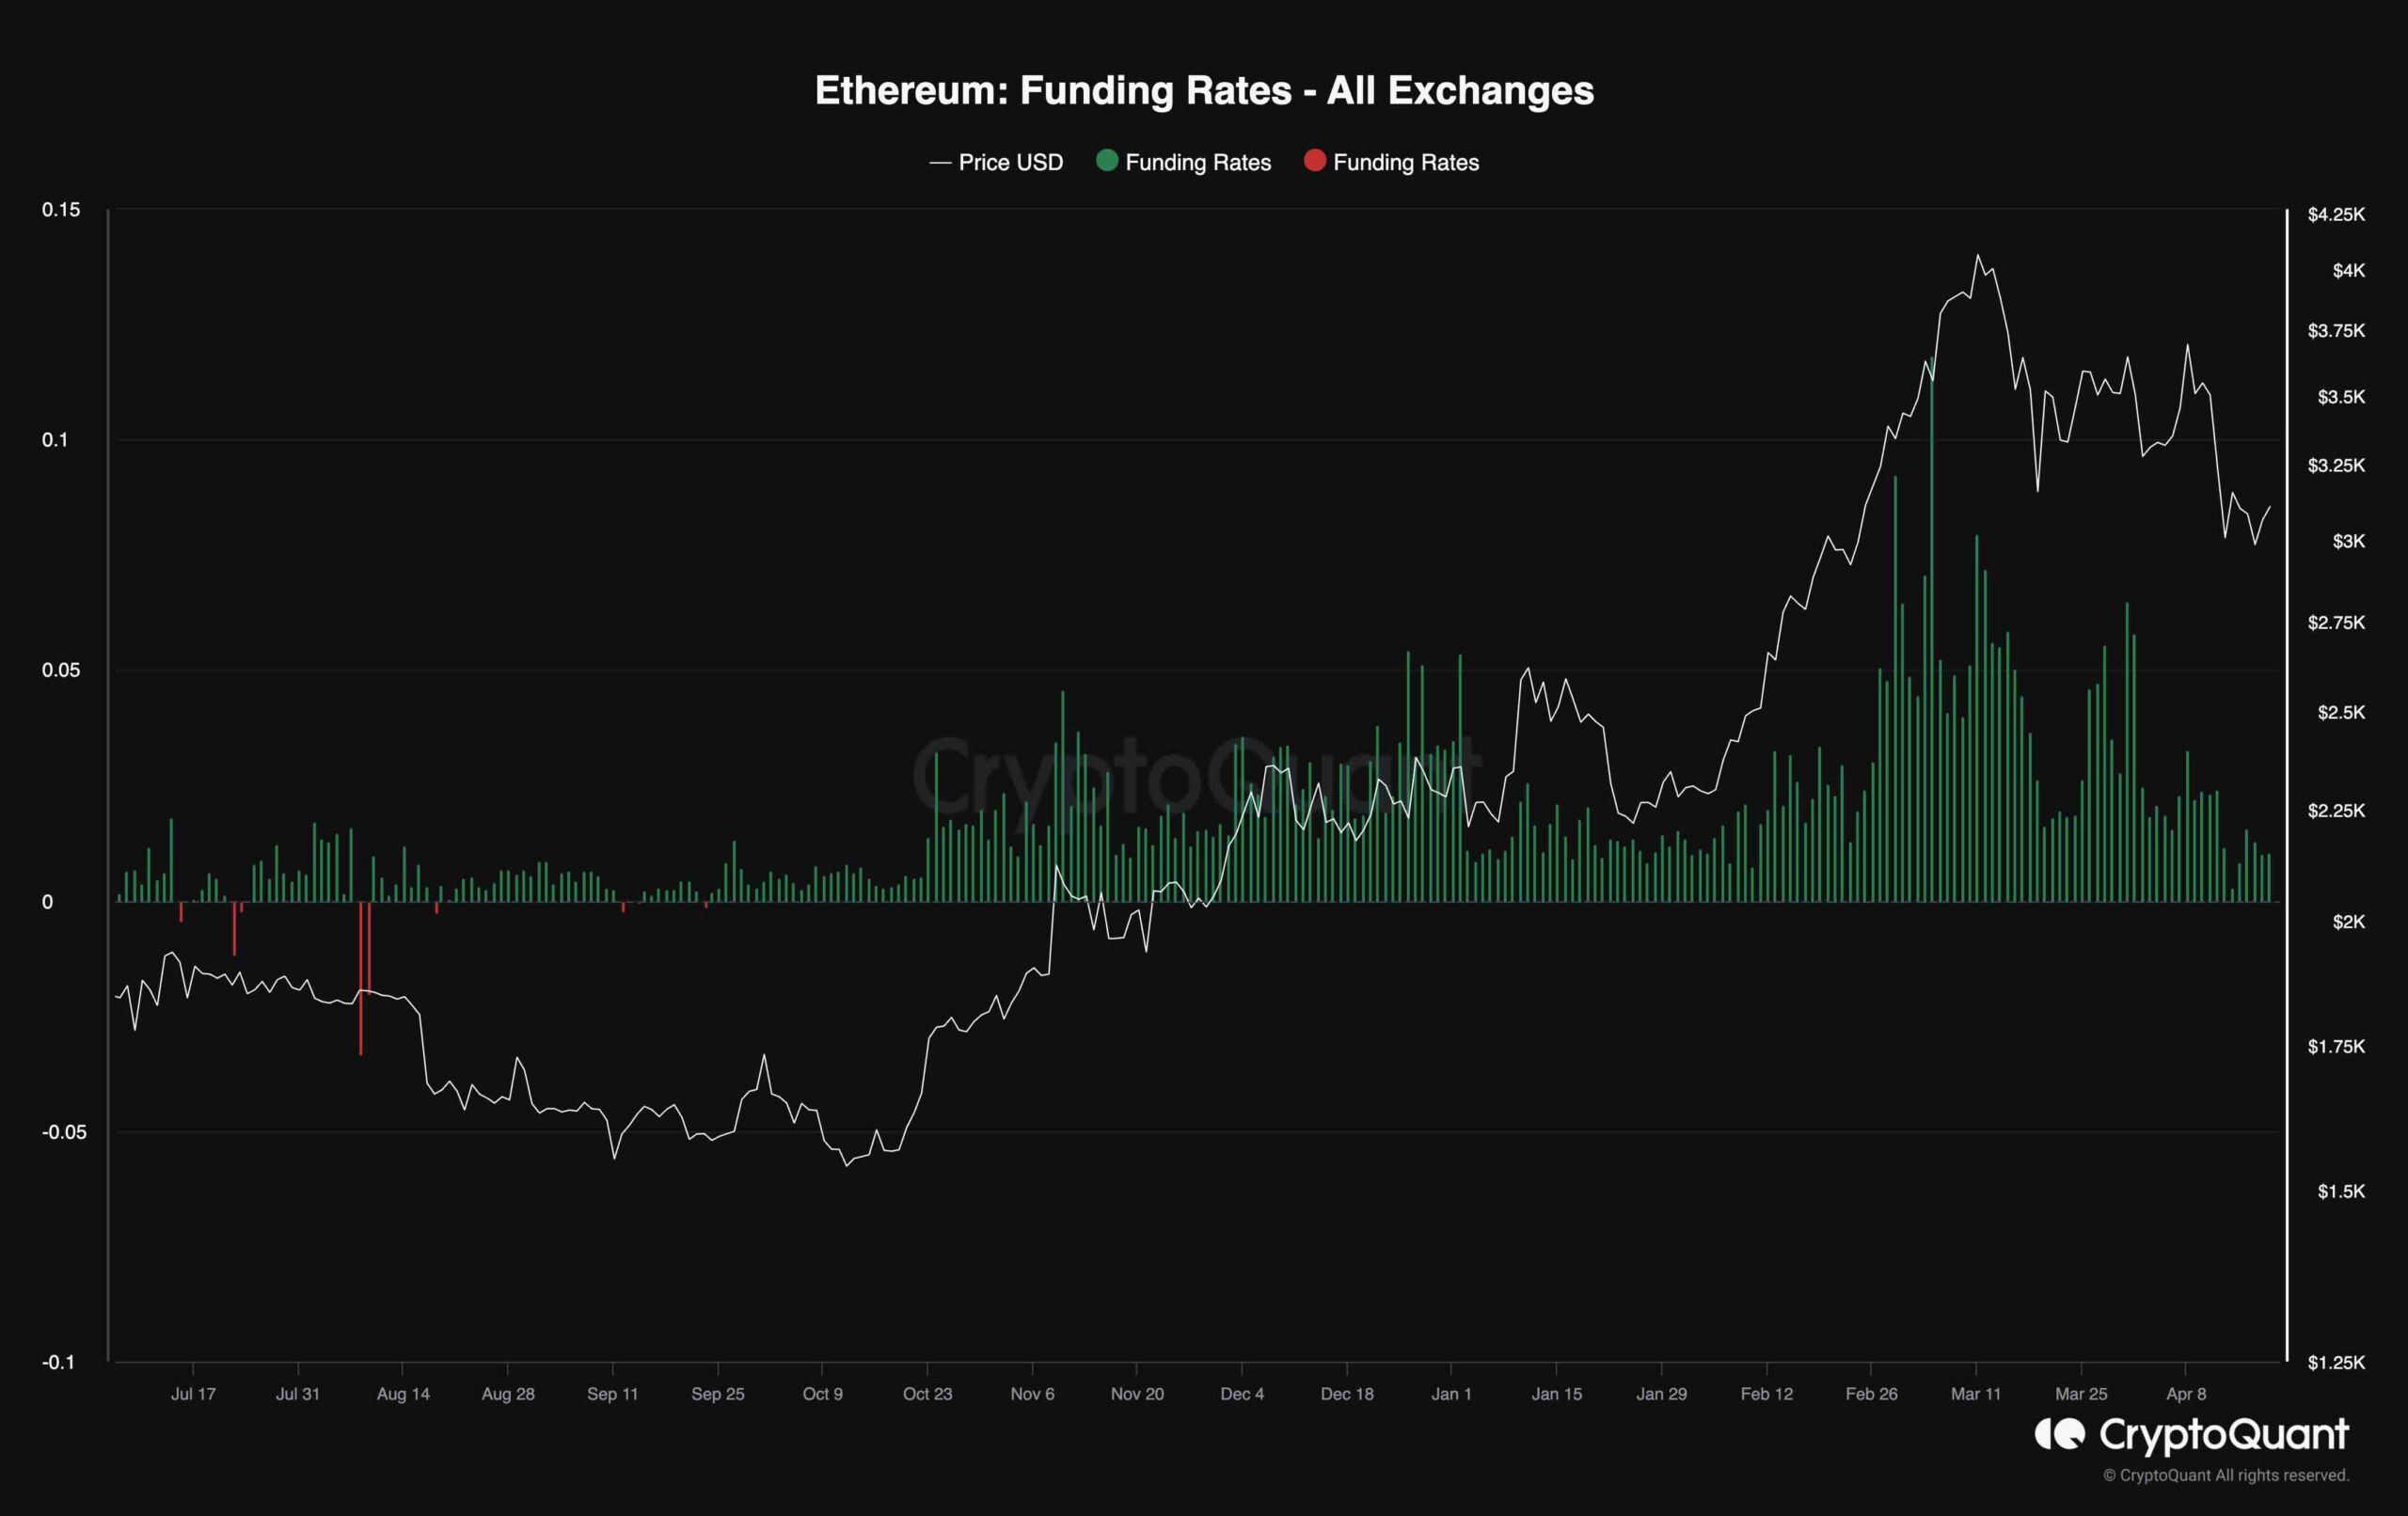
As Ethereum’s price exhibits signs of recovery, it’s crucial to determine whether this resurgence stems from spot buying or leveraged futures activity. A key metric for this analysis is the funding rates, where positive values signify bullish sentiment and negative values indicate fear in the market.
Observing the recent downtrend in Ethereum’s price, it’s notable that the funding rate metric has mirrored this trajectory, steadily declining until reaching near-zero levels. This alignment suggests that the recent price drop has led to the liquidation of a significant number of positions in the perpetual market, resulting in a cooling effect on the futures market. Consequently, the market appears primed for the re-emergence of long positions, with the potential for a fresh upward surge.
LIMITED OFFER 2024 for CryptoPotato readers at Bybit: Use this link to register and open a $500 BTC-USDT position on Bybit Exchange for free!
Disclaimer: Information found on CryptoPotato is those of writers quoted. It does not represent the opinions of CryptoPotato on whether to buy, sell, or hold any investments. You are advised to conduct your own research before making any investment decisions. Use provided information at your own risk. See Disclaimer for more information.
Cryptocurrency charts by TradingView.
Polkadot’s recent price action has been characterized by subdued movement and minimal volatility following a swift decline toward the $6 level. However, the cryptocurrency finds itself at a crucial juncture, with a potential breakout poised to determine its next direction.
Polkadot Price Analysis: Technicals
By Shayan
The Daily Chart
A thorough analysis of the daily chart reveals a period of consolidation around the $6 mark, marked by low volatility and indecision in the market. This suggests a looming battle between buyers and sellers, hinting at an impending significant movement.
Despite this uncertainty, the Polkadot price is currently supported by a strong and decisive range, anchored by the significant 200-day moving average at $6.93 and the critical support level of the 0.618 Fibonacci level ($6.7). This robust support zone is bolstered by substantial demand and has the potential to thwart further downward pressure, potentially propelling the price toward the significant resistance zone around $9.

The 4-Hour Chart
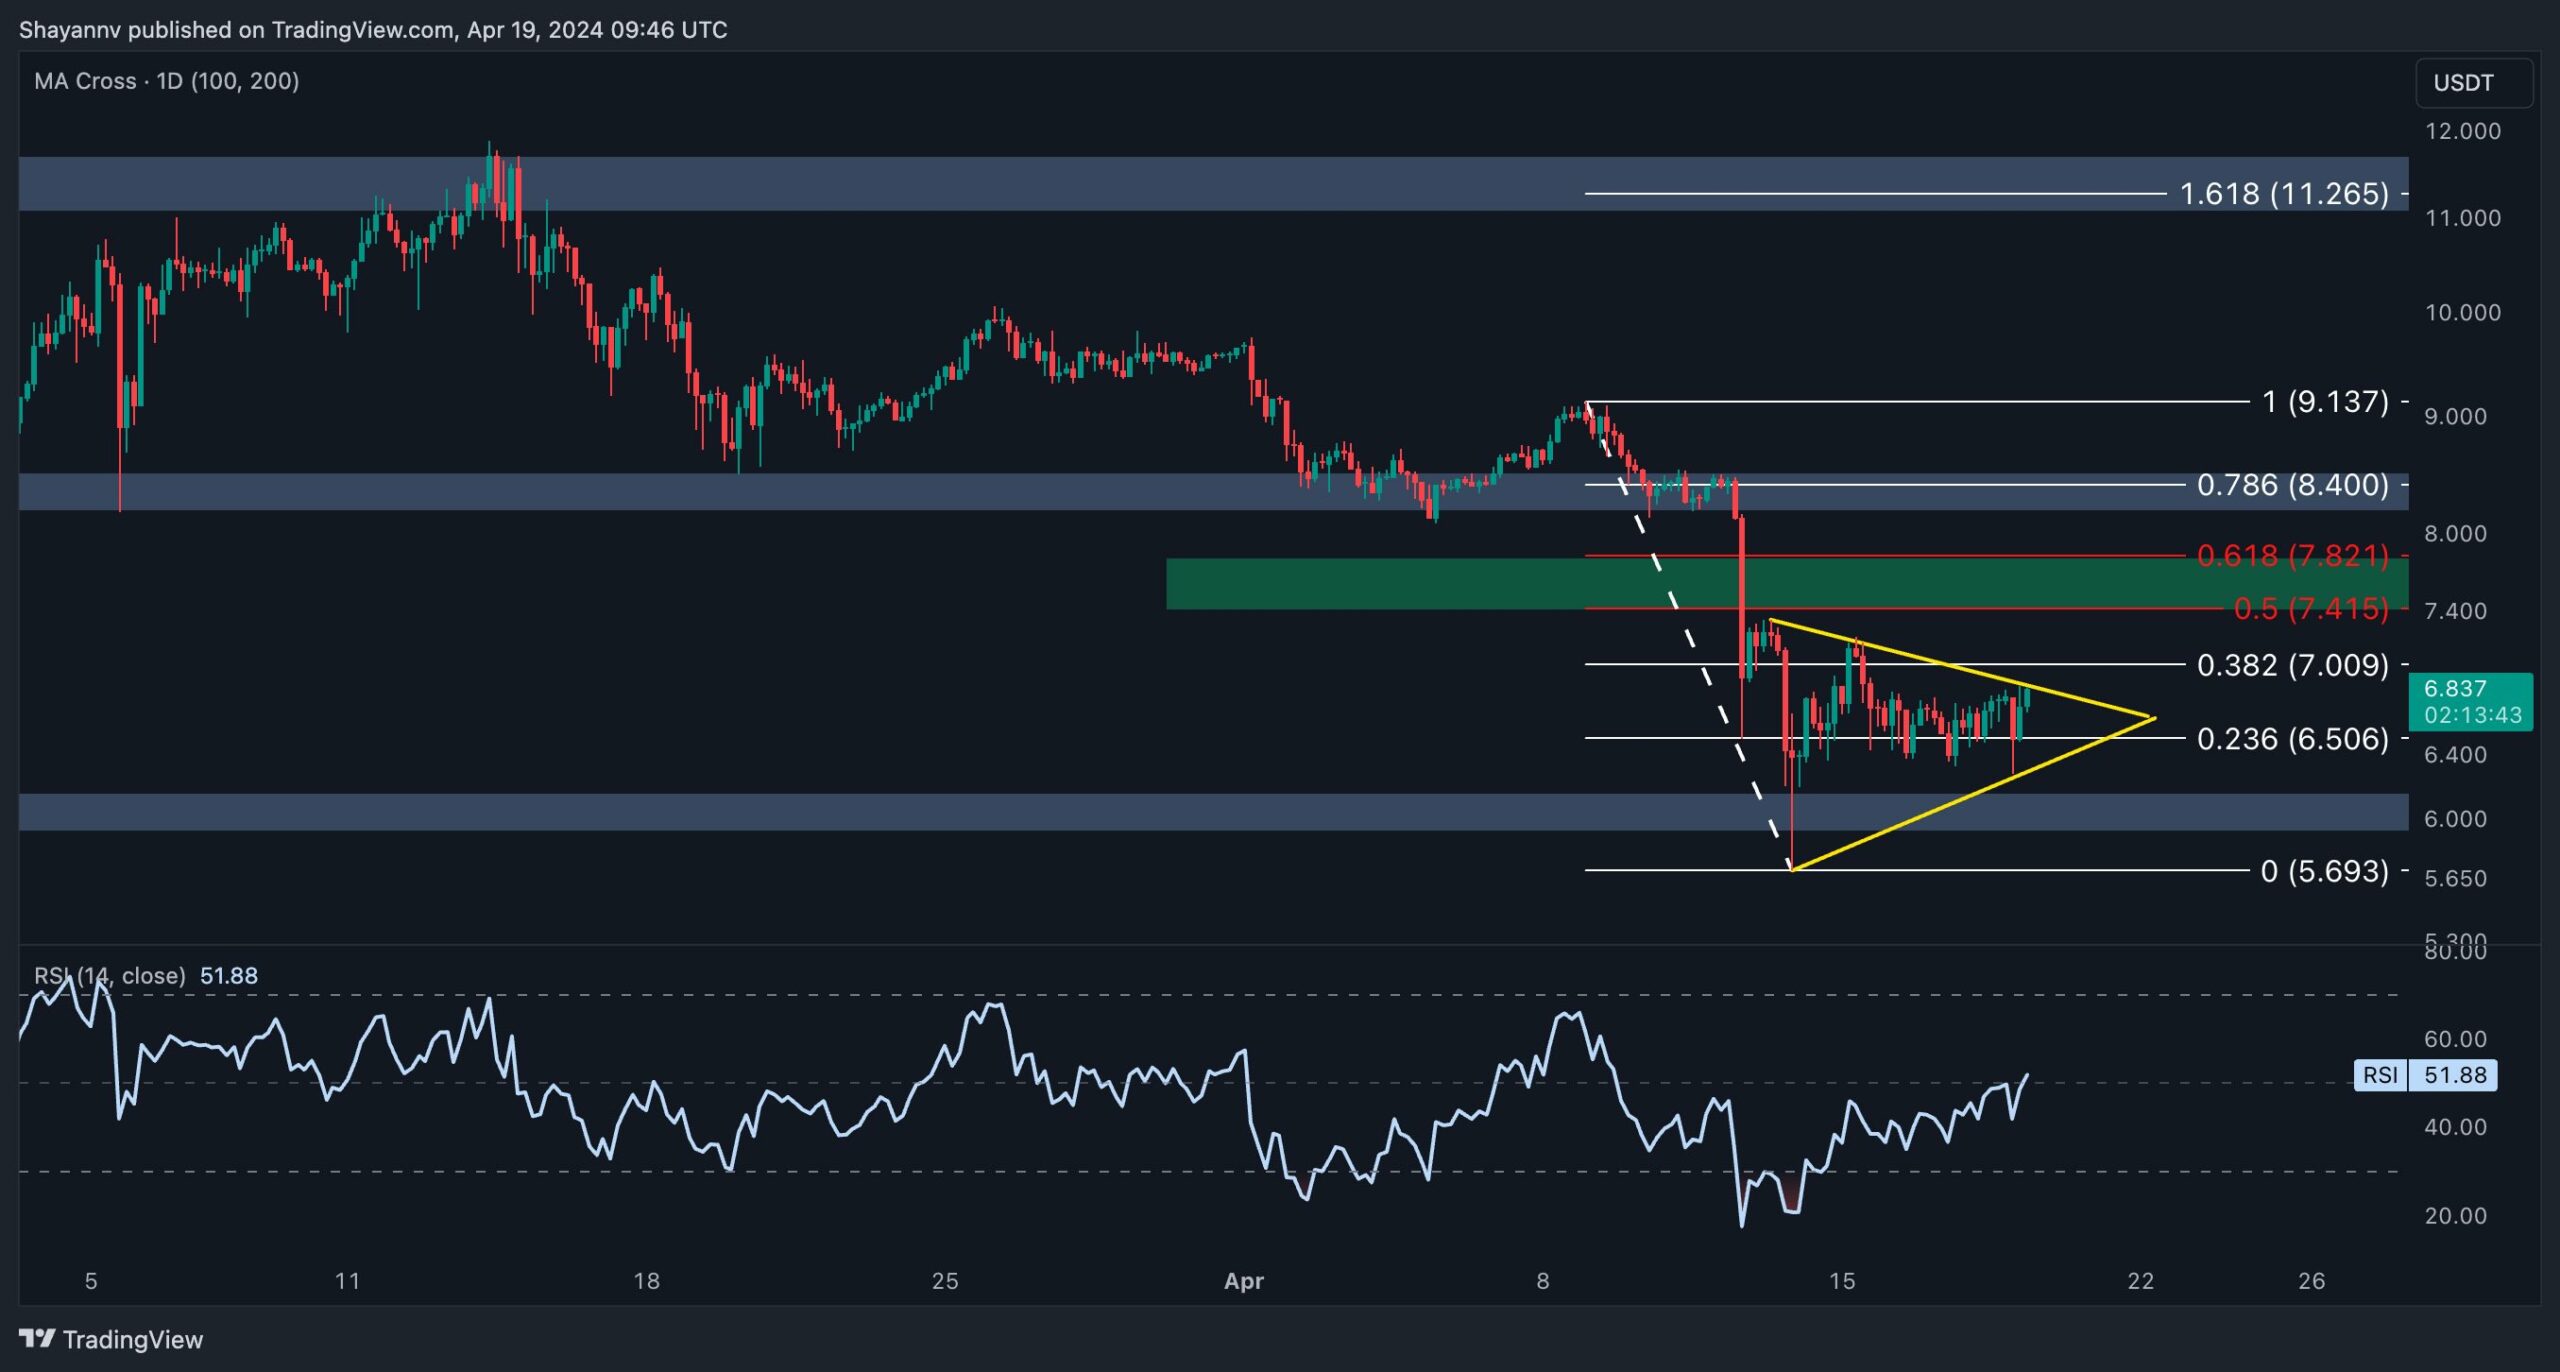
A detailed examination of the 4-hour timeframe reveals a rapid descent toward the $6 level, where the price encountered significant demand, leading to a slight reversal. However, the subsequent sideways consolidation phase has seen minimal volatility and a lack of decisive momentum.
Nevertheless, the price has formed a sideways triangle pattern, with a breakout above its upper boundary indicating a continuation of the bullish trend.
Currently, DOT teeters on the brink of breaking above this triangle pattern. If it happens, Polkadot is expected to sustain its upward trajectory, with potential targets lying within the price range defined by the 0.5 ($7.4) and 0.618 ($7.8) Fibonacci levels.
Conversely, a break below the lower boundary of the triangle pattern could signal a continuation of the bearish retracement toward the $6 level.
Sentiment Analysis
By Shayan
The significant impact of the perpetual futures market on Polkadot’s price dynamics cannot be overstated. Many short-term price movements, particularly those following periods of consolidation, are driven by liquidations within the futures market. Therefore, understanding where liquidity is most concentrated can offer valuable insights.
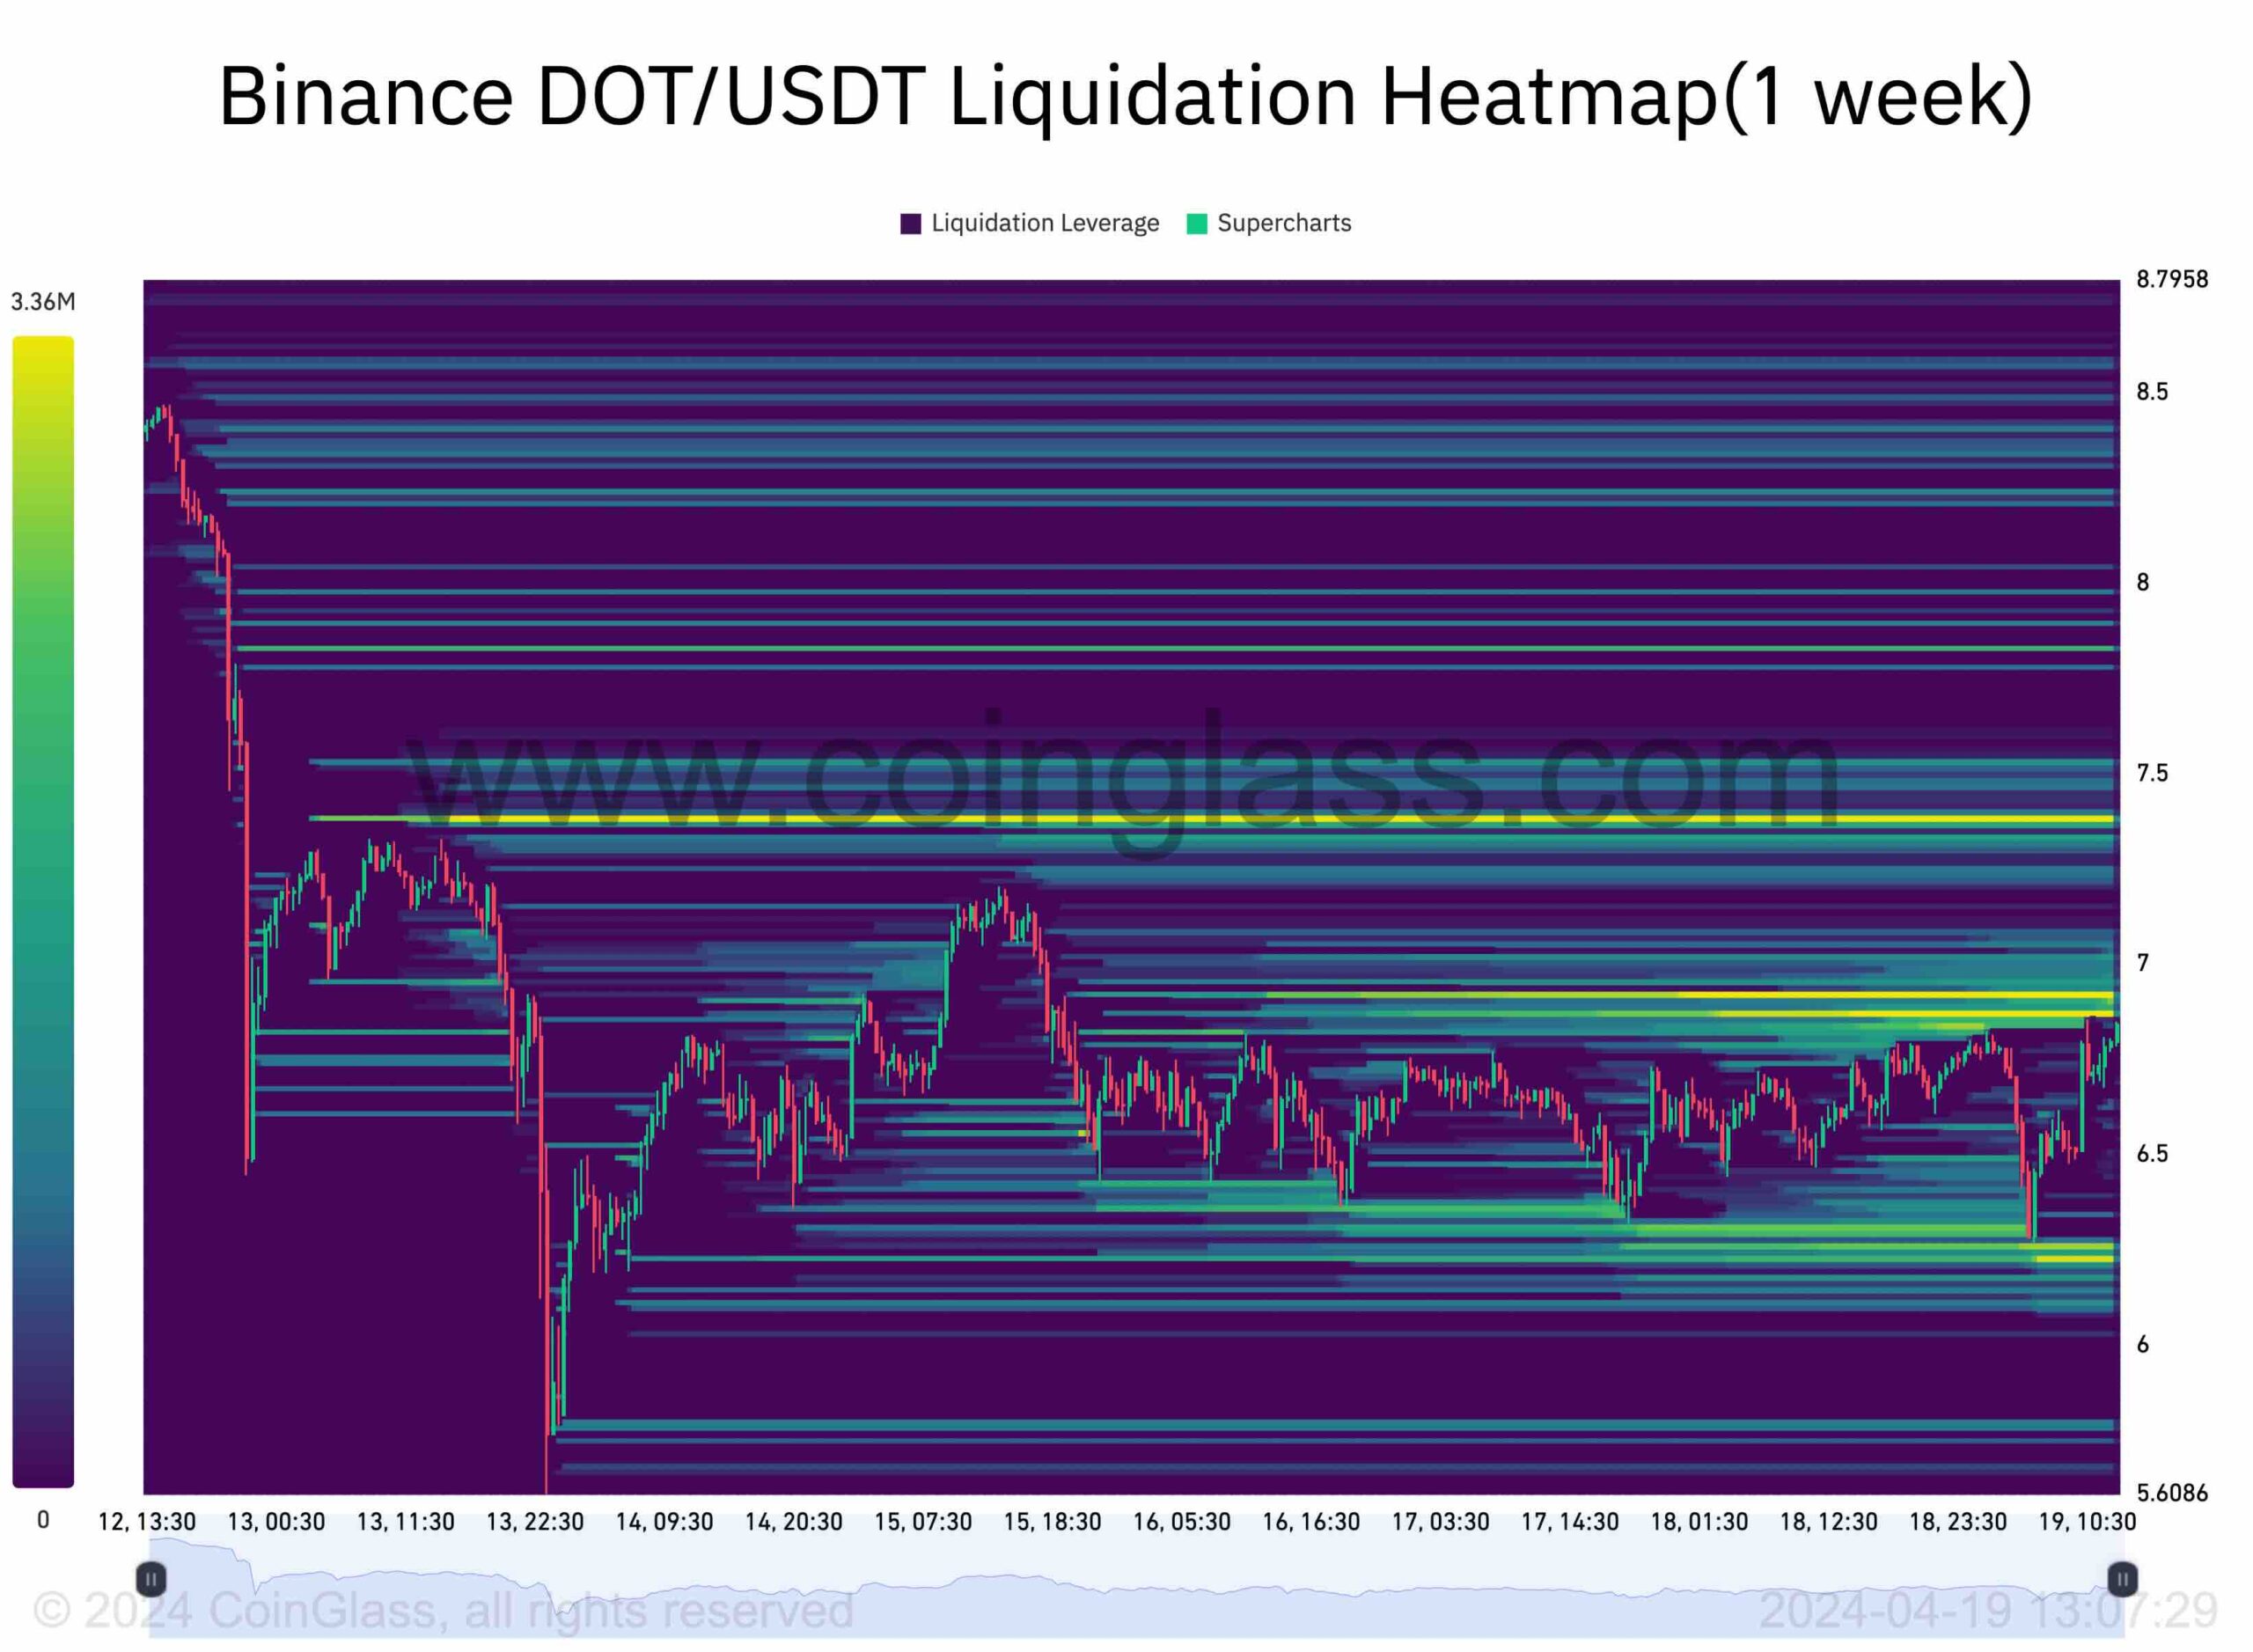
The Binance DOT/USDT liquidation heatmap provides a visual representation of price levels where large-scale liquidation events are likely to occur. Those highlighted in yellow on the chart signal the potential for a cascade of liquidations.
As illustrated in the chart, the $7 and $6 price zones are characterized by substantial liquidity. Consequently, if the price embarks on an upward surge toward the $7 threshold, it may trigger a significant liquidation cascade, resulting in heightened volatility and a notable short-term decline. Conversely, should the market retreat towards the $6 level, a rapid surge could ensue due to a cascade of long liquidations, leading to an immediate rebound.
These levels serve as crucial reference points in the short term and have the potential to shape the market trend in the weeks ahead.
LIMITED OFFER 2024 for CryptoPotato readers at Bybit: Use this link to register and open a $500 BTC-USDT position on Bybit Exchange for free!
Disclaimer: Information found on CryptoPotato is those of writers quoted. It does not represent the opinions of CryptoPotato on whether to buy, sell, or hold any investments. You are advised to conduct your own research before making any investment decisions. Use provided information at your own risk. See Disclaimer for more information.
Cryptocurrency charts by TradingView.
Bitcoin’s price faced extreme volatility in the days leading to the highly-anticipated fourth halving but has remained relatively still after its completion.
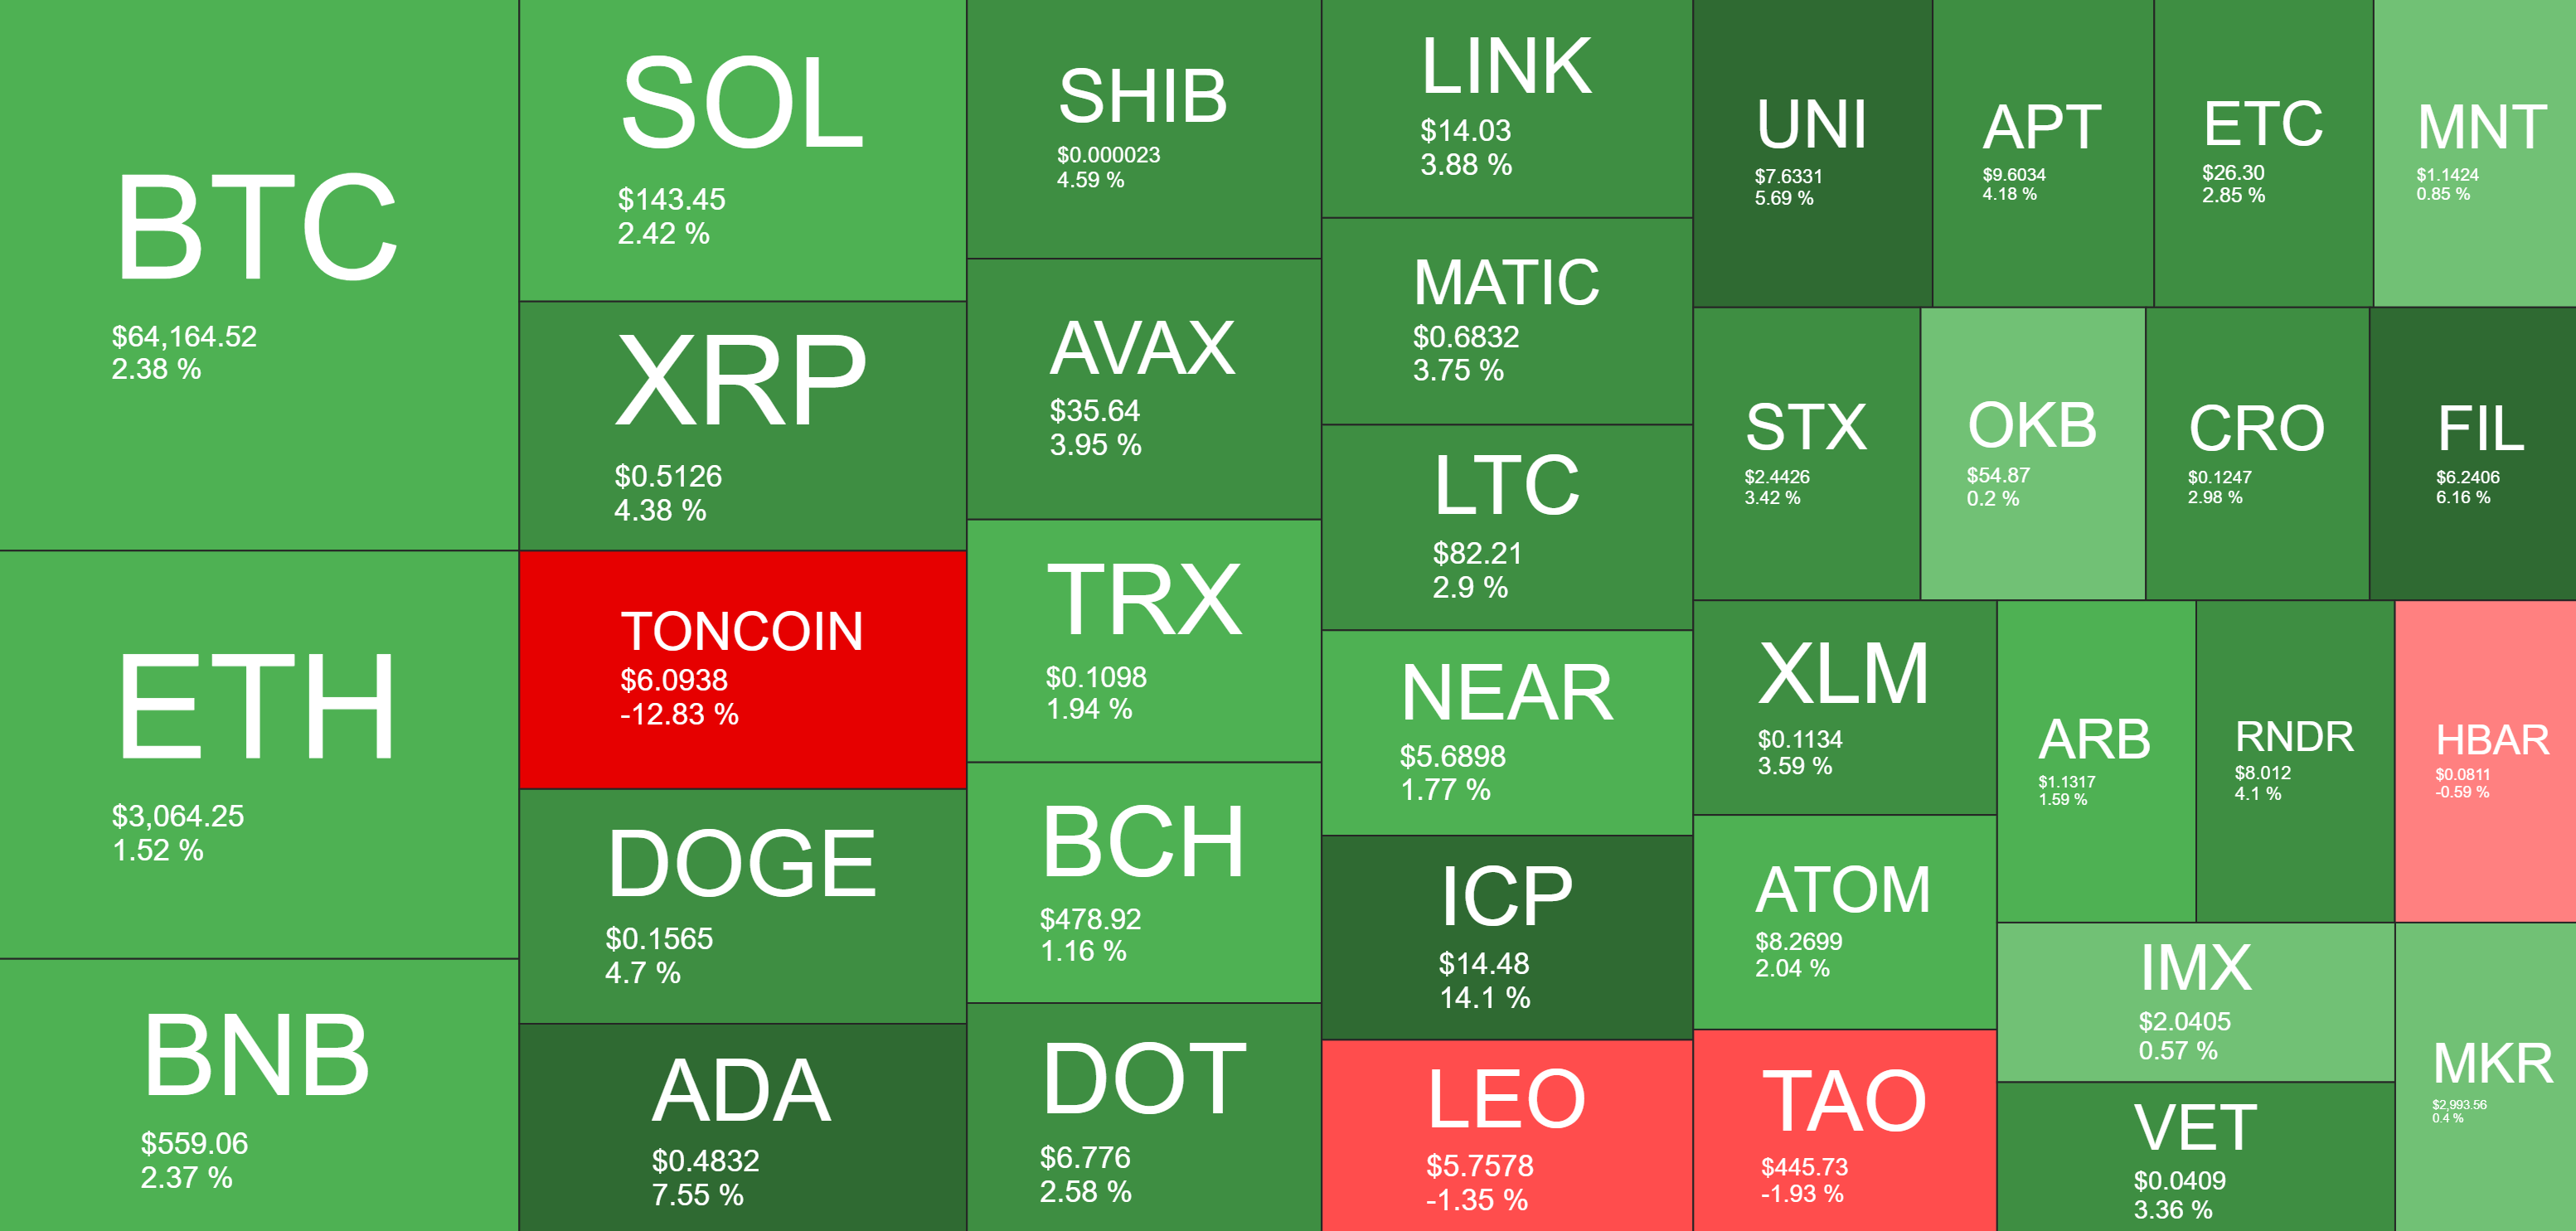
Most altcoins are slightly in the green on a daily scale, aside from TON, which has dumped by double-digits despite the big news coming from Tether.
BTC’s Calmness After Halving
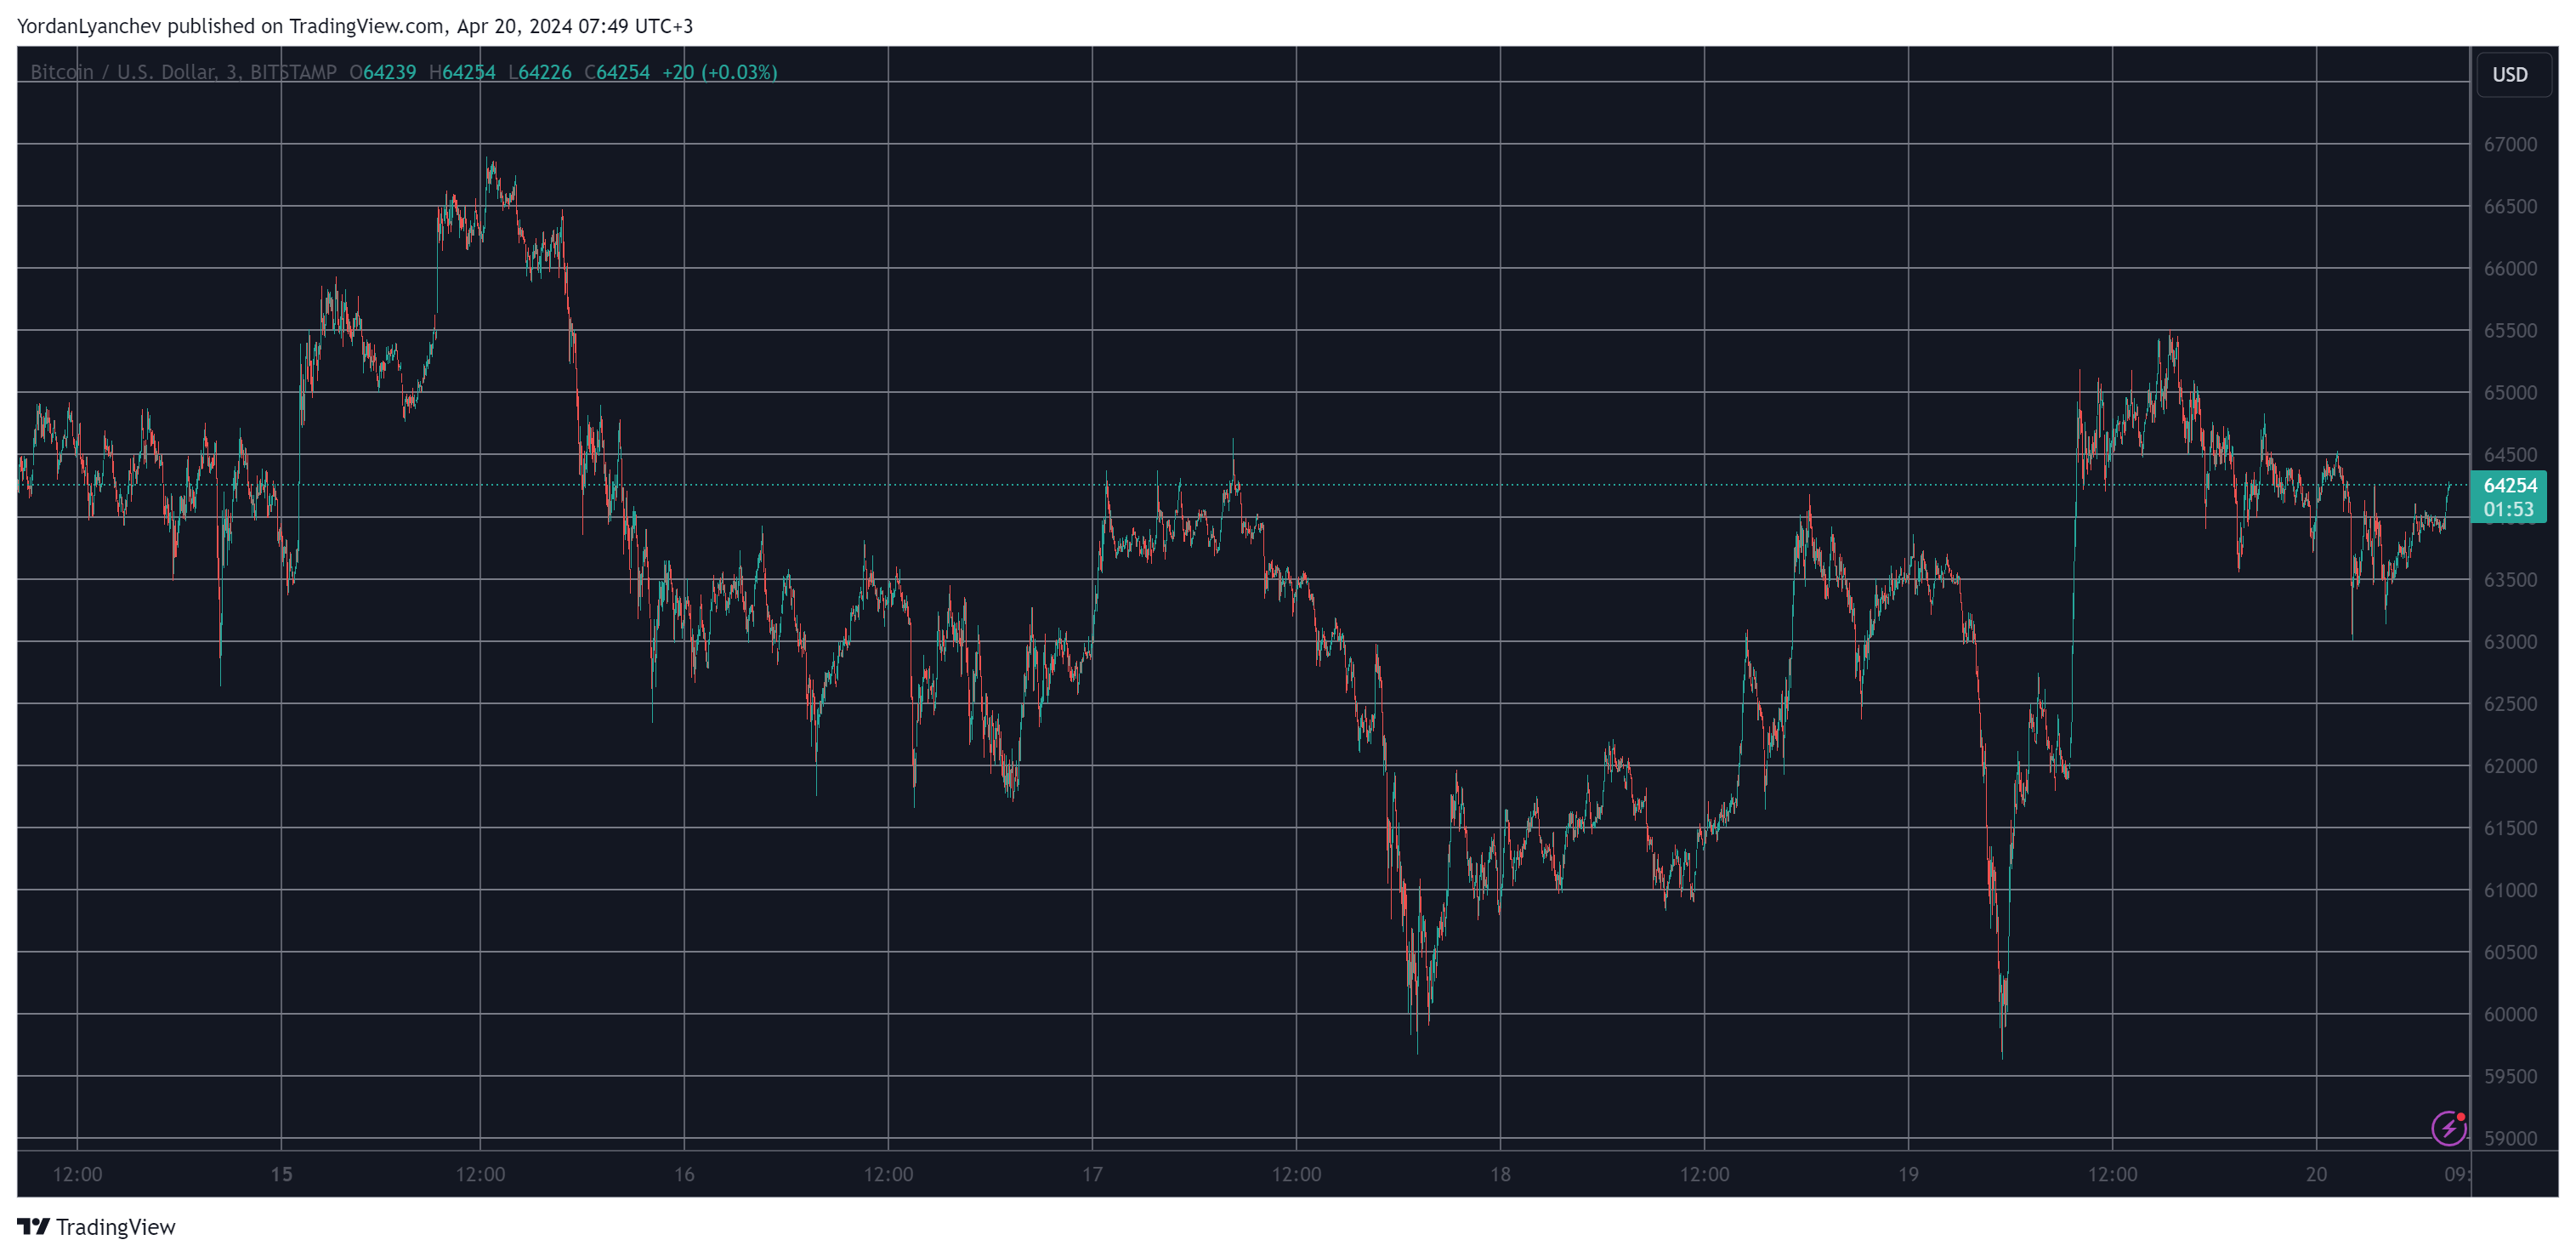
The adverse price developments for Bitcoin started last Friday when the asset slumped from over $71,000 to $65,000. It recovered a couple of grand on the next day but further dumped to $61,000 hours later amid growing conflict between Israel and Iran.
After another unsuccessful rebound attempt on Monday, the cryptocurrency started losing value during the business week as well. Israel’s attack against Iran from earlier this week brought another price decline for BTC, which tumbled below $60,000 this time.
However, it quickly bounced off and spiked to $65,000 hours later as Iran said there will be no retaliation soon. The past 24 hours have been a lot less eventful, even though the Bitcoin network was preparing for the fourth halving.
The completion of the event happened hours ago, reducing the block rewards to 3.125 BTC. So far, Bitcoin’s price has remained relatively stable as it stands around $64,000.
Its market capitalization is at over $1.250 trillion and its dominance over the alts is at 51.5% on CG.
ADA, ICP on the Run
Perhaps the most notable news, aside from the halving, came from Tether and Ton yesterday. The former announced that it will launch two of its largest stablecoins on the latter’s network. This impacted TON’s price immediately, with a price surge but also with a massive decline in the hours after that. As of now, the asset is down by 12%.
In contrast, ICP has soared by 13% and trades above $14. ADA is up by 7% and has neared $0.5. The rest of the larger-cap alts are also in the green, albeit in a more modest fashion.
The total crypto market cap remains calm at around $2.450 trillion on CoinGecko.
LIMITED OFFER 2024 for CryptoPotato readers at Bybit: Use this link to register and open a $500 BTC-USDT position on Bybit Exchange for free!
Disclaimer: Information found on CryptoPotato is those of writers quoted. It does not represent the opinions of CryptoPotato on whether to buy, sell, or hold any investments. You are advised to conduct your own research before making any investment decisions. Use provided information at your own risk. See Disclaimer for more information.
Cryptocurrency charts by TradingView.

 Forex2 years ago
Forex Today: the dollar is gaining strength amid gloomy sentiment at the start of the Fed’s week
- Forex2 years ago
How is the Australian dollar doing today?
- Forex1 year ago
Unbiased review of Pocket Option broker
- Forex2 years ago
Dollar to pound sterling exchange rate today: Pound plummeted to its lowest since 1985
- Cryptocurrency2 years ago
What happened in the crypto market – current events today
- World1 year ago
Why are modern video games an art form?
- Stock Markets2 years ago
Morgan Stanley: bear market rally to continue
- Economy2 years ago
Crude oil tankers double in price due to EU anti-Russian sanctions