
TRON Price Chart
Cryptocurrency News
MORE NEWS
Ethereum Foundation, Whales, and Hackers: What’s Driving the ETH Sell-Off?
TL;DR Whales, hackers, and the Ethereum Foundation wallets moved over $500M in ETH through large sales and withdrawals. Ethereum transfers rose to 4.6M ETH, nearing...

Massive DOGE Whale Activity Hints at $1 Breakout
TL;DR Whales bought two billion DOGE this week, lifting their combined holdings to 27.6 billion coins. A single 900M DOGE transfer worth $208M to Binance...
Ripple Price Analysis: XRP at Risk as Key Support Levels Could Trigger Sharp Drop
XRP has recently entered a consolidation phase after a strong rally earlier this summer, with the price action now hovering around key resistance levels on...
Solana’s $200 Comeback Is No Mere ‘Speculative Pop’ – Here’s Why
Solana (SOL) has emerged as one of the month’s top gainers, rising over 20% as optimism spreads across the crypto market. Analysts say Solana’s return...

Ethereum-based Meme Coin Pepeto Nears Stage 10, Raises Over $6.18M in Presale, as Ethereum Eyes $10,000
[PRESS RELEASE – Dubai, UAE, August 15th, 2025] Early-stage Crypto presales present a rare opportunity for investors to get in at the lowest valuations before...
Tron (TRX) was among those lucky cryptocurrencies that managed not to drop by 90+%. The Tron crypto price chart shows that the coin fell only by 63% from its ATH. Read on to see our Tron price chart analysis!
What’s on the Tron historical price chart
The cryptocurrency market continues to give out its surprises. Many crypto projects are striving to improve their technologies in order to remain competitive. Tron is one of the active platforms that updates its ecosystem quite often. That’s why the Tron coin price chart is so strong.
Tron is an open-source blockchain protocol designed to deploy a decentralized ecosystem with simplified mechanisms for creating and hosting entertainment applications and content on the network that users can share without intermediaries. Its strong connection to BitTorrent allows TRX users to directly access:
- applications,
- content,
- media on the network.
Tron is a platform that has built strong partnerships and projects in the crypto industry. A few months ago, Alchemy Pay integrated with Tron to allow TRX payments in partnership. Investors received an investment return of around 7.6% last year. Quite a good indicator for the Tron coin price chart.
TRX theses days
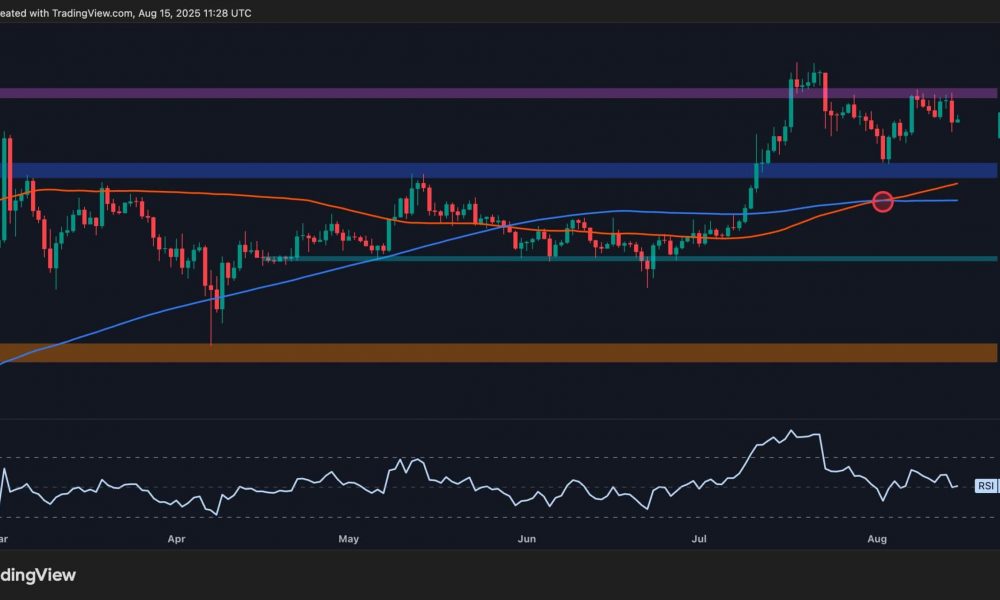
At the time of Tron price chart analysis writing, the asset is trading at $0.066 with a 24-hour trading volume of $706 billion. The Tron price chart USD has shown an increase of 50% in the last 15 days.
Currently, the leading cryptocurrency exchanges for trading TRX are:
- Binance,
- Huobi Global,
- Bithumb,
- Kucoin,
- Gate.io.
What’s the future for the Tron cryptocurrency price chart?
The Tron crypto price chart shows that the coin has performed better over the past few days. However, the price of TRX has decreased by more than 30% in the last months.
If BTC continues its bullish trend, TRX could move with the bulls, breaking the $0.0874 resistance level 1 and rising higher to $0.1234 at resistance 2, which is a bullish signal for 2022.
Conversely, if investors lose interest in the project (for example against the backdrop of USDD depeg), the bears can take over and dethrone TRX from the uptrend position. Simply put, the price of TRX could drop to almost $0.0536 which is a bearish signal.
Meanwhile, our long-term Tron price chart live prediction for 2022 is optimistic. It has a high chance of surpassing its current all-time high (ATH) at around $0.3004 this year, according to CoinMarketCap. However, this scenario can only happen if the asset breaks previous psychological resistance. Also you can see Solana and Uniswap price prediction.
Will FUD from USDD influence the Tron cryptocurrency price chart?
Justin Sun did a great job by turning all the crypto family members’ eyes to his stablecoin USDD. Now, this thing played a trick on him as investors could take USDD’s depeg not that seriously.
Currently, everything is in the team’s hands since only they can save the project. Despite all the uniqueness of the technology, unfortunately, the Tron coin price chart can really suffer from this issue.

