Commodities
Energy & precious metals – weekly review and outlook


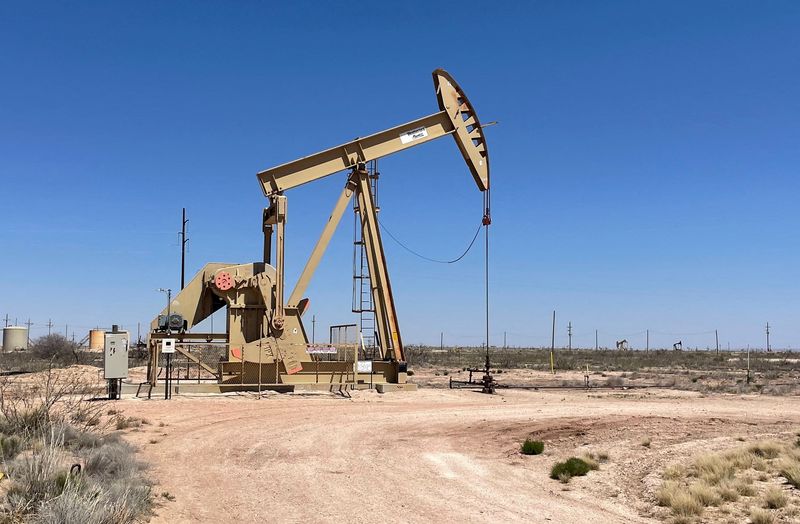
© Reuters.
Investing.com – Lots of things are happening in the oil market at the same time: Economic troubles in China; surprisingly higher U.S. crude production and Saudi-Russian cuts that cargo tracking data suggest could remove almost 68 million barrels from the market over the next 45 days.
With so many things going on, it’s anyone’s guess what price direction could be in the coming week, though technicals suggest a correction extending from the prior week, amid questionable summer demand for petroleum products and market optics that could be worse if not for the artificially-suppressed Saudi-Russian output.
Whatever the case, the current market drivers in oil need to be examined in detail to determine their merit.
First off, is the Chinese bear, or rather the bearish state of affairs in the world’s number two economy and top oil importer.
Evergrande (HK:), one of China’s biggest names in real estate, filed Thursday for Chapter 15 bankruptcy, which is a way for foreign companies to use U.S. bankruptcy law to restructure debt. The process will take time, as Evergrande has roughly $19 billion in offshore debts.
The filing serves as a cautionary tale about the growth-at-all-costs model that underpinned China’s spectacular growth over the past 30 years. For decades Evergrande gobbled up debt as China’s economy exploded. Demand for housing was so strong, homebuilders often pre-sold apartment units to buyers before construction was complete.
But a sudden shift in policy by China’s leaders two years ago has left the country’s property developers scrambling for cash, compounding financial risks.
Evergrande’s crisis raises questions on which would be the next shoe to drop on the Chinese economy. And that appears to be Country Garden (OTC:), another major name in realty that employs some 300,000 people. The firm has already missed two payments on its multibillion-dollar debt and said it was considering “various debt management measures.”
July was a particularly woeful month for China, with one bad patch of economic data after another, from bank loans at a 14-year low and exports sliding their most since February 2020. The yuan also tumbled against the dollar, adding to the weight on commodities, particularly oil.
The People’s Bank of China unexpectedly cut short and medium-term lending rates earlier this week, but investors are calling for more targeted fiscal measures.
From China, we move to U.S. crude production, which the Energy Information Administration said hit three-year highs for a second week in a row, on what appeared to be higher drilling efficiency.
It was quite an astounding assessment by the Energy Information Administration, when the number of in the country had tumbled double-digits this year.
From a 2023 high of 623 on Jan 13, the U.S. oil rig count had dwindled to just 520 as of Aug 18 – down 15%.
Even so, the EIA estimated domestic crude production at 12.7 million barrels per day for the week ended Aug 11, overwriting its previous daily projection of 12.6M during the prior week to Aug 4.
Before these back-to-back weeks, the agency had never projected such a high number for U.S. oil production, which it had maintained at between 12M and 12.2M barrels per day over the past year, since output began recovering from the 9.7M low seen in the aftermath of the coronavirus outbreak. Production was at a record high of 13.1M barrels daily in March 2020, just as the pandemic was setting in.
The oil output estimate contained in the EIA’s Weekly Petroleum Status Report isn’t the only one by the agency that gives an idea of what the world’s largest driller of the commodity is doing in terms of output.
The EIA’s estimates for U.S. oil production is even higher on its Short-Term Energy Outlook. The latest version of the so-called STEO, published Aug 15, says output is expected to average 12.81M barrels per day in the third quarter of this year and 12.93M by the fourth.
Even more startling, by the second quarter of 2024, U.S. production is seen rising to 13.01M per day, before reaching 13.08M in the third and 13.27M by the fourth. Essentially, it means U.S. production will be at a new record high by the end of next year.
Finally, we come to global crude supplies, which, according to Kpler, saw a dramatic drop in crude exports from OPEC+ in the first 15 days of August.
Kpler data shows China and India buying just 2.6M barrels per day from Russia in July, compared with their typical combined purchase of 4.5M barrels daily. This suggests that some 1.9M barrels of Russian crude sales were impacted last month, possibly due to Urals crude being priced higher than the $60-per-barrel cap allowed by the G7 under sanctions against Moscow.
Combined Saudi and Russian cuts over the next 45 days could take away 67.5M barrels, energy markets advisory HFI Research said.
As I said at the outset, it’s anyone’s guess what the net impact of these trifecta of oil market drivers will be, though the China bear and weaker technicals seem to have the edge now. We’ll see.
Oil: Market Settlements and Activity
Crude prices settled Friday’s trade higher, extending their rebound from Thursday. But the two-day rise was too late and too little to make up for the losses in the first three days of the week. The net outcome was a drop on the week that ended the seven-week rally in oil.
New York-traded West Texas Intermediate, or , crude performed a final trade of $81.40, after officially ending Friday’s session up 86 cents, or 1%, at $81.25 per barrel. Notwithstanding that, WTI still finished the week down 2.3%.
That was a breakaway from a previous seven-week rally triggered by a bull fervor over Saudi production cuts that lifted the U.S. crude benchmark by 20% in that period, resulting in a 9-month high of $84.89 for a barrel.
London-based crude finished the New York did a final trade of $84.82 after officially ending the session up 68 cents, or 0.8%, at $84.80. For the week, Brent was down 2.8% after a seven-week rally that gave oil bulls an 18% return and a seven-month high of $88.10.
Oil: WTI Price Outlook
For the week ahead, the 100-week SMA, or Simple Moving Average, of $85.60 becomes immediate resistance for WTI, said Sunil Kumar Dixit, chief technical strategist at SKCharting.com.
This will be followed by a higher bar at the monthly Middle Bollinger Band of $86.80.
“This $85.60-$86.80 resistance zone is critical as this zone holds the key to further course of price action and trend continuation or reversal,” Dixit said.
A break below the 50-week EMA, or Exponential Moving Average, of $78.95 is likely to extend WTI’s decline towards the 50 Day EMA of $77.60, followed by the 200-day SMA of $76.10 and the weekly Middle Bollinger Band of $75.55, he said.
“Stability above daily Middle Bollinger Band of $81.20 will keep the short-term bias positive with an upward move towards retesting the swing high of $84.90, and the higher resistance at the 100-week SMA of $85.60 and the monthly Middle Bollinger Band of $86.80,” Dixit added.
Gold: Market Settlements and Activity
The conviction that gold has found a secure home at above $1,900 an ounce is being challenged by lower monthly milestones in the yellow metal’s price. And a fourth weekly loss.
Gold futures’ most-active on New York’s Comex did a final trade at $1,918.40 an ounce, after officially settling Friday’s trade at $1,916.50, up $1.30, or 0.01%, on the day. For the week though, December gold lost just over $30, or 1.5%.
, which tracks real-time physical dealings in bullion and is more closely followed than futures by some gold traders, settled at 1,889.42, up 5 cents on the day.
With the spot price of bullion already in $1,800 territory, it’s not certain how much longer those long gold futures can hang to the $1,900 ropes, say analysts. Since the start of this week, the rally in the dollar had become overbearing for gold.
Gold: Price Outlook
Gold continues to remain subdued under consistent bearish pressure as the rise to 103.58 fuels concerns that the currency indicator could move up to 104.60 next, said SKCharting’s Dixit.
That could spot gold towards $1,850, he cautioned.
“The Dollar Index needs to break below 103 and 102.60, followed by 101.60, for a resumption of gold’s uptrend,” Dixit said.
“As long as spot gold maintains stability below the 5-day EMA of $1896, a break below $1,885 remains a high probability, keeping the door open for a further decline towards $1,878-$1,868. If weakness remains, tests of major downside support at the monthly Middle Bollinger Band of $1,850 and the 100-week SMA of $,1846, will follow.”
For a rebound, recovery above the 5-Day EMA of $1,896 needs to be followed by a clearing of the 200-day SMA of $1,907, Dixit said.
A short-term bullish wave will form if spot gold could find its way toward the $1,929-$1,935-$1,940 resistance zone.
“Major upward resistance is seen at the weekly Middle Bollinger Band of $1,959, followed closely by the 100-day SMA $1,962,” Dixit added.
Natural gas: Market Settlements and Activity
In Friday’s session, the front-month gas contract on the New York Mercantile Exchange’s Henry Hub settled down 7 cents, or 2.7%, at $2.551 per million metric British thermal units, or mmBtu.
Gas has had a volatile week, reaching a near seven-month high of $3.018 on Wednesday. Prior to that, the last time gas prices on the hub crossed $3 was during the week to Jan. 20, or eight months ago, when they peaked at $3.595.
The market returned to mid-$2 levels after the weekly U.S. report on saw an injection of 35 billion cubic feet, or bcf — just above the 34 bcf forecast by analysts and much higher than the previous week’s build of 29 bcf.
Natural gas: Price Outlook
Natural gas has been revisiting support areas and price action shows a consolidated decline towards the 100-day SMA statically aligned with $2.44, said SKCharting’s Dixit.
“A daily close below the Middle Bollinger Band $2.67 of keeps momentum under pressure and this is the zone required to be reclaimed for initial signs of resuming an uptrend,” he said. “A sustained break above this area will call for further upside towards $2.86, followed by the swing high towards $3.01.”
Major upside targets from here will be the 200-day SMA of $3.24 and the 50-week EMA of $3.53, Dixit said.
On the flip side, a break below the horizontal 100-day SMA of $2.44 will push gas towards $2.25 and extend its bearish run to $1.95, he added.
Disclaimer: Barani Krishnan does not hold positions in the commodities and securities he writes about.


 Forex3 years ago
Forex Today: the dollar is gaining strength amid gloomy sentiment at the start of the Fed’s week
- Forex3 years ago
Unbiased review of Pocket Option broker
- Forex3 years ago
Dollar to pound sterling exchange rate today: Pound plummeted to its lowest since 1985
- Forex3 years ago
How is the Australian dollar doing today?
- Cryptocurrency3 years ago
What happened in the crypto market – current events today
- World3 years ago
Why are modern video games an art form?
- Commodities3 years ago
Copper continues to fall in price on expectations of lower demand in China
- Economy3 years ago
Crude oil tankers double in price due to EU anti-Russian sanctions


