Cryptocurrency
Is The Solana Price Rally Over? SOL Growth Stalls as New Altcoin Sees Promising Growth
Solana (SOL) took the crypto world by storm throughout November and early December, with incredible gains of over 490% that helped push the token to a high of $125.65.
However, since that peak, SOL has struggled to regain momentum, prompting some investors to ponder whether the token’s rally is finally over.

Solana Slumps Back to $105 As Momentum Fizzles Out
With SOL closing in the red for three consecutive days, it’s now trading at around $105.80, marking a 16% decrease from Monday’s price.
This retracement comes as trading volumes and hype have cooled off following the buying frenzy over the past 12 weeks.
From a technical perspective, Solana had become massively overbought by mid-December.
The RSI reached peak levels above 85 on the daily time frame, indicating that a correction was looming.

Now that the RSI has normalized back to 65, SOL may find support around the $100 level, which is seen as a crucial psychological barrier.
If the bearish trend persists, SOL’s 50-day exponential moving average (EMA) near $75 may act as a support level.
A by-product of Solana’s dip is that Binance Coin (BNB) has flipped SOL in market cap to become the world’s 4th largest cryptocurrency.
Daily spot trading volumes have also taken a slight hit – suggesting that investors are reassessing their positions.
Ethereum Seizes Opportunity Amid Solana’s Decline
While Solana struggles, its main rival, Ethereum (ETH), has started gaining bullish momentum.
ETH has climbed over 7% in the past few days to around $2,340, significantly outperforming SOL during the same period.
As a result, the SOL/ETH pair has dropped sharply, suggesting that traders are rotating capital out of SOL and into ETH.
This rotation again raises questions about Solana’s ability to maintain strength as Ethereum recovers.
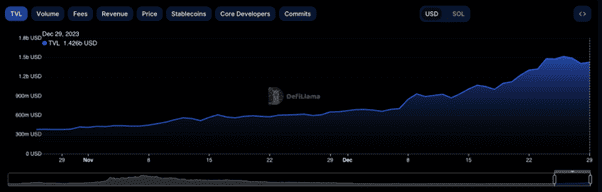
Adding further pressure is the decline in Solana’s total value locked (TVL), which has dropped by around $100 million since December 26, according to DeFiLlama.
With less SOL locked into ecosystem apps, more supply is freely circulating and potentially hitting the market.
This potential increase in selling liquidity is also hampering Solana’s price growth.
Regardless, many traders believe that the current pullback is only temporary and that SOL will regain its footing once the market sentiment shifts.
Viral Presale Project Bitcoin Minetrix Emerges as Potential for Next Big Crypto
As Solana loses steam, the timing may be right for a new player to emerge and captivate the crypto community.
One project aiming to do just that is the ambitious Bitcoin Minetrix (BTCMTX) project, which seeks to shake up the crypto mining scene.
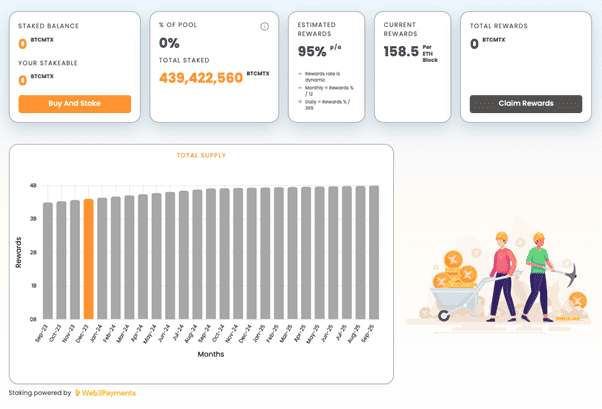
Bitcoin Minetrix’s main feature, “Stake-to-Earn,” allows everyday investors to participate in BTC mining without advanced hardware or technical expertise.

This is achieved by investors staking BTCMTX tokens to earn cloud mining credits, which can be used to mine BTC virtually or exchanged for a share of the associated mining yields.
On top of that, Bitcoin Minetrix also has a staking protocol offering yields of 95% per year, paid out in BTCMTX tokens.
These two lucrative earning mechanisms make Bitcoin Minetrix an exciting new entry to the crypto space.
As disillusionment with Solana sets in, Bitcoin Minetrix could attract investors searching for alternative tokens with clearer prospects.
Although still in its presale phase, Bitcoin Minetrix has already secured over $6.6 million in funding.
Stage 16 of the presale is ongoing, allowing early investors to buy BTCMTX tokens for $0.0125 before their exchange debut.
More than 7,900 people have joined Bitcoin Minetrix’s Telegram channel, showcasing the significant community interest in the project.
In summary, as SOL experiences a downturn, Bitcoin Minetrix appears well-positioned to capitalize, thanks to its innovative blend of crypto mining and DeFi tokenomics.
Visit Bitcoin Minetrix Presale
Disclaimer: The above article is sponsored content; it’s written by a third party. CryptoPotato doesn’t endorse or assume responsibility for the content, advertising, products, quality, accuracy, or other materials on this page. Nothing in it should be construed as financial advice. Readers are strongly advised to verify the information independently and carefully before engaging with any company or project mentioned and do their own research. Investing in cryptocurrencies carries a risk of capital loss, and readers are also advised to consult a professional before making any decisions that may or may not be based on the above-sponsored content.
Readers are also advised to read CryptoPotato’s full disclaimer.
Binance Free $100 (Exclusive): Use this link to register and receive $100 free and 10% off fees on Binance Futures first month (terms).

TL;DR
- Whales, hackers, and the Ethereum Foundation wallets moved over $500M in ETH through large sales and withdrawals.
- Ethereum transfers rose to 4.6M ETH, nearing the monthly high of 5.2M recorded in July.
- Staking inflows hit 247,900 ETH, the highest in a month, locking more supply from trading.
Large Withdrawals and Whale Activity
Ethereum (ETH) has seen heavy movement from major wallets over the past few days. On-chain data from Lookonchain shows a newly created wallet pulled 17,591 ETH, worth $81.62 million, from Kraken in just two hours.
Over three days, two new wallets withdrew a combined 71,025 ETH, valued at $330 million, from the exchange.
One of these wallets, address 0x2A92, has withdrawn 53,434 ETH, worth $242.34 million, in two days. This includes a recent purchase of 30,069 ETH, valued at $138.46 million, during a market drop.
Major ETH Holders Offload Millions Amid Price Rally
In contrast, several separate entities have been disposing of some ETH holdings. A wallet tied to a hacker address 0x17E0 sold 4,958 ETH for $22.13 million at $4,463, securing a profit of $9.75 million. Earlier this year, the same address sold 12,282 ETH at $1,932 and later bought back part of the amount at higher prices.
A different whale sold 20,600 ETH for $96.55 million over the past two days, generating a profit of more than $26 million after holding the position for nine months.
Meanwhile, an Ethereum Foundation-linked wallet, 0xF39d, sold 6,194 ETH worth $28.36 million in the last three days at an average price of $4,578.
Recent sales from the same wallet included an additional 1,100 ETH and 1,695 ETH for over $12.7 million combined.
The #EthereumFoundation-linked wallet(0xF39d) sold another 1,300 $ETH($5.87M) at $4,518 ~11 hours ago.
Over the past 3 days, this wallet has sold a total of 6,194 $ETH($28.36M) at an average price of $4,578.https://t.co/4hfCWymHVG pic.twitter.com/ErUyEY8SJy
— Lookonchain (@lookonchain) August 15, 2025
Network Activity on the Rise
CryptoQuant data shows Ethereum’s total tokens transferred have been climbing since August 9. After ranging between 1 million and 3 million ETH through late July and early August, transfers have risen to 4.6 million ETH, approaching the monthly high of 5.2 million recorded in mid-July. This increase has occurred alongside a price rally from about $3,400 to $4,600.

Interestingly, staking inflows generally stayed between 20,000 and 80,000 ETH per day over the past month. On August 14, inflows jumped to 247,900 ETH, the highest in the period.
At the time, ETH was trading near $4,600. Large staking deposits reduce the amount of ETH available for immediate trading, as staked coins are locked for a set period.

In the meantime, ETH trades at $4,647 with a 24-hour volume of $68.25 billion, down 2% on the day but up 19% over the week.
Binance Free $600 (CryptoPotato Exclusive): Use this link to register a new account and receive $600 exclusive welcome offer on Binance (full details).
LIMITED OFFER for CryptoPotato readers at Bybit: Use this link to register and open a $500 FREE position on any coin!

TL;DR
- Whales bought two billion DOGE this week, lifting their combined holdings to 27.6 billion coins.
- A single 900M DOGE transfer worth $208M to Binance drew attention to large exchange movements.
- DOGE broke key resistance, with momentum building for a possible push toward the $1 price mark.
Price and Market Moves
Dogecoin (DOGE) traded at $0.23 at press time, slipping 4% over the past day but still showing a 2% gain for the week. Daily turnover came in at about $6.18 billion.
Meanwhile, the broader crypto market saw over $1 billion in liquidations. Hotter-than-expected US Producer Price Index data pushed traders to scale back expectations of a near-term Federal Reserve rate cut. DOGE had roughly 290,500 coins liquidated during the sell-off.
On the two-week chart, analyst Trader Tardigrade notes that DOGE has cleared a downward-sloping resistance line after completing what appears to be a “wave V” in an Elliott Wave sequence. Similar setups in the past, where prolonged declines stayed within falling channels before breaking higher, have been followed by sharp rallies.
$Doge/2-week#Dogecoin is gaining strong momentum to surge above $1 pic.twitter.com/TuSEKr19nv
— Trader Tardigrade (@TATrader_Alan) August 15, 2025
Momentum gauges are also turning up. The Stochastic RSI, which had dropped into oversold territory, is now heading higher. Previous reversals from this zone have coincided with sustained upward moves. The current formation points to a possible run that could carry DOGE past the $1 mark.
Heavy Whale Buying and Large Transfers
As reported by CryptoPotato, blockchain data shows large investors have added two billion DOGE in the past week, spending just under $500 million. That brings their holdings to about 27.6 billion coins, or 18% of the supply. The buying streak has prompted speculation within the community.
Recently, Whale Alert flagged a 900 million DOGE transfer worth about $208 million into Binance. The tracking indicates that it originated from a wallet connected to the exchange, likely as an internal activity. The address involved holds 2.88 billion DOGE, one of the largest balances on the network.
Ali Martinez also reports that transactions above $1 million reached a one-month high, with activity building since early August and peaking as DOGE traded at $0.25.
Whales are back! Dogecoin $DOGE activity at a 1-month high. pic.twitter.com/C83Pv68mCt
— Ali (@ali_charts) August 14, 2025
Sentiment Building
Analyst Gordon described the current setup as “a nice bit of consolidation” before a potential breakout, adding,
“This will be one of the first coins normies FLOCK to & the pump will be MASSIVE.”
With whale accumulation rising, high-value transfers increasing, and a bullish technical pattern in play, DOGE is positioned for a potential push toward $1 if momentum holds.
Binance Free $600 (CryptoPotato Exclusive): Use this link to register a new account and receive $600 exclusive welcome offer on Binance (full details).
LIMITED OFFER for CryptoPotato readers at Bybit: Use this link to register and open a $500 FREE position on any coin!

XRP has recently entered a consolidation phase after a strong rally earlier this summer, with the price action now hovering around key resistance levels on both its USDT and BTC pairs. Yet, while momentum has slowed, the charts still indicate a generally bullish structure, with multiple key support levels remaining firmly in place.
Technical Analysis
By ShayanMarkets
The USDT Pair
On the XRP/USDT daily chart, the price is currently trading near the $3.10 mark, facing a strong resistance zone around $3.40. This follows a breakout above the $2.70 range in July, which has now flipped into a support area.
Both the 100-day and 200-day moving averages are also trending upward and recently formed a bullish crossover around $2.45, reinforcing the medium-term bullish sentiment. If the $3.40 resistance breaks, a push toward the critical $4.00 range becomes likely.
However, the RSI hovering near the neutral 50 level suggests a lack of strong momentum for now, meaning a short-term pullback into the $2.80 support zone is still possible.
This zone will be key for maintaining the bullish structure. Losing it could open the door for a deeper correction toward the 200-day moving average located around the $2.40 mark. Yet, as long as the price stays above the moving averages, the broader trend remains bullish.

The BTC Pair
Looking at the XRP/BTC chart, the pair has recently pulled back after hitting the 3,000 SAT resistance, with the price currently around 2,600 SAT.
This follows a clean breakout above the long-term descending channel and a successful retest of its upper boundary, which coincided with the 200-day moving average and the 2,400 SAT support zone. This confluence remains a key bullish technical factor, as holding above it could attract renewed buying pressure.
That said, RSI levels around 48 show that momentum has cooled after the sharp July rally, meaning XRP may continue ranging between 2,400 SAT and 3,000 SAT in the near term. A decisive close above 3,000 SAT would likely open the path to the 3,400 SAT zone, while losing 2,400 SAT could shift the bias back toward 2,000 SAT support. For now, the structure still favors the bulls as long as higher lows remain intact.

Binance Free $600 (CryptoPotato Exclusive): Use this link to register a new account and receive $600 exclusive welcome offer on Binance (full details).
LIMITED OFFER for CryptoPotato readers at Bybit: Use this link to register and open a $500 FREE position on any coin!
Disclaimer: Information found on CryptoPotato is those of writers quoted. It does not represent the opinions of CryptoPotato on whether to buy, sell, or hold any investments. You are advised to conduct your own research before making any investment decisions. Use provided information at your own risk. See Disclaimer for more information.
Cryptocurrency charts by TradingView.

 Forex3 years ago
Forex Today: the dollar is gaining strength amid gloomy sentiment at the start of the Fed’s week
- Forex3 years ago
Unbiased review of Pocket Option broker
- Forex3 years ago
Dollar to pound sterling exchange rate today: Pound plummeted to its lowest since 1985
- Forex3 years ago
How is the Australian dollar doing today?
- Cryptocurrency3 years ago
What happened in the crypto market – current events today
- World3 years ago
Why are modern video games an art form?
- Commodities3 years ago
Copper continues to fall in price on expectations of lower demand in China
- Economy3 years ago
Crude oil tankers double in price due to EU anti-Russian sanctions


