Cryptocurrency
Bitcoin (BTC) Crash Warning, Solana (SOL) Meme Coins See Downturn, Pullix (PLX) Platform Set To Launch After Raising $4 Million

Despite the excitement generated by the Bitcoin ETF approval, the aftermath has seen Bitcoin (BTC) and many altcoins nosedive. However, Solana (SOL) is defying all odds with the platform memecoins making impressive rallies despite the general crypto market’s negative trends.
Meanwhile, Pullix (PLX) has sold over 75 million tokens in the ongoing 6th stage of presale with over $4 million raised. With its hybrid model, Pullix is set to launch its platform soon which investors are eyeing at the moment.
Pullix (PLX) Has Raised Over $4 Million in Presale
With Bitcoin and Solana posting contrasting performances, Pullix presale has been a huge success with over $4 million worth of PLX tokens sold so far. Out of many exchanges, Pullix will be the first that tackles the issues of liquidity and transparency that have plagued the crypto exchanges for a long time.
With investors losing trust in exchanges as a result of unsafe investment, Pullix will step in to create a hybrid approach where liquidity and enhanced security will be the utmost objectives. With Pullix, investors hold the key to their assets with no interference whatsoever from any third party. This will pave the way for independent trading, robust security mechanisms, and regained trust among investors.
By incentivizing users to provide liquidity, Pullix will be able to offer better liquidity than many platforms, thereby attracting more admirers and driving up the demand for Pullix utility tokens. With a series of trading features such as perpetual futures, contracts for differences (CFD), lending protocol, and NFT launchpad lined up, investors will be able to make the best investment decisions that lead to profit.
The platform’s native utility token PLX, an ERC20 token, is on sale for $0.08. Holders of the PLX token will earn a percentage of the daily revenue streams on the platform. Holders may also provide liquidity to the automated market makers for a fixed passive income. Pullix also offers liquid and slippage-free trading opportunities for investors who like speedy trading adventures.
The token’s liquidity will be locked for 2 years when launched on Uniswap. The smart contract has been audited by InterFi Network, while the BlockAudit Team has verified the KYC.
Bitcoin (BTC) Price Crash Signals Warning to Investors
The price has been on the decline since the success of the spot Bitcoin ETF. It has retrogressed, slipping below $40,000 from nearly $50,000. The trading volume has also dropped in the same timeframe.
In a tweet on X, notable Bitcoin critic Peter Schiff outlined his warning that the Bitcoin SEC approval was done after the SEC chairman was left with no option. Schiff also said the SEC may later impose more rigorous regulations associated with AML policies that may undermine BTC’s use case. All these could result in the fall of Bitcoin price.
Solana’s (SOL) Memecoins Establishing Market Downturn
In what appears to have been a short-lived high, Solana’s meme coins are seeing major price retracements.
Some of the most popular meme coins on the network, such as DogWifHat (WIF) and Myro (MYRO), have seen noticeable negative momentum in the past few days.
After getting listed on exchanges, DogWifHat witnessed a rise to $0.45 and then a massive crash. Myro also increased to $0.2, signifying a 750% increase in one month. While it is early time, the present momentum exhibited by these Solana meme coins has seen investors look for more stable alternatives.
For more information regarding Pullix’s presale, see links below:
Disclaimer: The above article is sponsored content; it’s written by a third party. CryptoPotato doesn’t endorse or assume responsibility for the content, advertising, products, quality, accuracy, or other materials on this page. Nothing in it should be construed as financial advice. Readers are strongly advised to verify the information independently and carefully before engaging with any company or project mentioned and do their own research. Investing in cryptocurrencies carries a risk of capital loss, and readers are also advised to consult a professional before making any decisions that may or may not be based on the above-sponsored content.
Readers are also advised to read CryptoPotato’s full disclaimer.
Binance Free $100 (Exclusive): Use this link to register and receive $100 free and 10% off fees on Binance Futures first month (terms).


Cryptocurrency
Spot Markets Drive Bitcoin to $106K as Coinbase Sees $45M Daily Buying Pressure: Glassnode

Bitcoin’s surge to $106,000 earlier this week has been primarily driven by robust spot market demand, with Coinbase seeing net buying pressure of $45 million per day, according to Glassnode’s latest report.
The rally, which began after the king cryptocurrency dipped to just below $75,000 in early April, has been marked by strong accumulation phases, exchange-traded fund (ETF) inflows, and a cooling of sell-side pressure, pointing to sustained bullish momentum despite recent profit-taking by long-term holders.
Spot Demand Outpaces Derivatives
Unlike previous rallies fueled by leveraged speculation, this latest uptrend has been characterized by organic sport market accumulation.
According to the Glassnode report, BTC changed hands heavily in the $93,000 to $95,000 range, which is now acting as a key support level as it coincides with the cost basis of traders who entered the market within the last 155 days.
The price has respected this range amid sideways accumulation, reinforcing the “stair-stepping” structure visible on the Cost Basis Distribution heatmap.
Meanwhile, derivatives markets lagged, with perpetual futures open interest dropping 10%, from 370,000 BTC to 336,000 BTC, possibly indicating a substantial short squeeze as bears were flushed out.
However, funding rates remain neutral, reflecting a lack of excessive long-side leverage, something which Glassnode’s experts believe is a sign the rally could have more room to run.
Spot Bitcoin ETF inflows also played an important role, peaking at $389 million on April 25 before tapering to around $58 million per day. Coinbase, a preferred exchange for U.S. institutional investors, recorded consistent buying. At the same time, the sell pressure on its global counterpart, Binance, eased from $71 million per day in March to just $9 million, suggesting investors were actively buying the dip.
Long-Term Holders Cash In, But Demand Remains Strong
Despite the rally, long-term Bitcoin holders have started taking profits, as CryptoQuant analyst Avocado Onchain noted in a May 15 report.
According to them, the Binary Coin Days Destroyed (CDD) metric, which tracks dormant coins being moved, has risen to 0.6. While it shows these holders are offloading dormant BTC for profit, the metric has not reached the 0.8 zone seen during previous bull market highs.
Glassnode’s own data corroborates this trend, showing that short-term holder (STH) realized profits are spiking to nearly +3 standard deviations above the 90-day average. However, the analytics firm cautioned that profit-taking has not yet reached exhaustion levels, since in past rallies, higher deviations closer to +5 were needed to deplete demand and mark local tops.
Binance Free $600 (CryptoPotato Exclusive): Use this link to register a new account and receive $600 exclusive welcome offer on Binance (full details).
LIMITED OFFER for CryptoPotato readers at Bybit: Use this link to register and open a $500 FREE position on any coin!
Ripple has reached a decisive price range of $2.3-$2.5, with an impending breakout determining the upcoming trend. A bullish breakout will pave the way for a sustained rally toward the $3.1 range.
XRP Analysis
The Daily Chart
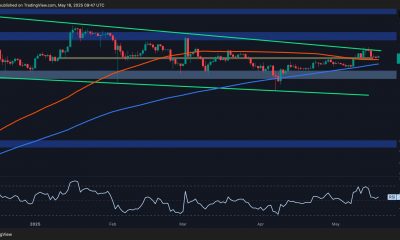
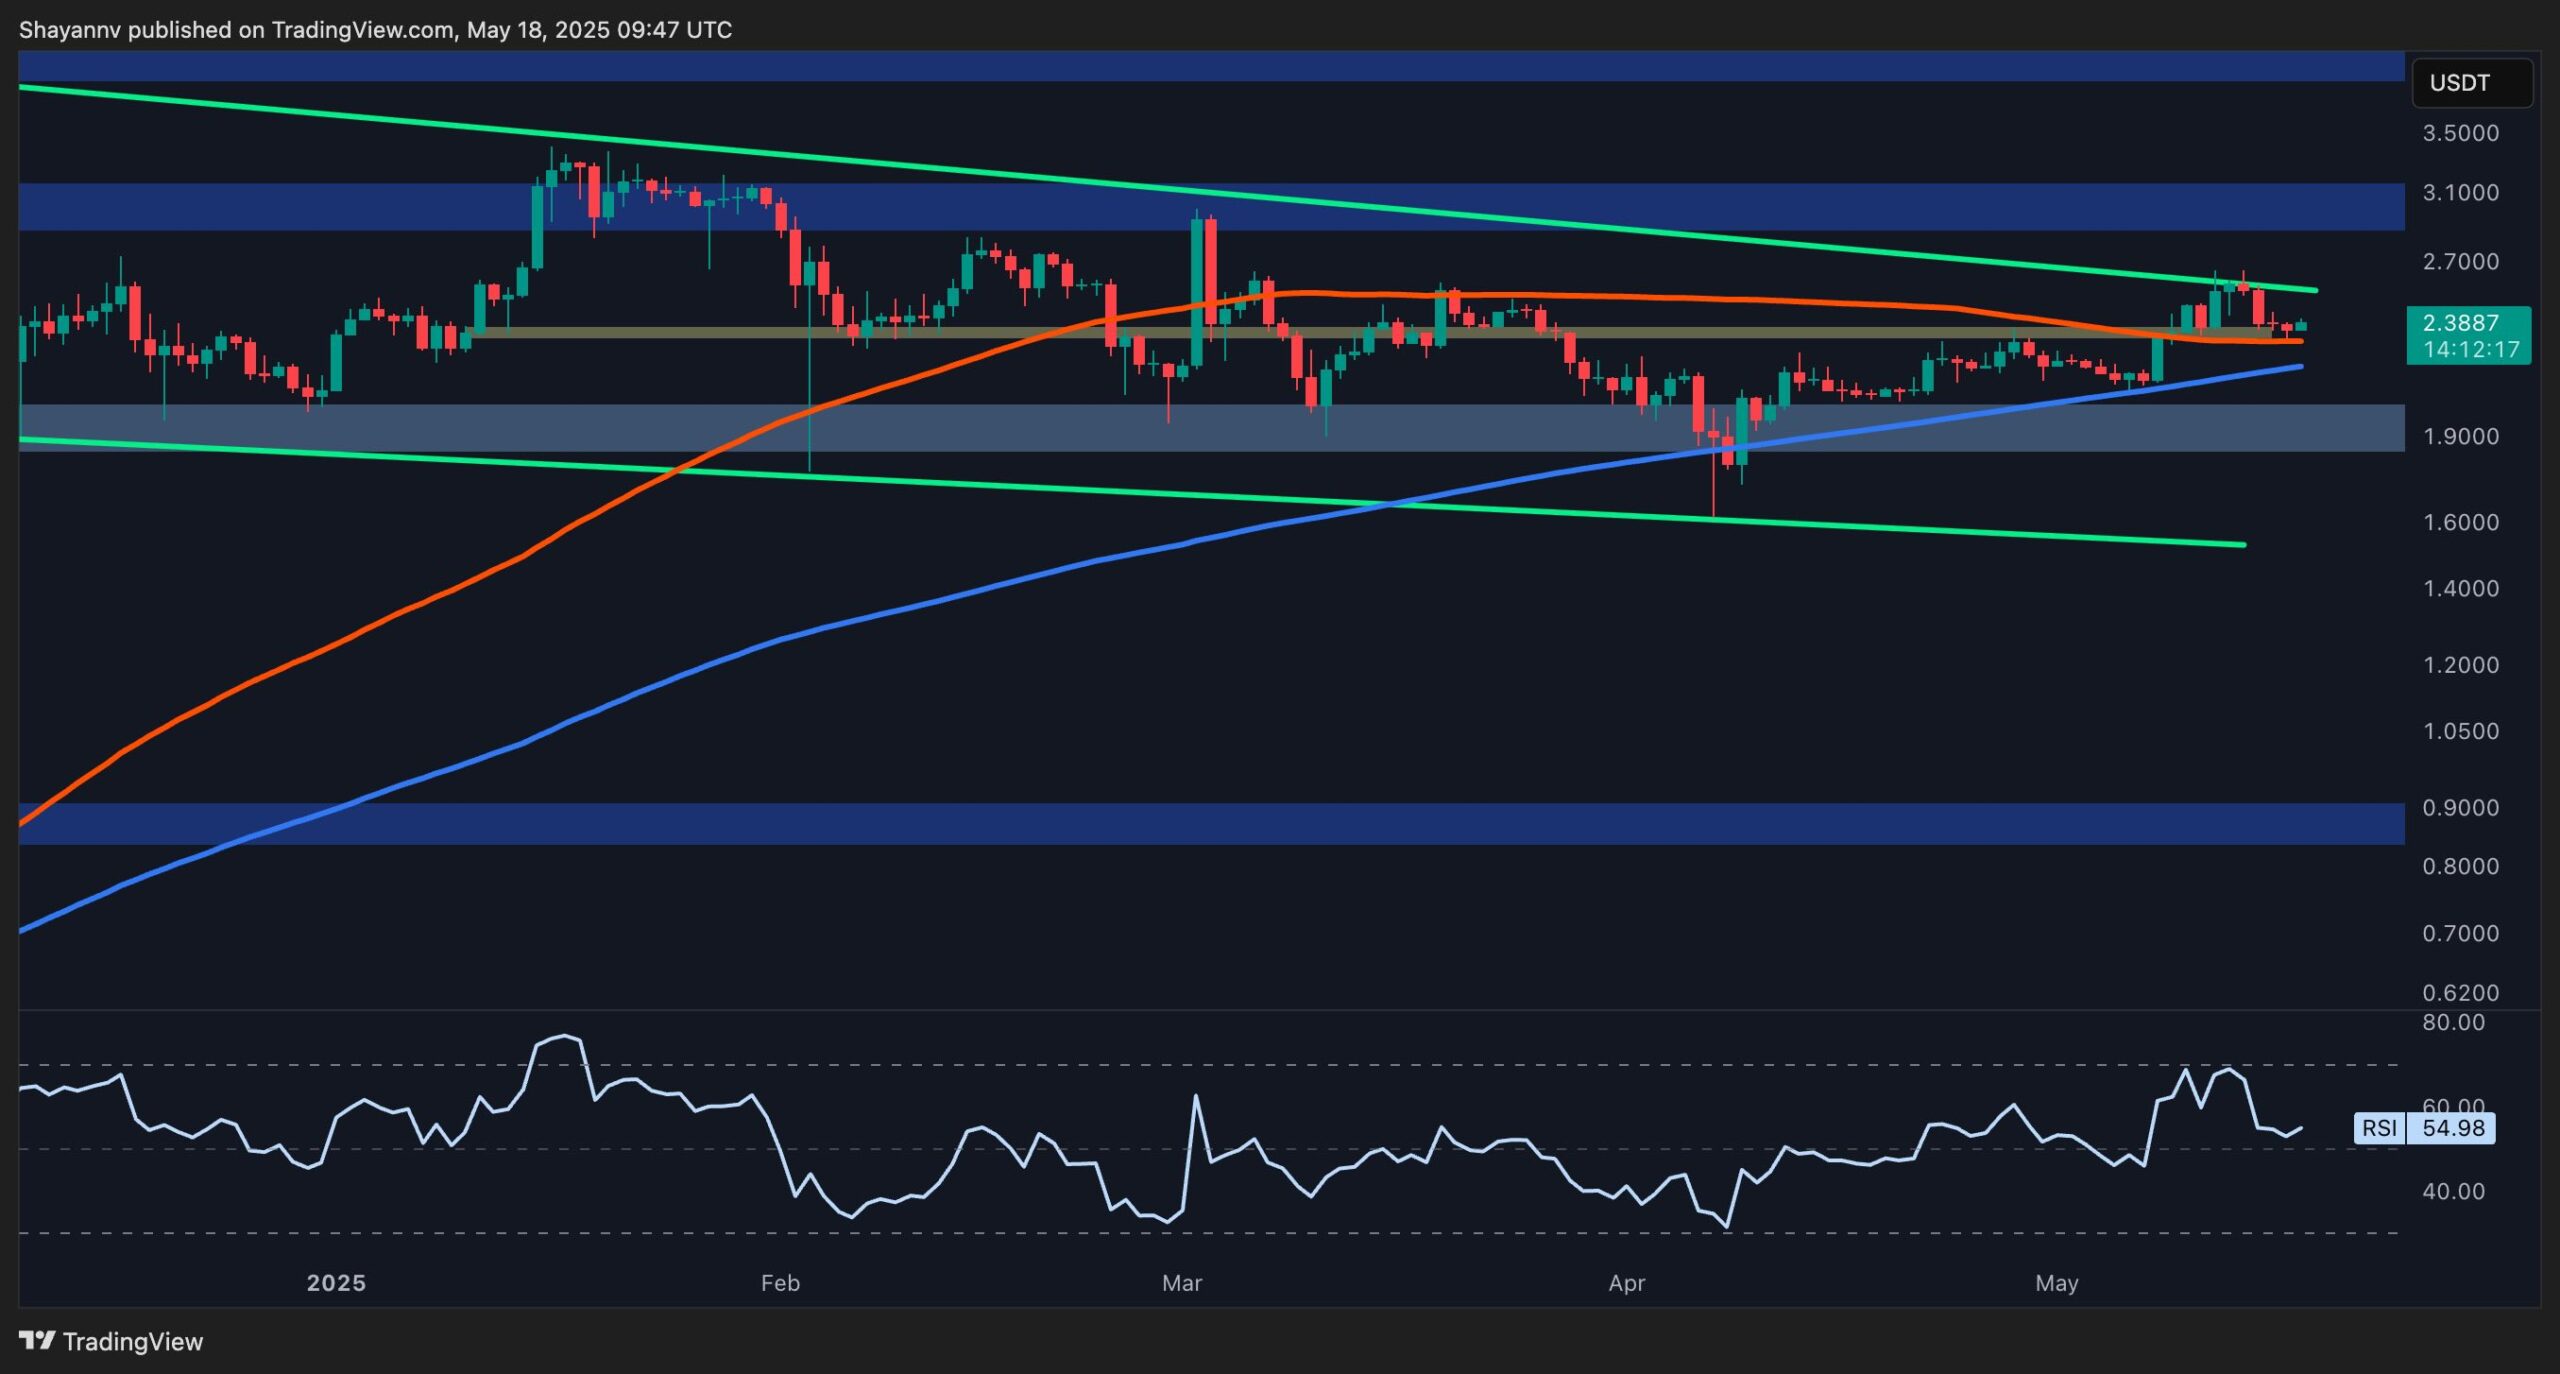
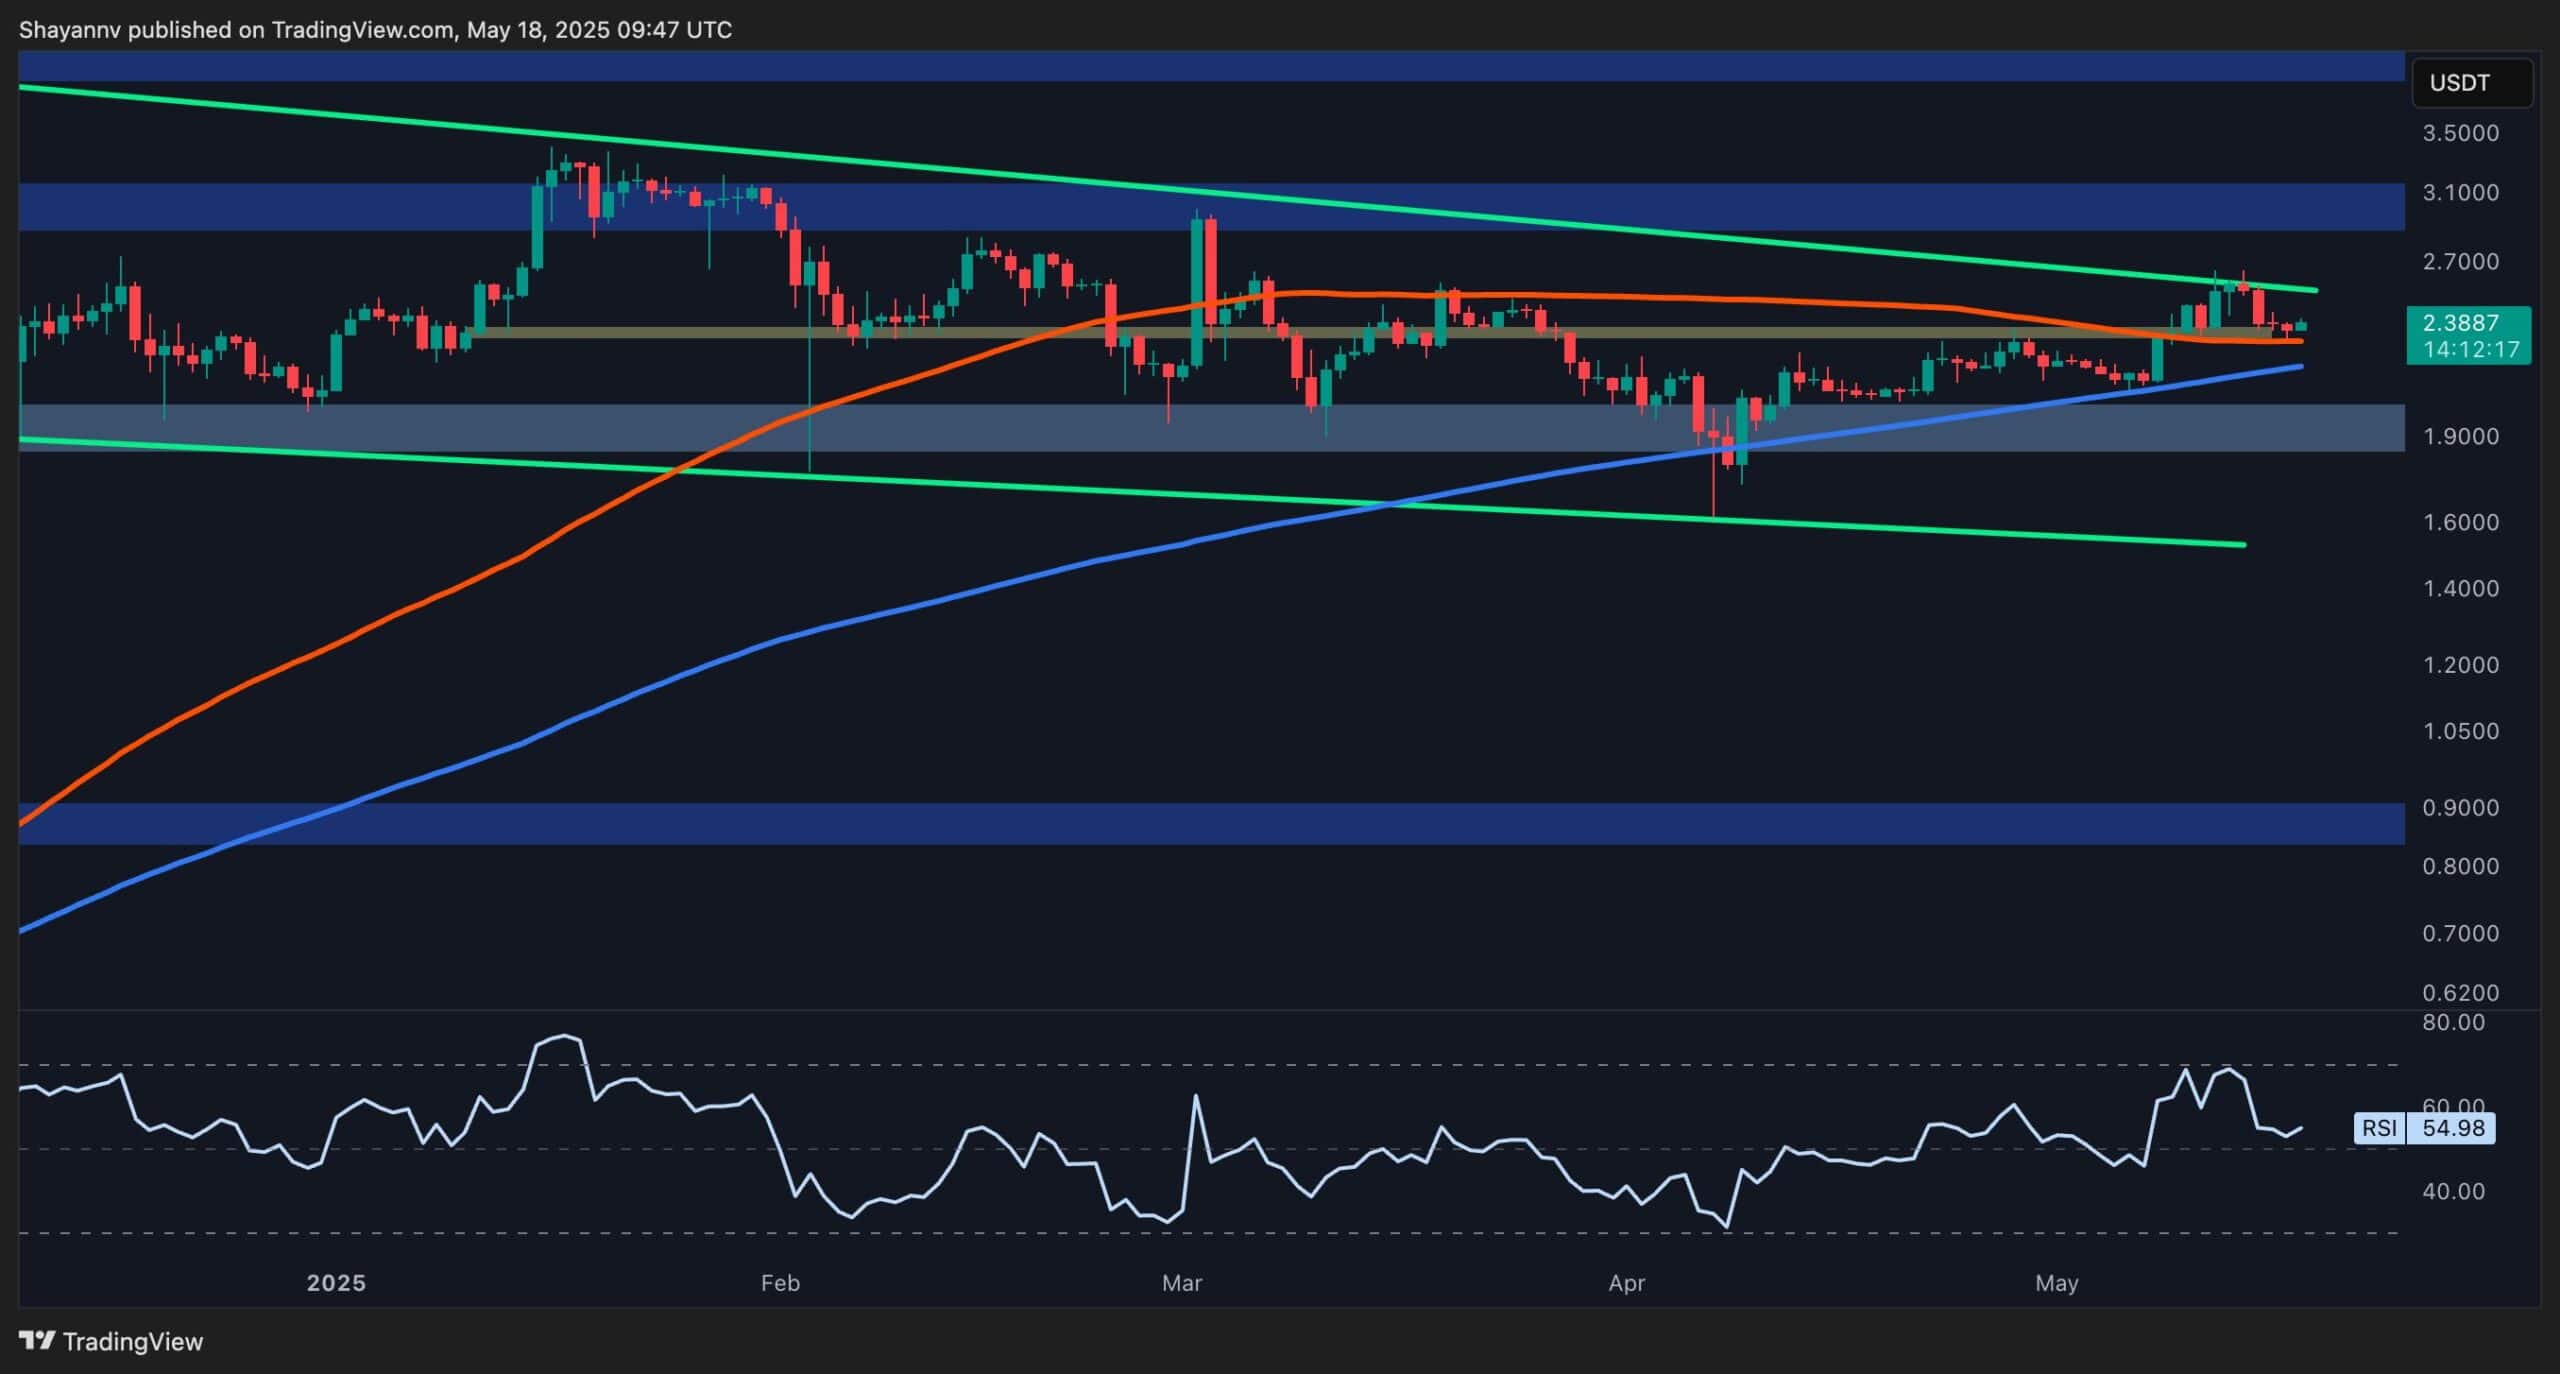
XRP’s recent bullish trend has been halted at the upper boundary of a prolonged descending wedge near the $2.7 level, triggering a bearish retracement. However, the price is now consolidating within a decisive and tight range between $2.3 and $2.5, bounded by the wedge’s apex. This zone has become a critical battleground between buyers and sellers.
The current pullback may also be interpreted as a retest of the recently broken 100 and 200-day moving averages, which could reintroduce demand into the market. A breakout from this narrow range appears imminent, and the direction of this breakout will likely determine XRP’s next major move. A bullish breakout above $2.5 would open the door for a sustained rally toward the $3.1 resistance area.
The 4-Hour Chart
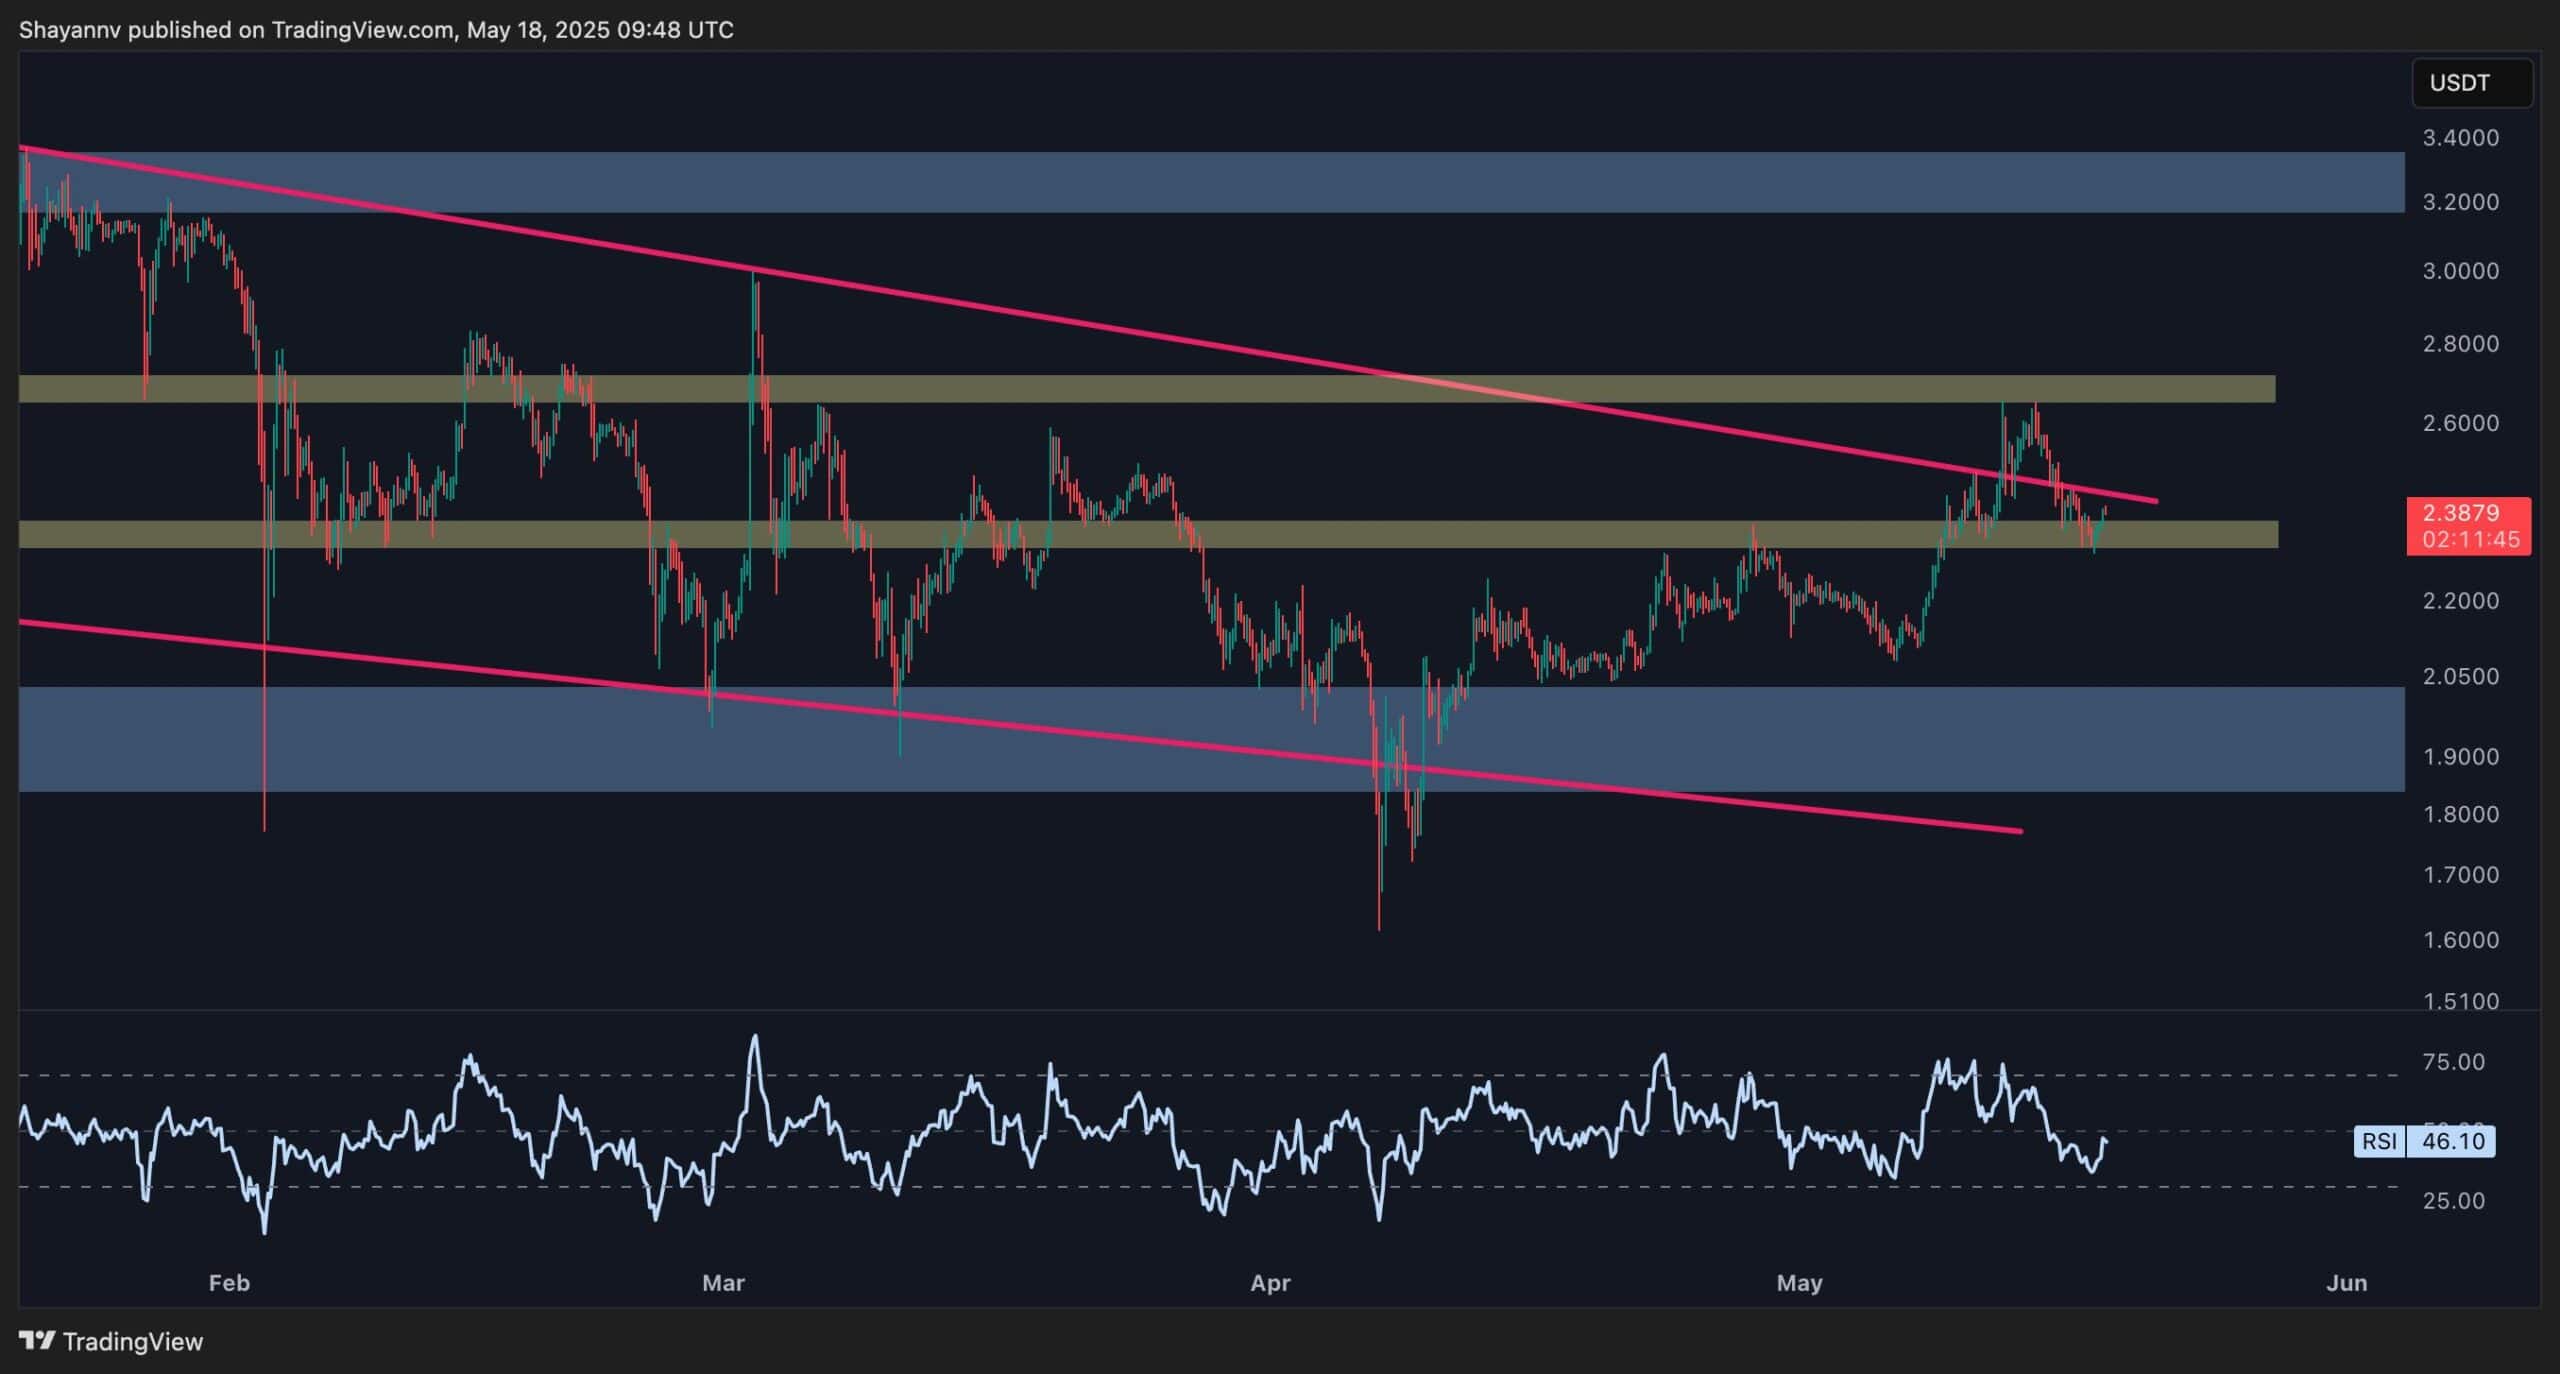
On the lower timeframe, Ripple has maintained a broader bullish structure in recent days, breaking out above the descending wedge pattern. However, the asset faced significant selling pressure around the $2.7 resistance and was swiftly rejected, falling back into the wedge formation. This movement suggests a potential bull trap and false breakout.
Currently, XRP is holding above the key support at $2.3, where buying interest could reemerge. If this level holds, a renewed bullish push toward the $2.7 zone is likely. Still, the market is awaiting a decisive breakout from the $2.3–$2.5 consolidation range.
If the breakout is bullish, the price could quickly surge toward the $3.1 resistance. Conversely, a breakdown below $2.3 might trigger a sharp decline toward the $2 support, especially if accompanied by a short-squeeze or panic selling from overleveraged long positions.
Binance Free $600 (CryptoPotato Exclusive): Use this link to register a new account and receive $600 exclusive welcome offer on Binance (full details).
LIMITED OFFER for CryptoPotato readers at Bybit: Use this link to register and open a $500 FREE position on any coin!
Disclaimer: Information found on CryptoPotato is those of writers quoted. It does not represent the opinions of CryptoPotato on whether to buy, sell, or hold any investments. You are advised to conduct your own research before making any investment decisions. Use provided information at your own risk. See Disclaimer for more information.
Cryptocurrency charts by TradingView.
Cryptocurrency
Ethereum Price Analysis: Can ETH Continue its Run as Major Resistance Levels Approach?
Ethereum has experienced a strong upward rally over the past two weeks, pushing from the $1,500s to above $2,600. However, signs of exhaustion are beginning to surface. While higher timeframes remain bullish for now, short-term caution is warranted.
Technical Analysis
By ShayanMarkets
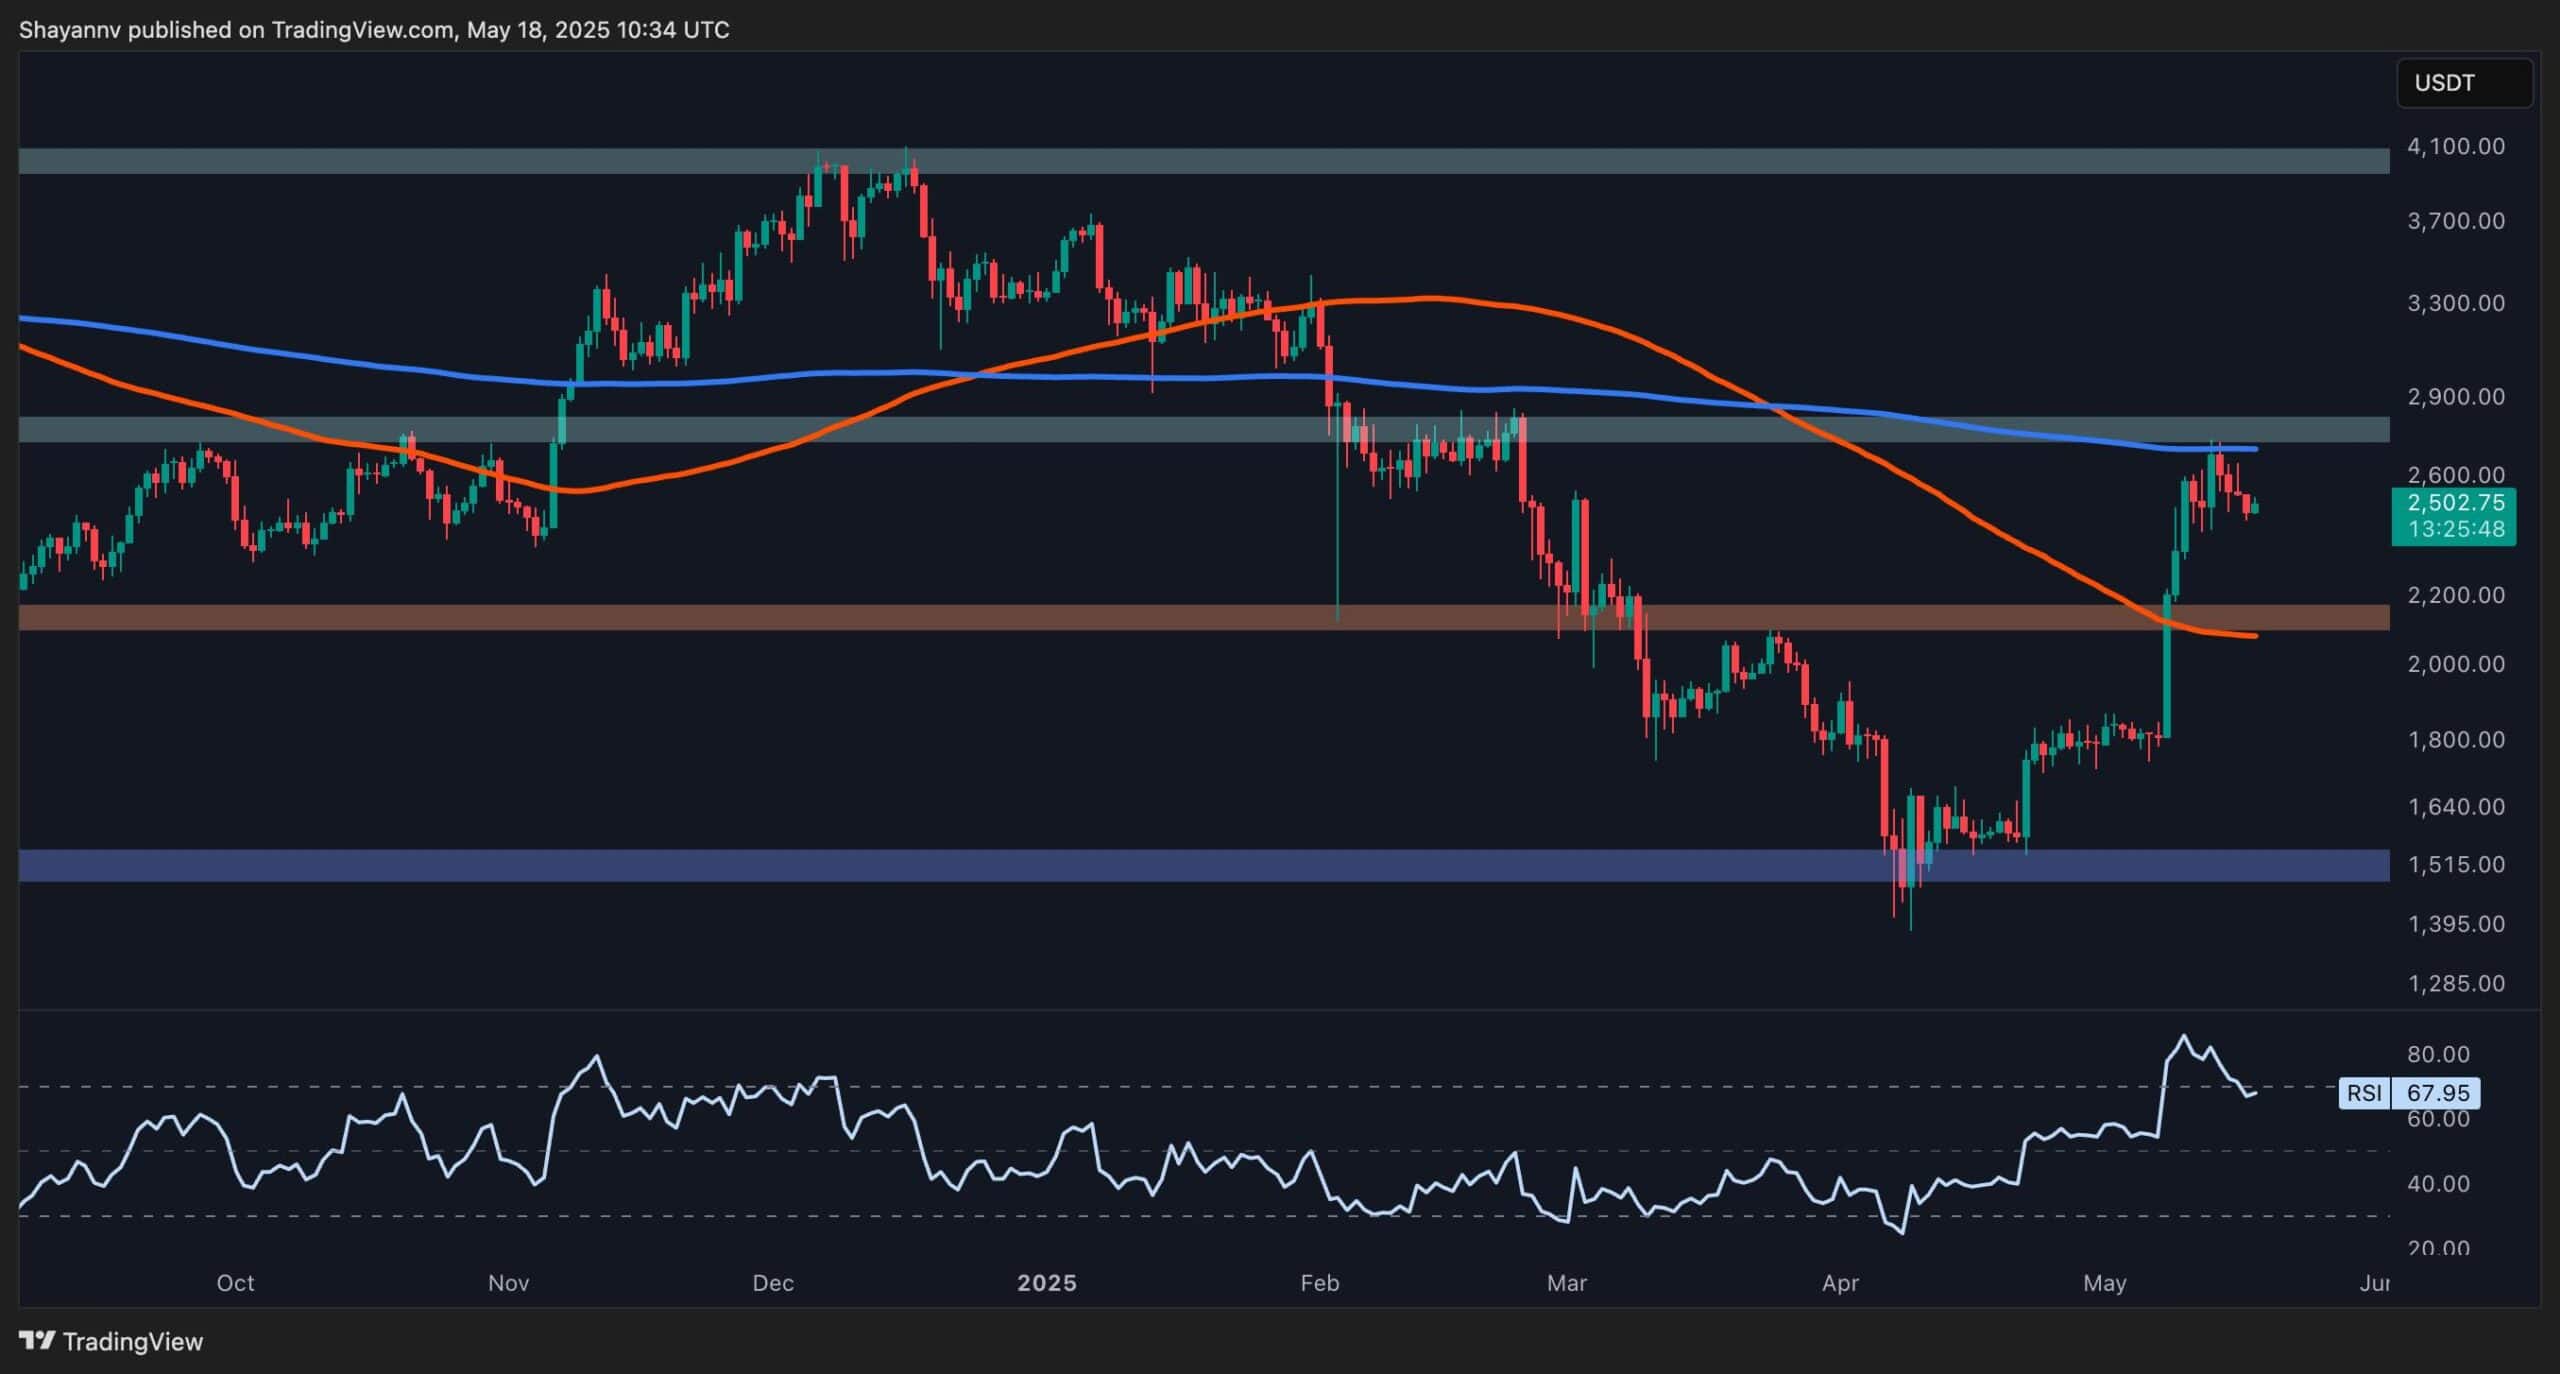
The Daily Chart
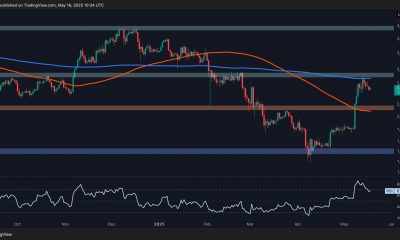
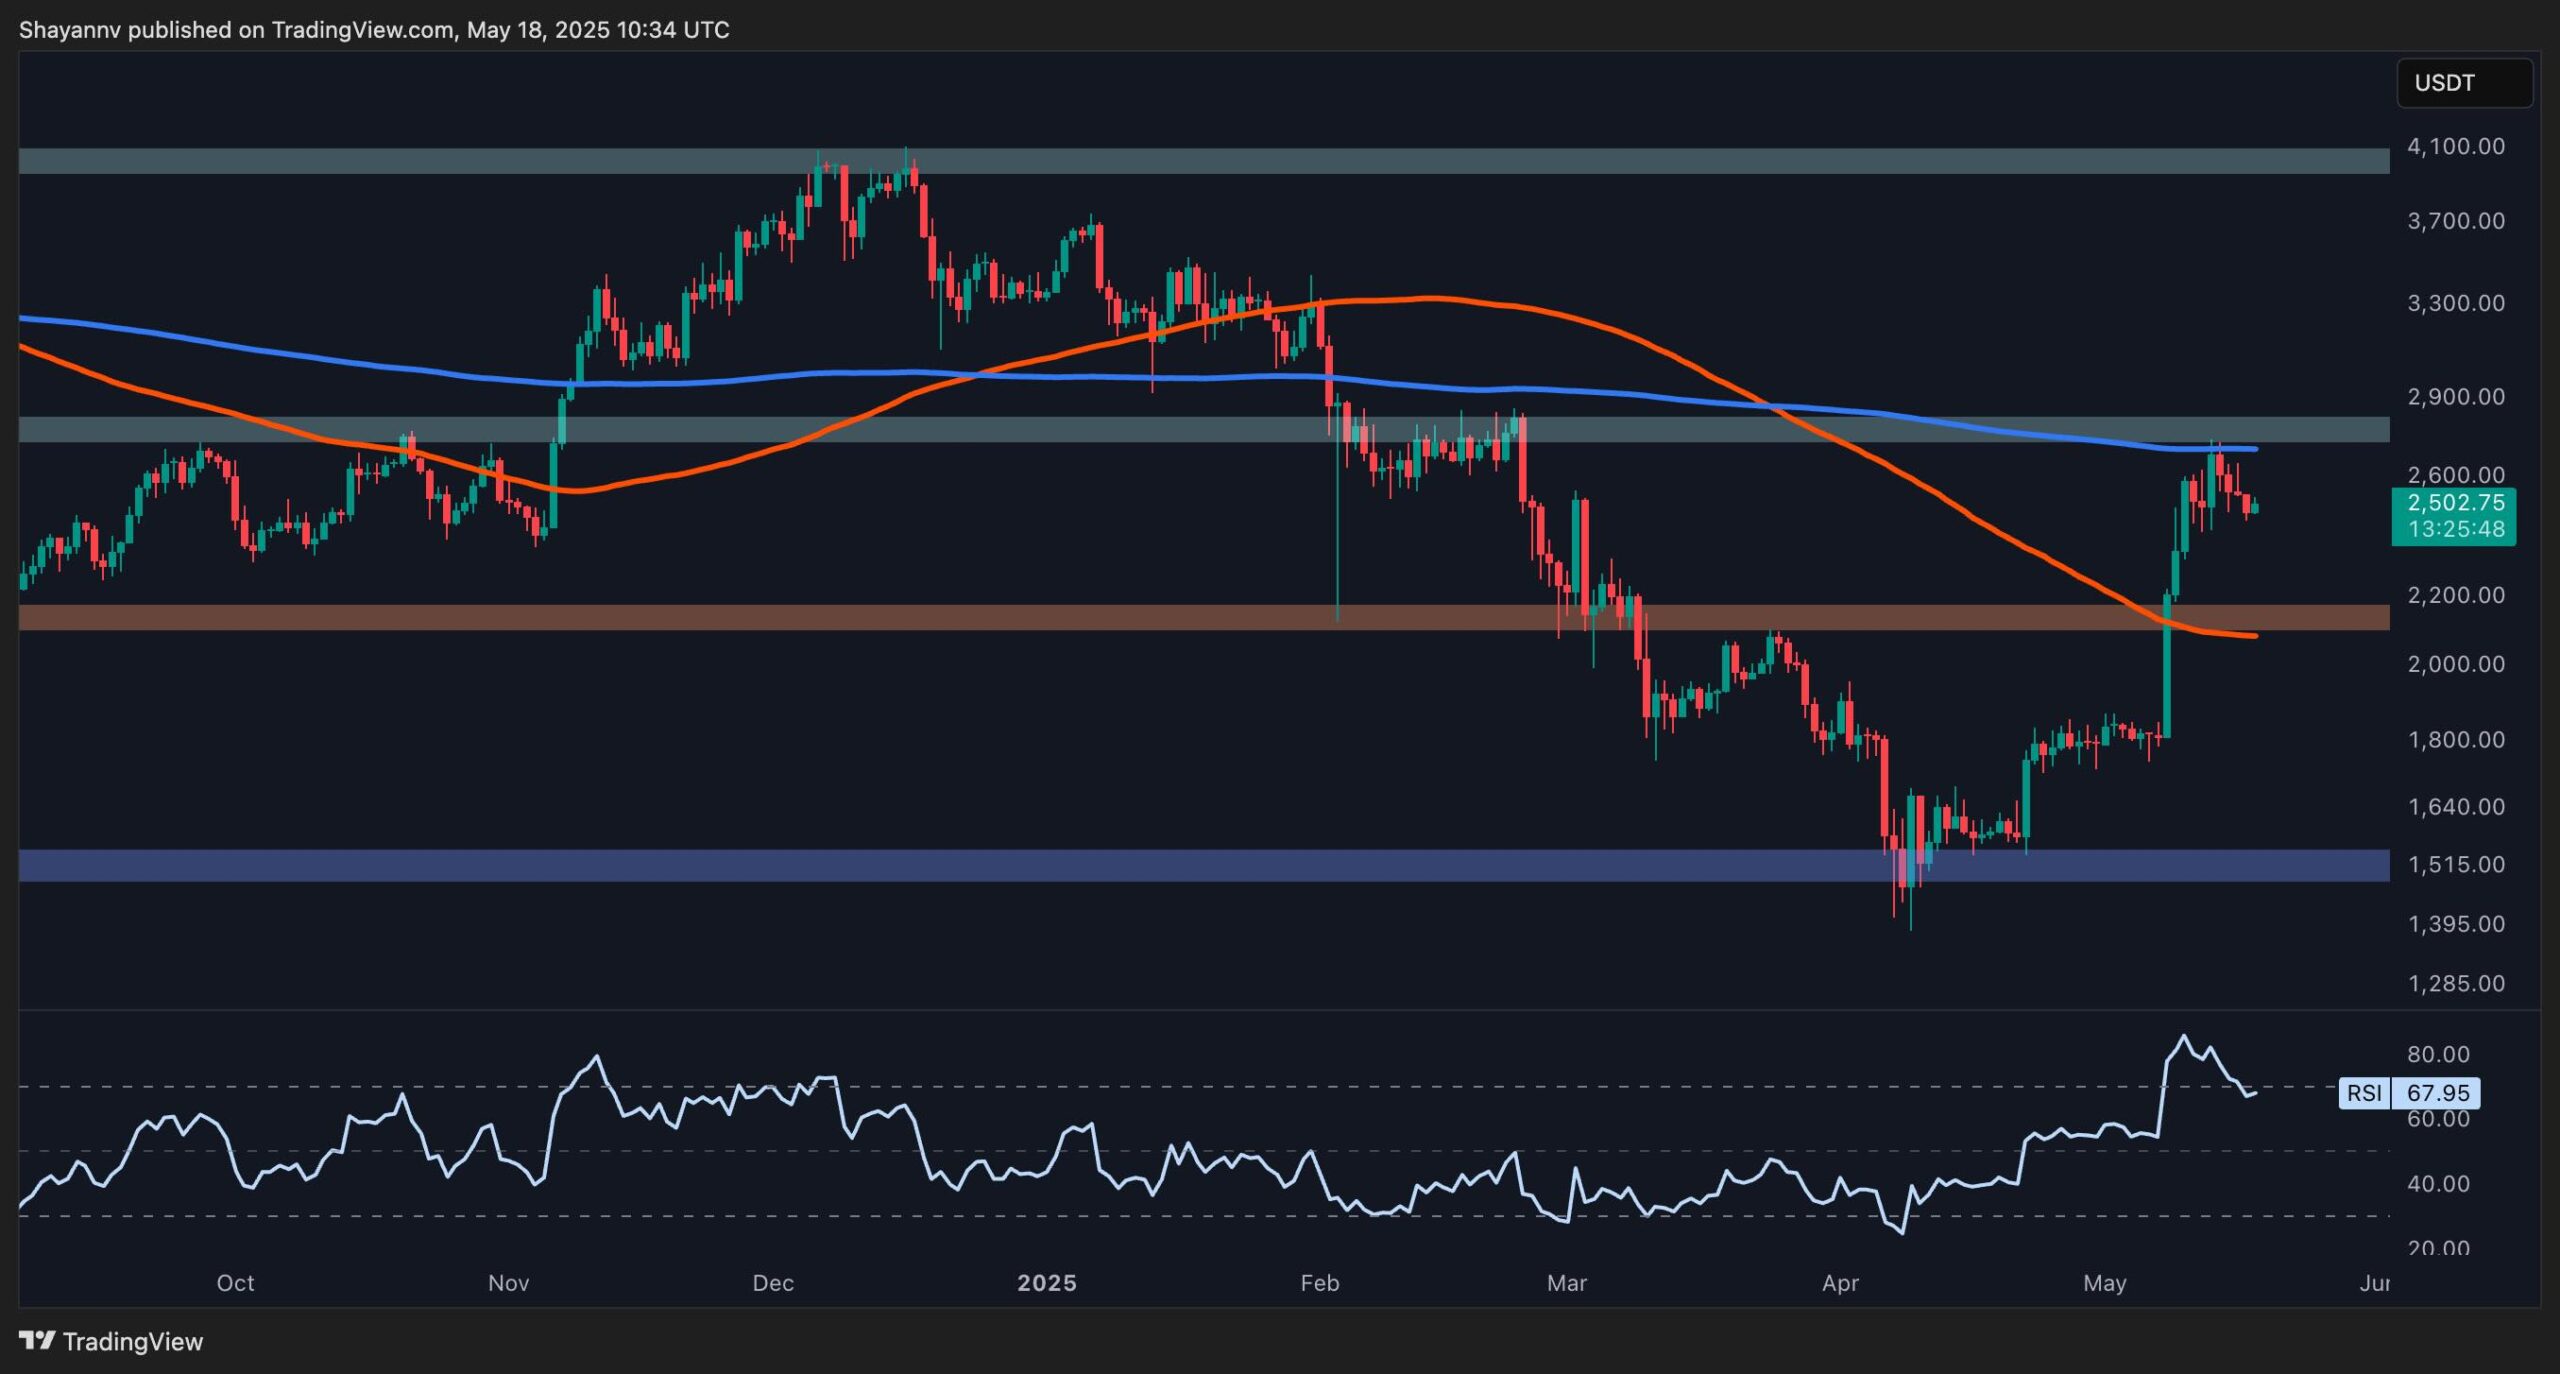
ETH has hit a technical ceiling just under the $2,900 resistance, which aligns closely with the 200-day moving average. This zone previously acted as a major breakdown point in February and is now serving as a supply area. The RSI also recently entered overbought territory, suggesting that momentum is fading as price approaches this resistance.
A rejection from here could lead to a pullback toward the $2,200 support zone and the 100-day MA located near the $2,100 mark. A confirmed breakout above $2,900 would shift the bias back to bullish, with a potential continuation toward the critical $4,000 zone.
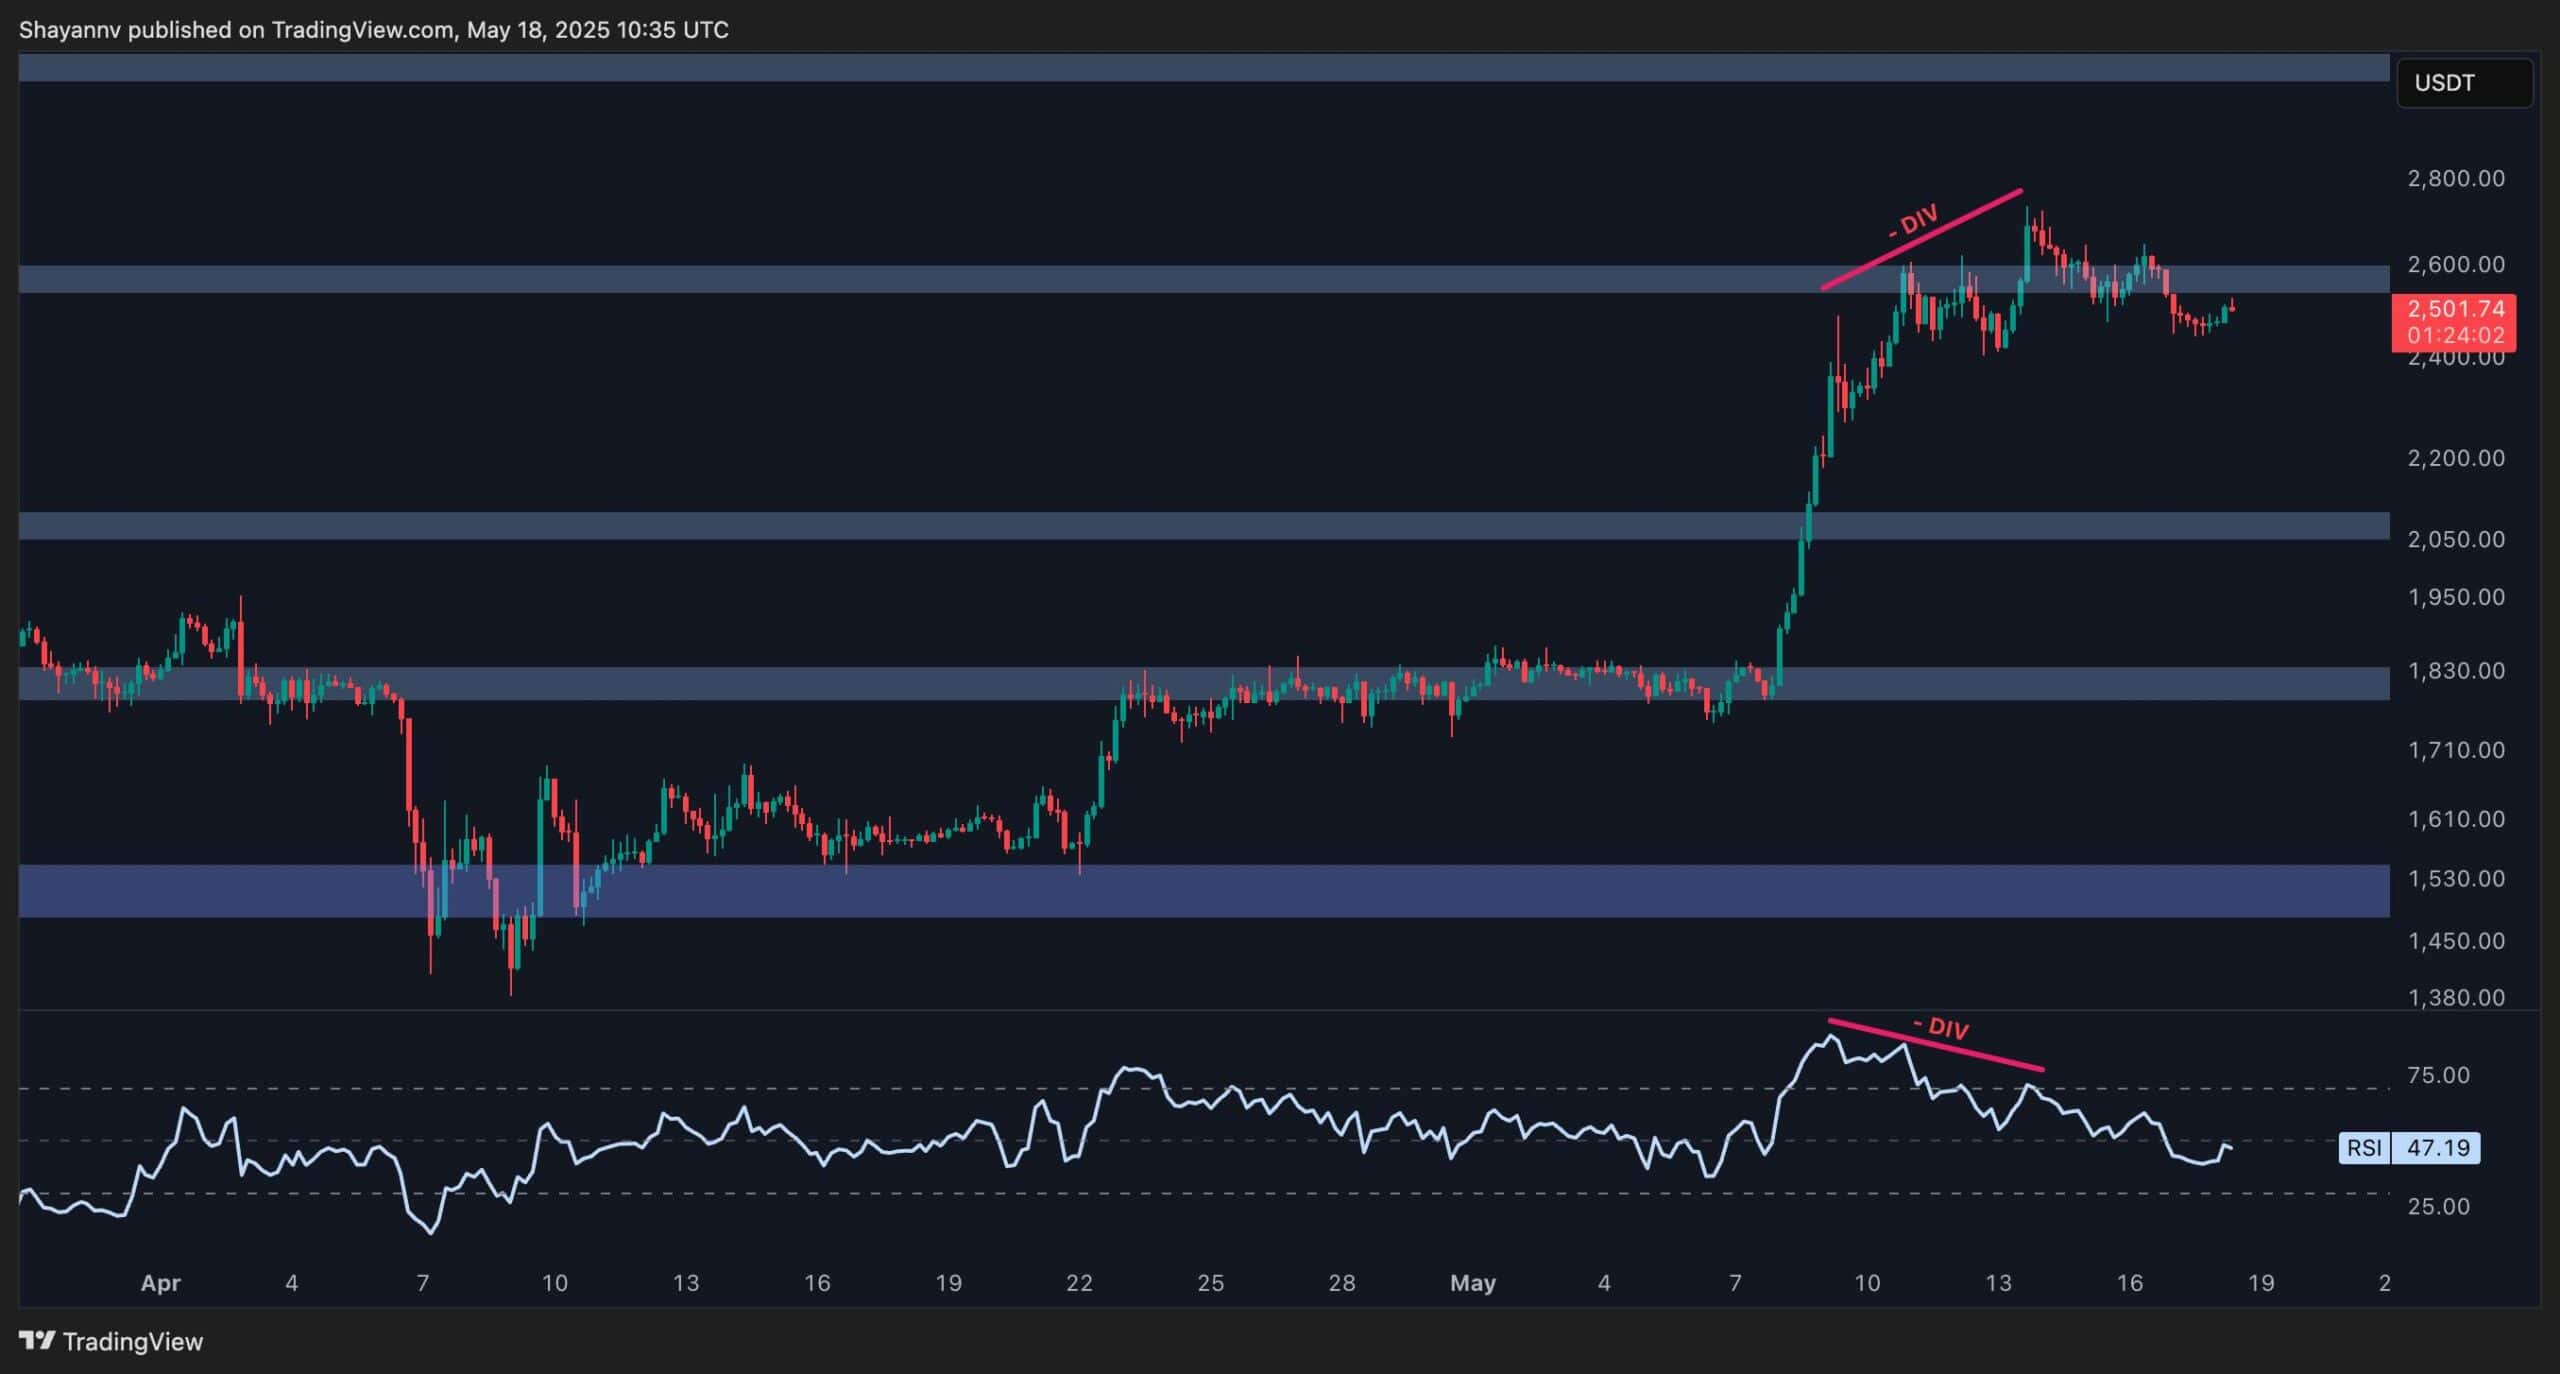
The 4-Hour Chart
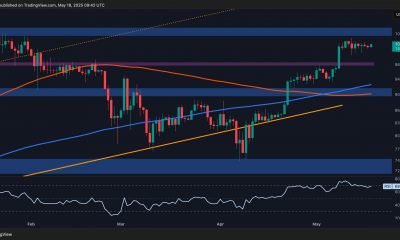
Dropping lower on the 4-hour timeframe, Ethereum is showing signs of weakening momentum. After the explosive move above $2,100, the price has been consolidating within a narrow range near the $2,500–$2,600 region.
A clear bearish divergence is now confirmed on the RSI, with price making higher highs while RSI makes lower highs. This typically indicates a potential correction ahead. If ETH loses the $2,450 support, a retracement toward $2,200 and even $2,050 becomes likely. On the flip side, reclaiming $2,600 with strong volume could invalidate the bearish signals and open the path for a run at the $3,000 area.
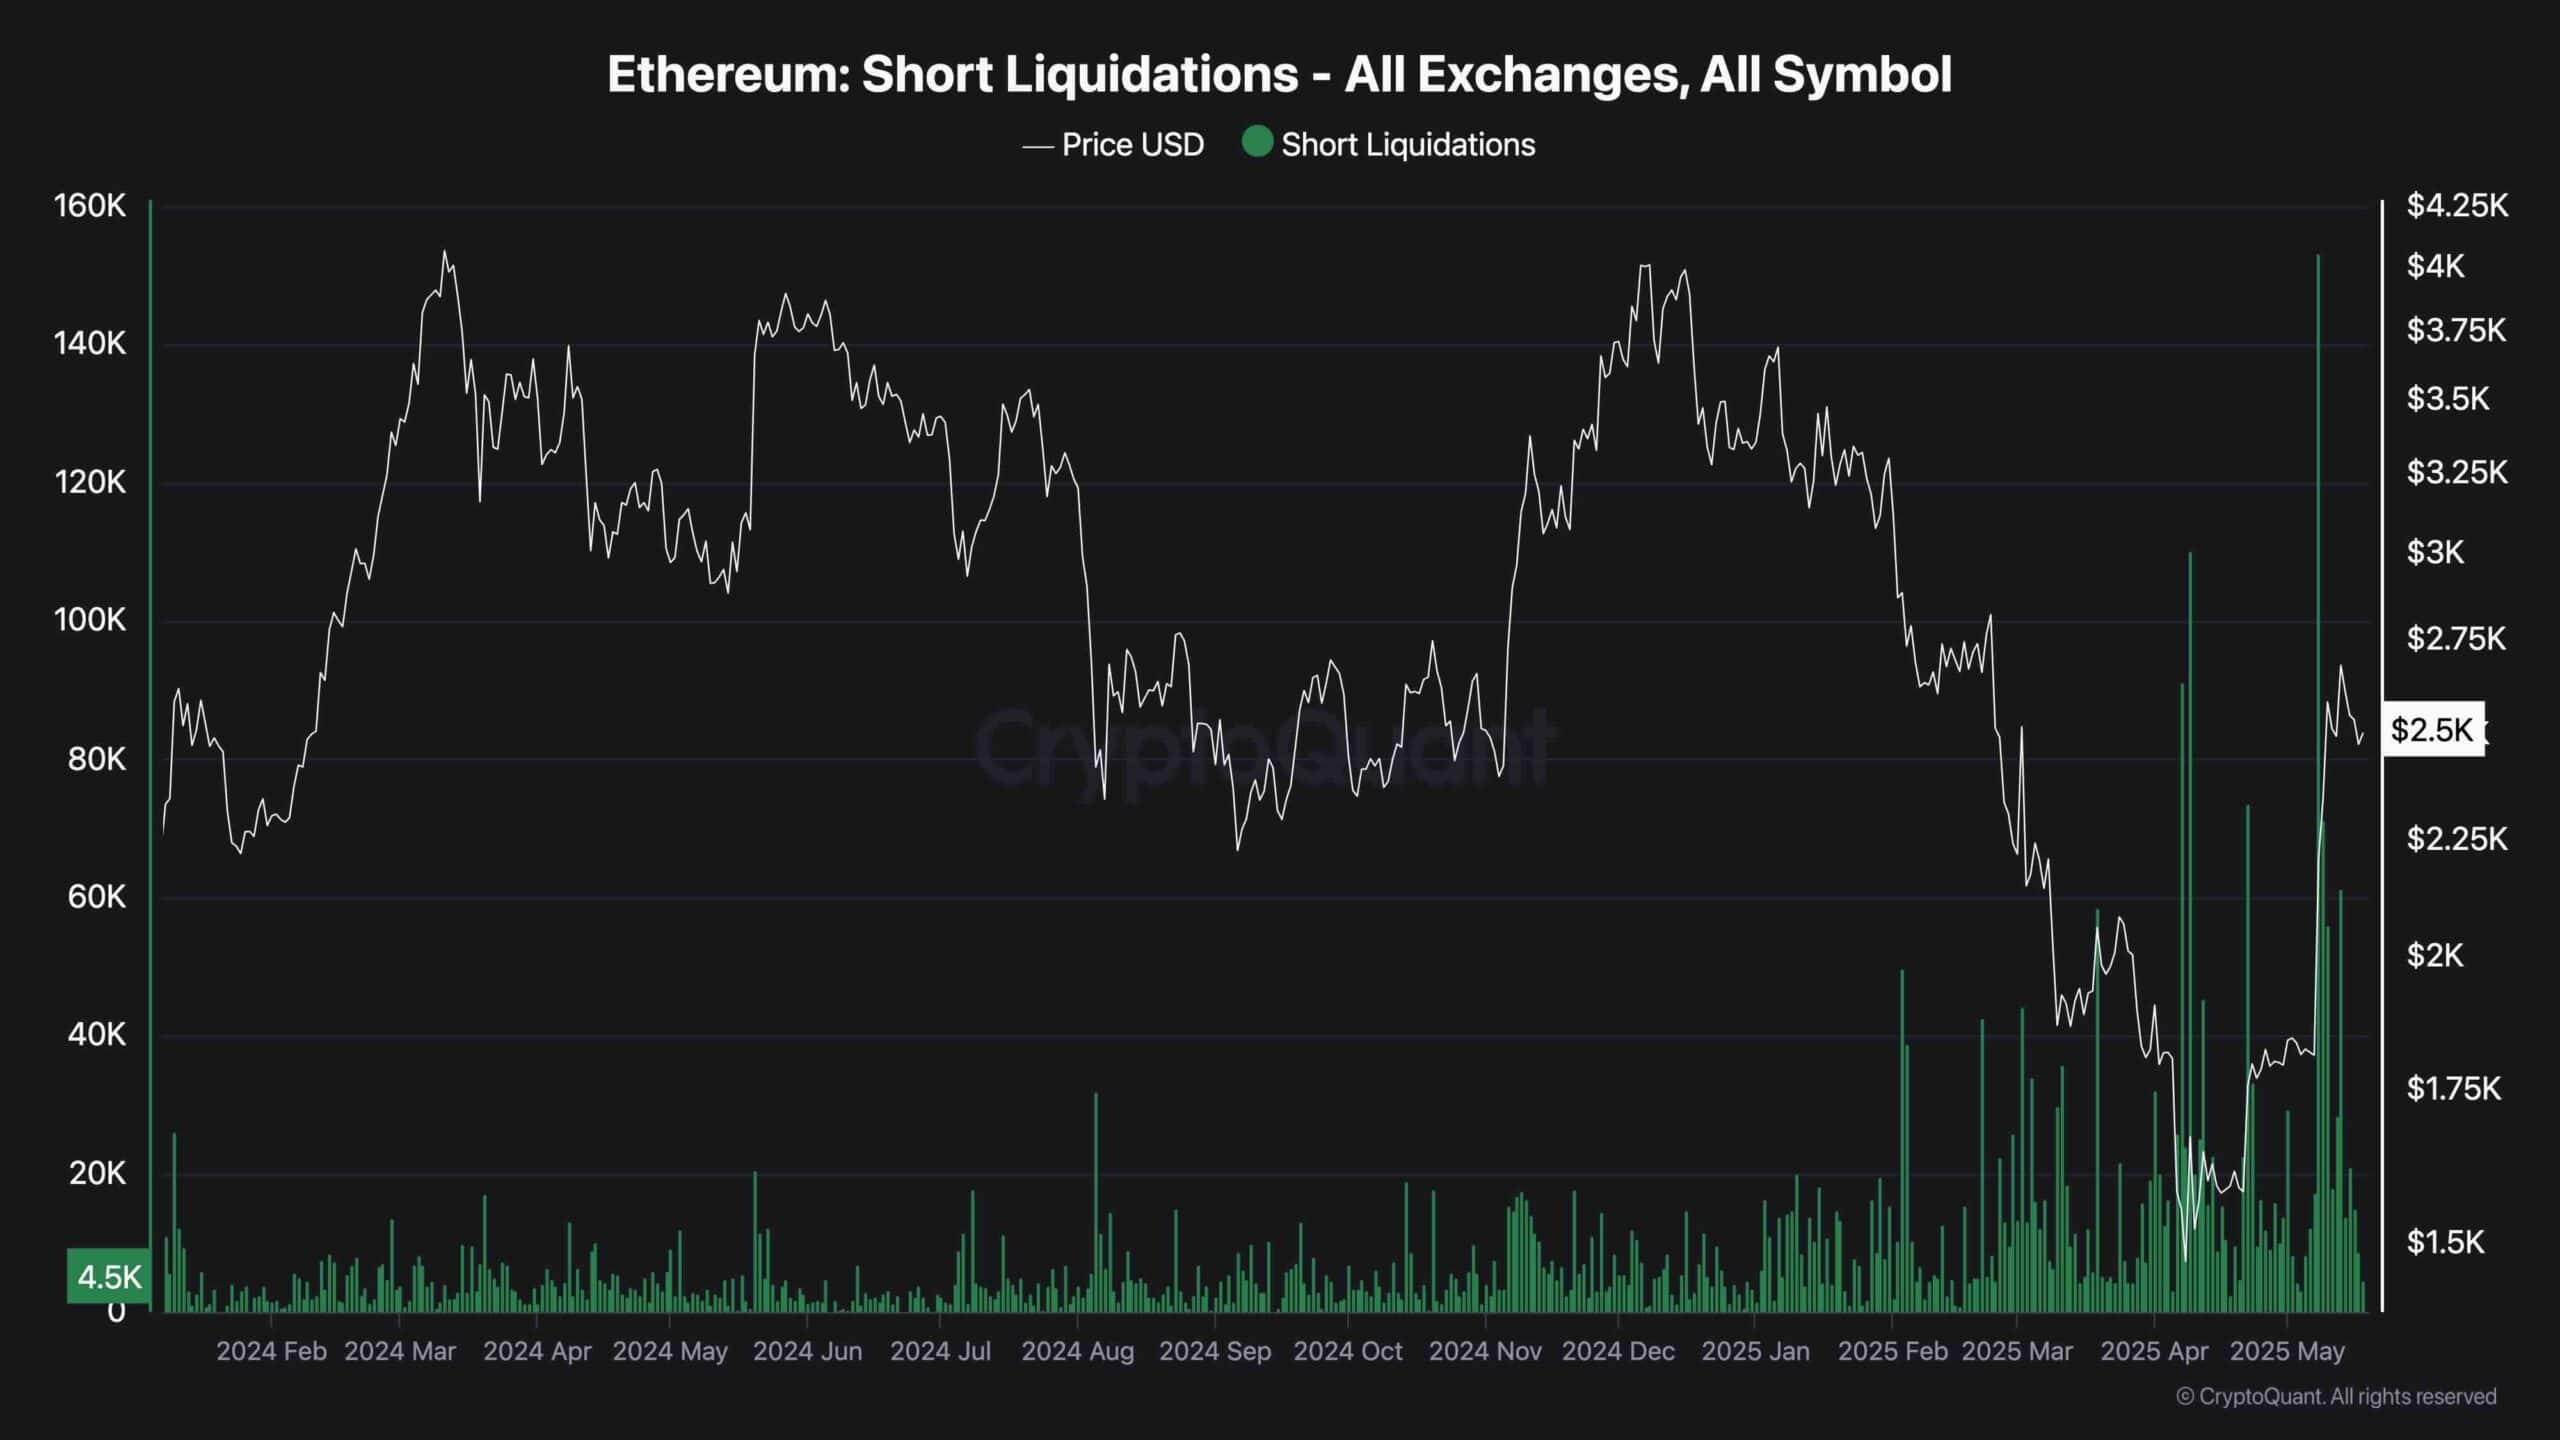
Sentiment Analysis
The recent rally triggered a sharp wave of short liquidations, which helped fuel the aggressive price surge. As seen in the short liquidation chart, the largest liquidations occurred near $2,400–$2,600, signaling a large portion of sellers were forced out of the market. This typically leads to short-term cooling, as the “fuel” for the rally gets exhausted.
The liquidation chart shows a clear uptick in forced closures over the past week, aligning with Ethereum’s breakout. These spikes often mark local tops, as the removal of excessive short exposure removes the momentum driver. With liquidations now tapering off, the price may struggle to push higher without fresh demand entering the market. This context reinforces the idea that ETH could consolidate or correct before any meaningful continuation.
Binance Free $600 (CryptoPotato Exclusive): Use this link to register a new account and receive $600 exclusive welcome offer on Binance (full details).
LIMITED OFFER for CryptoPotato readers at Bybit: Use this link to register and open a $500 FREE position on any coin!
Disclaimer: Information found on CryptoPotato is those of writers quoted. It does not represent the opinions of CryptoPotato on whether to buy, sell, or hold any investments. You are advised to conduct your own research before making any investment decisions. Use provided information at your own risk. See Disclaimer for more information.
Cryptocurrency charts by TradingView.

 Forex3 years ago
Forex Today: the dollar is gaining strength amid gloomy sentiment at the start of the Fed’s week
- Forex2 years ago
Unbiased review of Pocket Option broker
- Forex3 years ago
How is the Australian dollar doing today?
- Forex3 years ago
Dollar to pound sterling exchange rate today: Pound plummeted to its lowest since 1985
- Cryptocurrency3 years ago
What happened in the crypto market – current events today
- World3 years ago
Why are modern video games an art form?
- Commodities3 years ago
Copper continues to fall in price on expectations of lower demand in China
- Economy3 years ago
Crude oil tankers double in price due to EU anti-Russian sanctions


