Commodities
Acetic Acid Market size to grow by 5,379.71 thousand tons at a CAGR of 5.39% by 2027; the growing paint and coatings industry to boost market growth – Technavio
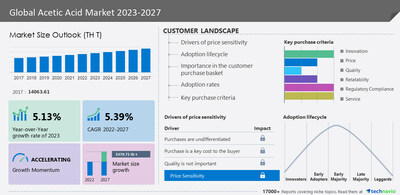
NEW YORK, June 25, 2023 /PRNewswire/ — The acetic acid market size is estimated to grow at a CAGR of 5.39% between 2022 and 2027. The market size is forecast to increase by 5,379.71 thousand tons, according to a recent market study by Technavio. This report also offers a 5-year historical (2017-2021) data projection of market size, segmentation, and region. Discover some insights on market size before buying the full report -Request a sample report
What’s New? -Special coverage on the Russia-Ukraine war; global inflation; recovery analysis from COVID-19; supply chain disruptions, global trade tensions; and risk of recessionGlobal competitiveness and key competitor positionsMarket presence across multiple geographical footprints – Strong/Active/Niche/Trivial – Buy the report!Acetic Acid Market 2023-2027: Vendor Analysis and ScopeThe acetic acid market report also offers information on the criticality of inputs, R&D, CAPEX, technology, and products of 15 vendors listed Below -Airedale Chemical Co. Ltd., Ashok Alco Chem Ltd., BP Plc, Celanese Corp., Daicel Corp., DubiChem Marine International, Eastman Chemical Co., GNFC Ltd., HELM AG, Indian Oil Corp. Ltd., INEOS Group Holdings SA, Jiangsu Sopo Corp. Ltd., Kingboard Holdings Ltd., Lonza Group Ltd., LyondellBasell Industries NV, Pentokey Organy (India) Ltd., Saudi Basic Industries Corp., Shandong Hualu Hengsheng Chemical Co. Ltd., Shanghai Huayi Fine Chemical Co. Ltd., and Dow Inc.Chart & Data Table on 5-Year Historic (2017-2021) Market Size, Comparative Analysis of Segments, and Y-O-Y Growth of Acetic acid market – Download Free SampleAcetic Acid Market – Market SegmentationThe market is segmented by application (VAM, PTA, acetic anhydride, and others), end-user (plastics and polymers, food and beverages, ink paints and coatings, chemicals, and others)The market share growth in the VAM segment will be significant during the forecast period. VAM can dissolve most organic solvents, including chlorinated solvents. This versatile substance finds application in a wide range of industries. It is utilized in the production of polymers that are essential components in various products such as printing inks, water-based paints, ceramic coatings, lacquers, packaging and construction adhesives, paper treatments, and protective coatings for different materials. Moreover, VAM plays an important role as a fundamental chemical building block in the manufacturing of both commercial and consumer goods.Geographical OverviewThe market is segmented by geography (APAC, North America, Europe, South America, and Middle East and Africa)APAC is estimated to contribute 30% to the growth of the market during the forecast period. The increasing need for acetic acid in various sectors is responsible for driving its growing demand. Industries such as pharmaceuticals, polymers, food packaging, plastics, and apparel depend on acetic acid and its derivatives, particularly cellulose acetate. The demand for acetic acid in the region is due to its use in applications involving PTA (purified terephthalic acid) and acetic anhydride. China and India are the primary consumers of acetic anhydride in the region. Hence, the above-mentioned factors will drive the demand for acetic acid in the region during the forecast period.For Insights on the market dynamics & segmentations VIEW PDF SAMPLE!Acetic Acid Market – Market DynamicsKey DriverThe growing paint and coatings industry is notably driving market growth. The increase in demand for paints and coatings in China, India, Malaysia, Thailand, and Vietnam can be due to the rising building and construction sector, which has experienced significant growth. This rapid industrialization, along with a growing construction sector and residential home sales, has resulted in increased use of paints and coatings in a variety of applications, including adhesives, paper coatings, textile treatments, and others. Hence, the use of polyvinyl acetate, derived from acetic acid, is expected to drive market growth during the forecast period.Major TrendsThe increasing demand for methanol is an emerging trend in market growth. The growth of the market for acetic acid will be fueled by the increasing demand for methanol. Researchers are currently exploring the conversion of methanol into acetic acid through the hydrocarboxylation process using carbon dioxide and hydrogen. Notably, companies like Eastman Chemical and Celanese are experiencing a rise in methanol production. These firms have built plants that can produce 500,000 metric tons of methanol per year. As a result, rising methanol production will increase demand for acetic acid, contributing to the market’s expansion.Significant ChallengesThe decreasing demand for conventional cigarettes that use acetic acid as a raw material may restrict market growth. The market is experiencing an impact on its growth due to the increasing popularity of electronic cigarettes as alternatives to traditional cigarettes. Electronic cigarettes have gained popularity as they are considered relatively less expensive and harmful compared to conventional tobacco products. This has led to numerous governments and regulatory bodies legalizing electronic cigarettes in both domestic and international markets. Furthermore, the growing acceptance and use of electronic cigarettes has resulted in a decrease in the usage of conventional cigarettes. Hence, the market is expected to be influenced by this shift in consumer preferences during the forecast period.For Insights on the market dynamics & segmentations VIEW PDF SAMPLE!What are the key data covered in this Acetic Acid Market report?CAGR of the market during the forecast periodDetailed information on factors that will drive the growth of the acetic acid market between 2023 and 2027Precise estimation of the size of the acetic acid market and its contribution to the market with a focus on the parent marketAccurate predictions about upcoming trends and changes in consumer behaviorGrowth of the acetic acid market across APAC, North America, Europe, South America, and the Middle East and AfricaA thorough analysis of the market’s competitive landscape and detailed information about vendorsComprehensive analysis of factors that will challenge the growth of acetic acid market vendorsGain instant access to 17,000+ market research reports. Technavio’s SUBSCRIPTION platformRelated ReportsThe purified terephthalic acid (PTA) market is estimated to grow at a CAGR of 8.46% between 2022 and 2027. The size of the market is forecast to increase by USD 45.16 billion. Furthermore, this report extensively covers market segmentation by application (polyester fiber, pet resins, films, and others) and geography (APAC, North America, Europe, South America, and the Middle East and Africa). The increase in the consumption of packaging material is a key factor driving the market growth during the forecast period.The hyaluronic acid market size is estimated to grow at a CAGR of 7.3% between 2022 and 2027. The hyaluronic acid market size is forecast to increase by USD 3,719.76 million. Furthermore, this hyaluronic acid market report extensively covers market segmentation by application (dermal fillers, osteoarthritis, ophthalmic, and vesicoureteral reflux), end-user (pharmaceutical industry and cosmetic industry), and geography (North America, APAC, Europe, Middle East and Africa, and South America). This growing investment in expanding production facilities is a key factor driving the market growth during the forecast period.Acetic Acid Market Scope
Report Coverage
Details
Base year
2022
Historic period
2017-2021
Forecast period
2023-2027
Growth momentum & CAGR
Accelerate at a CAGR of 5.39%
Market growth 2023-2027
5,379.71 thousand tons
Market structure
Fragmented
YoY growth 2022-2023 (%)
5.13
Regional analysis
APAC, North America, Europe, South America, and Middle East and Africa
Performing market contribution
APAC at 30%
Key countries
US, China, Japan, India, and Germany
Competitive landscape
Leading Vendors, Market Positioning of Vendors, Competitive Strategies, and Industry Risks
Key companies profiled
Airedale Chemical Co. Ltd., Ashok Alco Chem Ltd., BP Plc, Celanese Corp., Daicel Corp., DubiChem Marine International, Eastman Chemical Co., GNFC Ltd., HELM AG, Indian Oil Corp. Ltd., INEOS Group Holdings SA, Jiangsu Sopo Corp. Ltd., Kingboard Holdings Ltd., Lonza Group Ltd., LyondellBasell Industries NV, Pentokey Organy (India) Ltd., Saudi Basic Industries Corp., Shandong Hualu Hengsheng Chemical Co. Ltd., Shanghai Huayi Fine Chemical Co. Ltd., and Dow Inc.
Market dynamics
Parent market analysis, Market growth inducers and obstacles, Fast-growing and slow-growing segment analysis, COVID-19 impact and recovery analysis and future consumer dynamics, Market condition analysis for forecast period.
Customization purview
If our report has not included the data that you are looking for, you can reach out to our analysts and get segments customized.
Table of Contents1 Executive Summary1.1 Market overviewExhibit 01: Executive Summary – Chart on Market OverviewExhibit 02: Executive Summary – Data Table on Market OverviewExhibit 03: Executive Summary – Chart on Global Market CharacteristicsExhibit 04: Executive Summary – Chart on Market by GeographyExhibit 05: Executive Summary – Chart on Market Segmentation by ApplicationExhibit 06: Executive Summary – Chart on Market Segmentation by End-userExhibit 07: Executive Summary – Chart on Incremental GrowthExhibit 08: Executive Summary – Data Table on Incremental GrowthExhibit 09: Executive Summary – Chart on Vendor Market Positioning2 Market Landscape2.1 Market ecosystemExhibit 10: Parent marketExhibit 11: Market Characteristics3 Market Sizing3.1 Market definitionExhibit 12: Offerings of vendors included in the market definition3.2 Market segment analysis Exhibit 13: Market segments3.4 Market outlook: Forecast for 2022-2027 Exhibit 14: Chart on Global – Market size and forecast 2022-2027 (thousand t)Exhibit 15: Data Table on Global – Market size and forecast 2022-2027 (thousand t)Exhibit 16: Chart on Global Market- Year-over-year growth 2022-2027 (%)Exhibit 17: Data Table on Global Market- Year-over-year growth 2022-2027 (%)4 Historic Market Size4.1 Global Acetic Acid Market 2017 – 2021 Exhibit 18: Historic Market Size – Data Table on global acetic acid Market 2017 – 2021 (thousand t)4.2 Application Segment Analysis 2017 – 2021 Exhibit 19: Historic Market Size – Application Segment 2017 – 2021 (thousand t)4.3 End-user Segment Analysis 2017 – 2021 Exhibit 20: Historic Market Size – End-user Segment 2017 – 2021 (thousand t)4.4 Geography Segment Analysis 2017 – 2021 Exhibit 21: Historic Market Size – Geography Segment 2017 – 2021 (thousand t)4.5 Country Segment Analysis 2017 – 2021 Exhibit 22: Historic Market Size – Country Segment 2017 – 2021 (thousand t)5 Five Forces Analysis5.1 Five forces summaryExhibit 23: Five forces analysis – Comparison between 2022 and 20275.2 Bargaining power of buyers Exhibit 24: Chart on Bargaining power of buyers – Impact of key factors 2022 and 20275.3 Bargaining power of suppliers Exhibit 25: Bargaining power of suppliers – Impact of key factors in 2022 and 20275.4 Threat of new entrants Exhibit 26: Threat of new entrants – Impact of key factors in 2022 and 20275.5 Threat of substitutes Exhibit 27: Threat of substitutes – Impact of key factors in 2022 and 20275.6 Threat of rivalryExhibit 28: Threat of rivalry – Impact of key factors in 2022 and 20275.7 Market conditionExhibit 29: Chart on Market condition – Five forces 2022 and 20276 Market Segmentation by Application6.1 Market segmentsExhibit 30: Chart on Application – Market share 2022-2027 (%)Exhibit 31: Data Table on Application – Market share 2022-2027 (%)6.2 Comparison by Application Exhibit 32: Chart on Comparison by ApplicationExhibit 33: Data Table on Comparison by Application6.3 VAM – Market size and forecast 2022-2027 Exhibit 34: Chart on VAM – Market size and forecast 2022-2027 (thousand t)Exhibit 35: Data Table on VAM – Market size and forecast 2022-2027 (thousand t)Exhibit 36: Chart on VAM – Year-over-year growth 2022-2027 (%)Exhibit 37: Data Table on VAM – Year-over-year growth 2022-2027 (%)6.4 PTA – Market size and forecast 2022-2027 Exhibit 38: Chart on PTA – Market size and forecast 2022-2027 (thousand t)Exhibit 39: Data Table on PTA – Market size and forecast 2022-2027 (thousand t)Exhibit 40: Chart on PTA – Year-over-year growth 2022-2027 (%)Exhibit 41: Data Table on PTA – Year-over-year growth 2022-2027 (%)6.5 Acetic anhydride – Market size and forecast 2022-2027 Exhibit 42: Chart on Acetic anhydride – Market size and forecast 2022-2027 (thousand t)Exhibit 43: Data Table on Acetic anhydride – Market size and forecast 2022-2027 (thousand t)Exhibit 44: Chart on Acetic anhydride – Year-over-year growth 2022-2027 (%)Exhibit 45: Data Table on Acetic anhydride – Year-over-year growth 2022-2027 (%)6.6 Others – Market size and forecast 2022-2027 Exhibit 46: Chart on Others – Market size and forecast 2022-2027 (thousand t)Exhibit 47: Data Table on Others – Market size and forecast 2022-2027 (thousand t)Exhibit 48: Chart on Others – Year-over-year growth 2022-2027 (%)Exhibit 49: Data Table on Others – Year-over-year growth 2022-2027 (%)6.7 Market opportunity by Application Exhibit 50: Market opportunity by Application (thousand t)Exhibit 51: Data Table on Market opportunity by Application (thousand t)7 Market Segmentation by End-user7.1 Market segmentsExhibit 52: Chart on End-user – Market share 2022-2027 (%)Exhibit 53: Data Table on End-user – Market share 2022-2027 (%)7.2 Comparison by End-user Exhibit 54: Chart on Comparison by End-userExhibit 55: Data Table on Comparison by End-user7.3 Plastics and polymers – Market size and forecast 2022-2027 Exhibit 56: Chart on Plastics and polymers – Market size and forecast 2022-2027 (thousand t)Exhibit 57: Data Table on Plastics and polymers – Market size and forecast 2022-2027 (thousand t)Exhibit 58: Chart on Plastics and polymers – Year-over-year growth 2022-2027 (%)Exhibit 59: Data Table on Plastics and polymers – Year-over-year growth 2022-2027 (%)7.4 Food and beverages – Market size and forecast 2022-2027 Exhibit 60: Chart on Food and beverages – Market size and forecast 2022-2027 (thousand t)Exhibit 61: Data Table on Food and beverages – Market size and forecast 2022-2027 (thousand t)Exhibit 62: Chart on Food and beverages – Year-over-year growth 2022-2027 (%)Exhibit 63: Data Table on Food and beverages – Year-over-year growth 2022-2027 (%)7.5 Ink paints and coatings – Market size and forecast 2022-2027 Exhibit 64: Chart on Ink paints and coatings – Market size and forecast 2022-2027 (thousand t)Exhibit 65: Data Table on Ink paints and coatings – Market size and forecast 2022-2027 (thousand t)Exhibit 66: Chart on Ink paints and coatings – Year-over-year growth 2022-2027 (%)Exhibit 67: Data Table on Ink paints and coatings – Year-over-year growth 2022-2027 (%)7.6 Chemicals – Market size and forecast 2022-2027 Exhibit 68: Chart on Chemicals – Market size and forecast 2022-2027 (thousand t)Exhibit 69: Data Table on Chemicals – Market size and forecast 2022-2027 (thousand t)Exhibit 70: Chart on Chemicals – Year-over-year growth 2022-2027 (%)Exhibit 71: Data Table on Chemicals – Year-over-year growth 2022-2027 (%)7.7 Others – Market size and forecast 2022-2027 Exhibit 72: Chart on Others – Market size and forecast 2022-2027 (thousand t)Exhibit 73: Data Table on Others – Market size and forecast 2022-2027 (thousand t)Exhibit 74: Chart on Others – Year-over-year growth 2022-2027 (%)Exhibit 75: Data Table on Others – Year-over-year growth 2022-2027 (%)7.8 Market opportunity by End-user Exhibit 76: Market opportunity by End-user (thousand t)Exhibit 77: Data Table on Market opportunity by End-user (thousand t)8 Customer Landscape8.1 Customer landscape overview Exhibit 78: Analysis of price sensitivity, lifecycle, customer purchase basket, adoption rates, and purchase criteria9 Geographic Landscape9.1 Geographic segmentation Exhibit 79: Chart on Market share by geography 2022-2027 (%)Exhibit 80: Data Table on Market share by geography 2022-2027 (%)9.2 Geographic comparison Exhibit 81: Chart on Geographic comparisonExhibit 82: Data Table on Geographic comparison9.3 APAC – Market size and forecast 2022-2027 Exhibit 83: Chart on APAC – Market size and forecast 2022-2027 (thousand t)Exhibit 84: Data Table on APAC – Market size and forecast 2022-2027 (thousand t)Exhibit 85: Chart on APAC – Year-over-year growth 2022-2027 (%)Exhibit 86: Data Table on APAC – Year-over-year growth 2022-2027 (%)9.4 North America – Market size and forecast 2022-2027 Exhibit 87: Chart on North America – Market size and forecast 2022-2027 (thousand t)Exhibit 88: Data Table on North America – Market size and forecast 2022-2027 (thousand t)Exhibit 89: Chart on North America – Year-over-year growth 2022-2027 (%)Exhibit 90: Data Table on North America – Year-over-year growth 2022-2027 (%)9.5 Europe – Market size and forecast 2022-2027 Exhibit 91: Chart on Europe – Market size and forecast 2022-2027 (thousand t)Exhibit 92: Data Table on Europe – Market size and forecast 2022-2027 (thousand t)Exhibit 93: Chart on Europe – Year-over-year growth 2022-2027 (%)Exhibit 94: Data Table on Europe – Year-over-year growth 2022-2027 (%)9.6 South America – Market size and forecast 2022-2027 Exhibit 95: Chart on South America – Market size and forecast 2022-2027 (thousand t)Exhibit 96: Data Table on South America – Market size and forecast 2022-2027 (thousand t)Exhibit 97: Chart on South America – Year-over-year growth 2022-2027 (%)Exhibit 98: Data Table on South America – Year-over-year growth 2022-2027 (%)9.7 Middle East and Africa – Market size and forecast 2022-2027 Exhibit 99: Chart on Middle East and Africa – Market size and forecast 2022-2027 (thousand t)Exhibit 100: Data Table on Middle East and Africa – Market size and forecast 2022-2027 (thousand t)Exhibit 101: Chart on Middle East and Africa – Year-over-year growth 2022-2027 (%)Exhibit 102: Data Table on Middle East and Africa – Year-over-year growth 2022-2027 (%)9.8 China – Market size and forecast 2022-2027 Exhibit 103: Chart on China – Market size and forecast 2022-2027 (thousand t)Exhibit 104: Data Table on China – Market size and forecast 2022-2027 (thousand t)Exhibit 105: Chart on China – Year-over-year growth 2022-2027 (%)Exhibit 106: Data Table on China – Year-over-year growth 2022-2027 (%)9.9 Japan – Market size and forecast 2022-2027 Exhibit 107: Chart on Japan – Market size and forecast 2022-2027 (thousand t)Exhibit 108: Data Table on Japan – Market size and forecast 2022-2027 (thousand t)Exhibit 109: Chart on Japan – Year-over-year growth 2022-2027 (%)Exhibit 110: Data Table on Japan – Year-over-year growth 2022-2027 (%)9.10 India – Market size and forecast 2022-2027 Exhibit 111: Chart on India – Market size and forecast 2022-2027 (thousand t)Exhibit 112: Data Table on India – Market size and forecast 2022-2027 (thousand t)Exhibit 113: Chart on India – Year-over-year growth 2022-2027 (%)Exhibit 114: Data Table on India – Year-over-year growth 2022-2027 (%)9.11 US – Market size and forecast 2022-2027 Exhibit 115: Chart on US – Market size and forecast 2022-2027 (thousand t)Exhibit 116: Data Table on US – Market size and forecast 2022-2027 (thousand t)Exhibit 117: Chart on US – Year-over-year growth 2022-2027 (%)Exhibit 118: Data Table on US – Year-over-year growth 2022-2027 (%)9.12 Germany – Market size and forecast 2022-2027 Exhibit 119: Chart on Germany – Market size and forecast 2022-2027 (thousand t)Exhibit 120: Data Table on Germany – Market size and forecast 2022-2027 (thousand t)Exhibit 121: Chart on Germany – Year-over-year growth 2022-2027 (%)Exhibit 122: Data Table on Germany – Year-over-year growth 2022-2027 (%)9.13 Market opportunity by geography Exhibit 123: Market opportunity by geography (thousand t)Exhibit 124: Market opportunity by geography (thousand t) – Volume10 Drivers, Challenges, and Trends10.3 Impact of drivers and challenges Exhibit 125: Impact of drivers and challenges in 2022 and 202711 Vendor Landscape11.2 Vendor landscapeExhibit 126: Overview on Criticality of inputs and Factors of differentiation11.3 Landscape disruptionExhibit 127: Overview on factors of disruption11.4 Industry risksExhibit 128: Impact of key risks on business12 Vendor Analysis12.1 Vendors coveredExhibit 129: Vendors covered12.2 Market positioning of vendors Exhibit 130: Matrix on vendor position and classification12.3 Airedale Chemical Co. Ltd. Exhibit 131: Airedale Chemical Co. Ltd. – OverviewExhibit 132: Airedale Chemical Co. Ltd. – Product / ServiceExhibit 133: Airedale Chemical Co. Ltd. – Key offerings12.4 Ashok Alco Chem Ltd.Exhibit 134: Ashok Alco Chem Ltd. – OverviewExhibit 135: Ashok Alco Chem Ltd. – Product / ServiceExhibit 136: Ashok Alco Chem Ltd. – Key offerings12.5 BP PlcExhibit 137: BP Plc – OverviewExhibit 138: BP Plc – Business segmentsExhibit 139: BP Plc – Key newsExhibit 140: BP Plc – Key offeringsExhibit 141: BP Plc – Segment focus12.6 Celanese Corp.Exhibit 142: Celanese Corp. – OverviewExhibit 143: Celanese Corp. – Business segmentsExhibit 144: Celanese Corp. – Key offeringsExhibit 145: Celanese Corp. – Segment focus12.7 Daicel Corp.Exhibit 146: Daicel Corp. – OverviewExhibit 147: Daicel Corp. – Business segmentsExhibit 148: Daicel Corp. – Key newsExhibit 149: Daicel Corp. – Key offeringsExhibit 150: Daicel Corp. – Segment focus12.8 DubiChem Marine International Exhibit 151: DubiChem Marine International – OverviewExhibit 152: DubiChem Marine International – Product / ServiceExhibit 153: DubiChem Marine International – Key offerings12.9 Eastman Chemical Co.Exhibit 154: Eastman Chemical Co. – OverviewExhibit 155: Eastman Chemical Co. – Business segmentsExhibit 156: Eastman Chemical Co. – Key offeringsExhibit 157: Eastman Chemical Co. – Segment focus12.10 GNFC Ltd.Exhibit 158: GNFC Ltd. – OverviewExhibit 159: GNFC Ltd. – Business segmentsExhibit 160: GNFC Ltd. – Key offeringsExhibit 161: GNFC Ltd. – Segment focus12.11 HELM AGExhibit 162: HELM AG – OverviewExhibit 163: HELM AG – Product / ServiceExhibit 164: HELM AG – Key newsExhibit 165: HELM AG – Key offerings12.12 Indian Oil Corp. Ltd. Exhibit 166: Indian Oil Corp. Ltd. – OverviewExhibit 167: Indian Oil Corp. Ltd. – Business segmentsExhibit 168: Indian Oil Corp. Ltd. – Key offeringsExhibit 169: Indian Oil Corp. Ltd. – Segment focus12.13 INEOS Group Holdings SA Exhibit 170: INEOS Group Holdings SA – OverviewExhibit 171: INEOS Group Holdings SA – Business segmentsExhibit 172: INEOS Group Holdings SA – Key newsExhibit 173: INEOS Group Holdings SA – Key offeringsExhibit 174: INEOS Group Holdings SA – Segment focus12.14 LyondellBasell Industries NV Exhibit 175: LyondellBasell Industries NV – OverviewExhibit 176: LyondellBasell Industries NV – Business segmentsExhibit 177: LyondellBasell Industries NV – Key offeringsExhibit 178: LyondellBasell Industries NV – Segment focus12.15 Pentokey Organy (India) Ltd. Exhibit 179: Pentokey Organy (India) Ltd. – OverviewExhibit 180: Pentokey Organy (India) Ltd. – Product / ServiceExhibit 181: Pentokey Organy (India) Ltd. – Key offerings12.16 Saudi Basic Industries Corp. Exhibit 182: Saudi Basic Industries Corp. – OverviewExhibit 183: Saudi Basic Industries Corp. – Business segmentsExhibit 184: Saudi Basic Industries Corp. – Key offeringsExhibit 185: Saudi Basic Industries Corp. – Segment focus12.17 Dow Inc.Exhibit 186: Dow Inc. – OverviewExhibit 187: Dow Inc. – Business segmentsExhibit 188: Dow Inc. – Key newsExhibit 189: Dow Inc. – Key offeringsExhibit 190: Dow Inc. – Segment focus13 Appendix13.2 Inclusions and exclusions checklist Exhibit 191: Inclusions checklistExhibit 192: Exclusions checklist13.3 Currency conversion rates for US$ Exhibit 193: Currency conversion rates for US$13.4 Research methodologyExhibit 194: Research methodologyExhibit 195: Validation techniques employed for market sizingExhibit 196: Information sources13.5 List of abbreviationsExhibit 197: List of abbreviationsAbout UsTechnavio is a leading global technology research and advisory company. Their research and analysis focus on emerging market trends and provide actionable insights to help businesses identify market opportunities and develop effective strategies to optimize their market positions. With over 500 specialized analysts, Technavio’s report library consists of more than 17,000 reports and counting, covering 800 technologies, spanning across 50 countries. Their client base consists of enterprises of all sizes, including more than 100 Fortune 500 companies. This growing client base relies on Technavio’s comprehensive coverage, extensive research, and actionable market insights to identify opportunities in existing and potential markets and assess their competitive positions within changing market scenarios.ContactTechnavio ResearchJesse MaidaMedia & Marketing ExecutiveUS: +1 844 364 1100UK: +44 203 893 3200Email: media@technavio.comWebsite: www.technavio.com
View original content to download multimedia:https://www.prnewswire.com/news-releases/acetic-acid-market-size-to-grow-by-5-379-71-thousand-tons-at-a-cagr-of-5-39-by-2027-the-growing-paint-and-coatings-industry-to-boost-market-growth—technavio-301860950.htmlSOURCE Technavio


 Forex3 years ago
Forex Today: the dollar is gaining strength amid gloomy sentiment at the start of the Fed’s week
- Forex3 years ago
Unbiased review of Pocket Option broker
- Forex3 years ago
Dollar to pound sterling exchange rate today: Pound plummeted to its lowest since 1985
- Forex3 years ago
How is the Australian dollar doing today?
- Cryptocurrency3 years ago
What happened in the crypto market – current events today
- World3 years ago
Why are modern video games an art form?
- Commodities3 years ago
Copper continues to fall in price on expectations of lower demand in China
- Economy3 years ago
Crude oil tankers double in price due to EU anti-Russian sanctions


