Cryptocurrency
2023 Aftermath: By How Much Did Bitcoin Outperform S&P 500, NASDAQ, Dow Jones, and Gold?
It was another challenging year as one war continued without an evident conclusion (Russia-Ukraine), and another one broke out in the Middle East. Numerous countries are trying to fight off the increasing inflation, some with bigger success than others.
With just hours left of 2023, it’s interesting to compare the performance of the world’s largest stock market indexes, gold, which typically performs better during uncertain times, and Bitcoin – an asset that has been proclaimed dead numerous times in the past but still keeps coming back.
How Did Traditional Assets Perform in 2023
Starting with perhaps the most well-known US stock market index – the Standard and Poor’s 500. It tracks the performance of the 500 largest companies listed on stock exchanges in the US and is typically regarded as the benchmark that shows the health of the country’s financial state, at least in terms of large corporations.
It began the year at just over 3,820 points and quickly soared to 4,200 before returning to its starting position by March. The bulls stepped up on the gas in the following months, and the index jumped to 4,600 at the end of July. After another retracement, the S&P 500 finished the year strong and ended the last trading day of 2023 on December 29 at 4,769 – close to its all-time high.
In terms of percentages, the S&P 500 finished 2023 with a notable increase of roughly 25%. Although that seems quite impressive, one can easily see that most of the gains came from a few tech-related companies, such as Nvidia (245%).
Taking into consideration the aforementioned tech stocks, it’s logical that the Nasdaq Composite, which tracks mainly such assets, has soared the most from the indexes. In fact, the Nasdaq has outperformed almost all of its competitors with a 44.5% yearly surge that drove it from 10,386 at the start of 2023 to 15,011 at the end of it.
The Dow Jones Industrial Average, on the other hand, averts from tech-related stocks. The index that follows just 30 large US behemoths has increased by 13.74% in 2023 – from 33,136 to 37,689.

What About Gold?
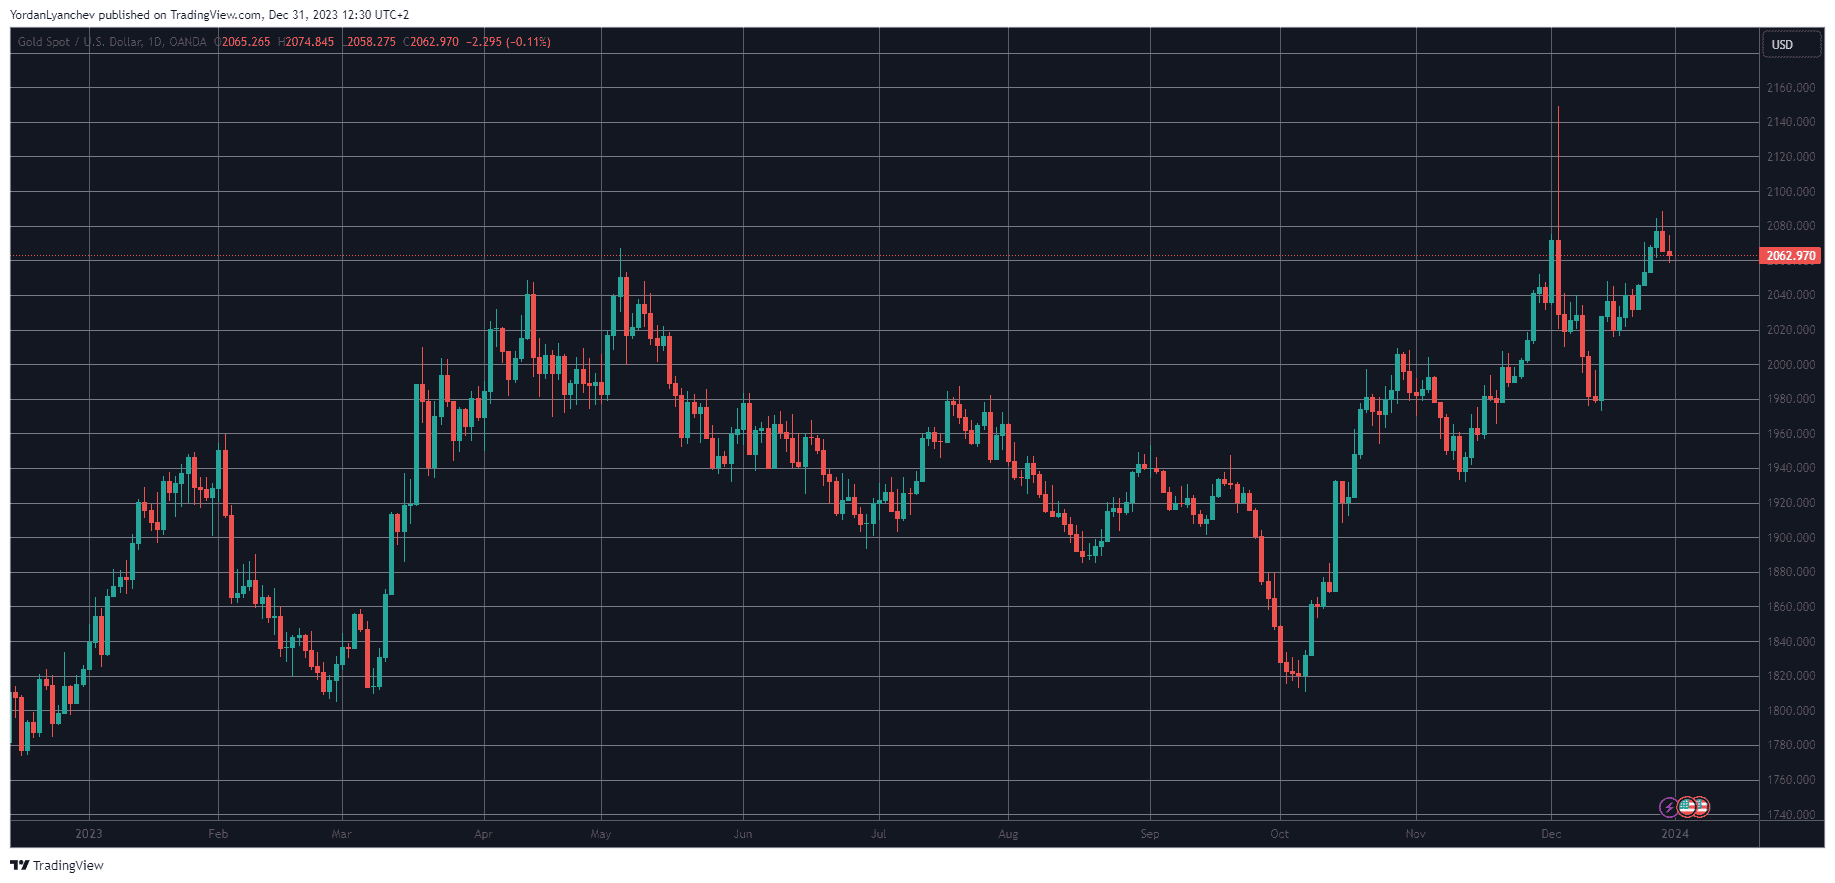
The yellow metal is regarded as the most prominent safe haven asset that tends to outperform the more riskier stocks during turbulent times. The past few years indeed fall into such a category, which has affected gold’s performance and resulted in untypical volatility.
One ounce of gold cost $1,813 on the financial markets at the start of 2023. Similar to most assets, the bullion had a strong spring and soared past $2,000 in April and May. The trend reversed after the summer, and the precious metal found itself dumping hard to its 2023 starting price at the beginning of October.
After the Hamas-Israel war broke out, though, gold went on a tear. Its price against the dollar exploded by over $300 in less than two months and marked an all-time high of $2,150/oz on December 5.
Since then, the precious metal has lost some traction but still ended 2023 above $2,060, charting a yearly increase of 13.73%.
And Then, There’s Bitcoin
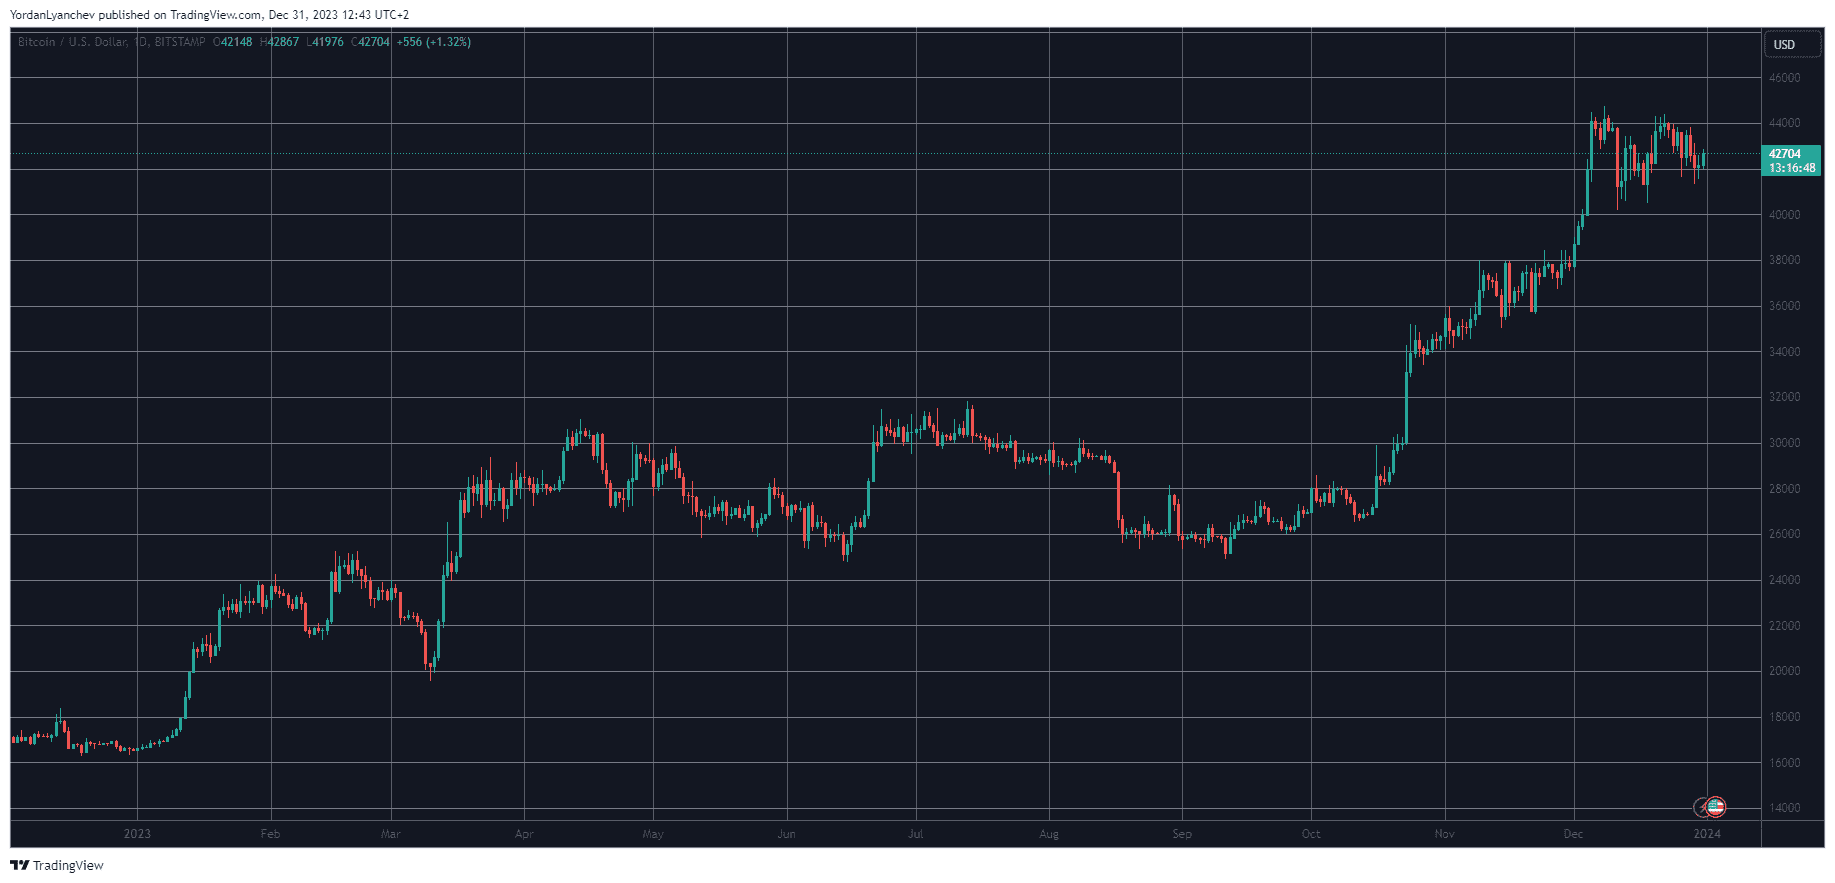
Bitcoin, alongside the rest of the crypto market, had a catastrophic 2022 due to industry collapses and adverse global events. As such, it entered 2023 at around $16,600. It didn’t take long before the asset broke out of its late-2022 nosedive. By January 13, it had soared past $20,000 and hadn’t looked back since, despite a few retracements along the way.
Then came reclaiming the $30,000 level, which was harder than anticipated. In fact, it took BTC several attempts to decisively overcome that level, which finally happened in late October.
Bitcoin kept climbing in the following weeks, which culminated in a price surge to nearly $45,000 in early December. It has lost some ground since then, and even though there’re still some hours left in 2023, it’s safe to assume that BTC will finish the year in a range between $42,000 and $43,000 unless something cataclysmic happens.
As such, Bitcoin’s YTD gains will be somewhere between 150% and 160%. This means that the cryptocurrency will trump all other large traditional finance assets mentioned above by a massive margin.
2024 has all the ingredients to be an even better year for Bitcoin, given the upcoming halving (usually serving as a catalyst for a bull market) and the potential approval of a spot BTC ETF in the States. Nevertheless, it’s worth noting that such an approval could serve as a sell-the-news moment, and history is no indication of future price performances.
Binance Free $100 (Exclusive): Use this link to register and receive $100 free and 10% off fees on Binance Futures first month (terms).

TL;DR
- Whales, hackers, and the Ethereum Foundation wallets moved over $500M in ETH through large sales and withdrawals.
- Ethereum transfers rose to 4.6M ETH, nearing the monthly high of 5.2M recorded in July.
- Staking inflows hit 247,900 ETH, the highest in a month, locking more supply from trading.
Large Withdrawals and Whale Activity
Ethereum (ETH) has seen heavy movement from major wallets over the past few days. On-chain data from Lookonchain shows a newly created wallet pulled 17,591 ETH, worth $81.62 million, from Kraken in just two hours.
Over three days, two new wallets withdrew a combined 71,025 ETH, valued at $330 million, from the exchange.
One of these wallets, address 0x2A92, has withdrawn 53,434 ETH, worth $242.34 million, in two days. This includes a recent purchase of 30,069 ETH, valued at $138.46 million, during a market drop.
Major ETH Holders Offload Millions Amid Price Rally
In contrast, several separate entities have been disposing of some ETH holdings. A wallet tied to a hacker address 0x17E0 sold 4,958 ETH for $22.13 million at $4,463, securing a profit of $9.75 million. Earlier this year, the same address sold 12,282 ETH at $1,932 and later bought back part of the amount at higher prices.
A different whale sold 20,600 ETH for $96.55 million over the past two days, generating a profit of more than $26 million after holding the position for nine months.
Meanwhile, an Ethereum Foundation-linked wallet, 0xF39d, sold 6,194 ETH worth $28.36 million in the last three days at an average price of $4,578.
Recent sales from the same wallet included an additional 1,100 ETH and 1,695 ETH for over $12.7 million combined.
The #EthereumFoundation-linked wallet(0xF39d) sold another 1,300 $ETH($5.87M) at $4,518 ~11 hours ago.
Over the past 3 days, this wallet has sold a total of 6,194 $ETH($28.36M) at an average price of $4,578.https://t.co/4hfCWymHVG pic.twitter.com/ErUyEY8SJy
— Lookonchain (@lookonchain) August 15, 2025
Network Activity on the Rise
CryptoQuant data shows Ethereum’s total tokens transferred have been climbing since August 9. After ranging between 1 million and 3 million ETH through late July and early August, transfers have risen to 4.6 million ETH, approaching the monthly high of 5.2 million recorded in mid-July. This increase has occurred alongside a price rally from about $3,400 to $4,600.

Interestingly, staking inflows generally stayed between 20,000 and 80,000 ETH per day over the past month. On August 14, inflows jumped to 247,900 ETH, the highest in the period.
At the time, ETH was trading near $4,600. Large staking deposits reduce the amount of ETH available for immediate trading, as staked coins are locked for a set period.

In the meantime, ETH trades at $4,647 with a 24-hour volume of $68.25 billion, down 2% on the day but up 19% over the week.
Binance Free $600 (CryptoPotato Exclusive): Use this link to register a new account and receive $600 exclusive welcome offer on Binance (full details).
LIMITED OFFER for CryptoPotato readers at Bybit: Use this link to register and open a $500 FREE position on any coin!

TL;DR
- Whales bought two billion DOGE this week, lifting their combined holdings to 27.6 billion coins.
- A single 900M DOGE transfer worth $208M to Binance drew attention to large exchange movements.
- DOGE broke key resistance, with momentum building for a possible push toward the $1 price mark.
Price and Market Moves
Dogecoin (DOGE) traded at $0.23 at press time, slipping 4% over the past day but still showing a 2% gain for the week. Daily turnover came in at about $6.18 billion.
Meanwhile, the broader crypto market saw over $1 billion in liquidations. Hotter-than-expected US Producer Price Index data pushed traders to scale back expectations of a near-term Federal Reserve rate cut. DOGE had roughly 290,500 coins liquidated during the sell-off.
On the two-week chart, analyst Trader Tardigrade notes that DOGE has cleared a downward-sloping resistance line after completing what appears to be a “wave V” in an Elliott Wave sequence. Similar setups in the past, where prolonged declines stayed within falling channels before breaking higher, have been followed by sharp rallies.
$Doge/2-week#Dogecoin is gaining strong momentum to surge above $1 pic.twitter.com/TuSEKr19nv
— Trader Tardigrade (@TATrader_Alan) August 15, 2025
Momentum gauges are also turning up. The Stochastic RSI, which had dropped into oversold territory, is now heading higher. Previous reversals from this zone have coincided with sustained upward moves. The current formation points to a possible run that could carry DOGE past the $1 mark.
Heavy Whale Buying and Large Transfers
As reported by CryptoPotato, blockchain data shows large investors have added two billion DOGE in the past week, spending just under $500 million. That brings their holdings to about 27.6 billion coins, or 18% of the supply. The buying streak has prompted speculation within the community.
Recently, Whale Alert flagged a 900 million DOGE transfer worth about $208 million into Binance. The tracking indicates that it originated from a wallet connected to the exchange, likely as an internal activity. The address involved holds 2.88 billion DOGE, one of the largest balances on the network.
Ali Martinez also reports that transactions above $1 million reached a one-month high, with activity building since early August and peaking as DOGE traded at $0.25.
Whales are back! Dogecoin $DOGE activity at a 1-month high. pic.twitter.com/C83Pv68mCt
— Ali (@ali_charts) August 14, 2025
Sentiment Building
Analyst Gordon described the current setup as “a nice bit of consolidation” before a potential breakout, adding,
“This will be one of the first coins normies FLOCK to & the pump will be MASSIVE.”
With whale accumulation rising, high-value transfers increasing, and a bullish technical pattern in play, DOGE is positioned for a potential push toward $1 if momentum holds.
Binance Free $600 (CryptoPotato Exclusive): Use this link to register a new account and receive $600 exclusive welcome offer on Binance (full details).
LIMITED OFFER for CryptoPotato readers at Bybit: Use this link to register and open a $500 FREE position on any coin!

XRP has recently entered a consolidation phase after a strong rally earlier this summer, with the price action now hovering around key resistance levels on both its USDT and BTC pairs. Yet, while momentum has slowed, the charts still indicate a generally bullish structure, with multiple key support levels remaining firmly in place.
Technical Analysis
By ShayanMarkets
The USDT Pair
On the XRP/USDT daily chart, the price is currently trading near the $3.10 mark, facing a strong resistance zone around $3.40. This follows a breakout above the $2.70 range in July, which has now flipped into a support area.
Both the 100-day and 200-day moving averages are also trending upward and recently formed a bullish crossover around $2.45, reinforcing the medium-term bullish sentiment. If the $3.40 resistance breaks, a push toward the critical $4.00 range becomes likely.
However, the RSI hovering near the neutral 50 level suggests a lack of strong momentum for now, meaning a short-term pullback into the $2.80 support zone is still possible.
This zone will be key for maintaining the bullish structure. Losing it could open the door for a deeper correction toward the 200-day moving average located around the $2.40 mark. Yet, as long as the price stays above the moving averages, the broader trend remains bullish.

The BTC Pair
Looking at the XRP/BTC chart, the pair has recently pulled back after hitting the 3,000 SAT resistance, with the price currently around 2,600 SAT.
This follows a clean breakout above the long-term descending channel and a successful retest of its upper boundary, which coincided with the 200-day moving average and the 2,400 SAT support zone. This confluence remains a key bullish technical factor, as holding above it could attract renewed buying pressure.
That said, RSI levels around 48 show that momentum has cooled after the sharp July rally, meaning XRP may continue ranging between 2,400 SAT and 3,000 SAT in the near term. A decisive close above 3,000 SAT would likely open the path to the 3,400 SAT zone, while losing 2,400 SAT could shift the bias back toward 2,000 SAT support. For now, the structure still favors the bulls as long as higher lows remain intact.

Binance Free $600 (CryptoPotato Exclusive): Use this link to register a new account and receive $600 exclusive welcome offer on Binance (full details).
LIMITED OFFER for CryptoPotato readers at Bybit: Use this link to register and open a $500 FREE position on any coin!
Disclaimer: Information found on CryptoPotato is those of writers quoted. It does not represent the opinions of CryptoPotato on whether to buy, sell, or hold any investments. You are advised to conduct your own research before making any investment decisions. Use provided information at your own risk. See Disclaimer for more information.
Cryptocurrency charts by TradingView.

 Forex3 years ago
Forex Today: the dollar is gaining strength amid gloomy sentiment at the start of the Fed’s week
- Forex3 years ago
Unbiased review of Pocket Option broker
- Forex3 years ago
Dollar to pound sterling exchange rate today: Pound plummeted to its lowest since 1985
- Forex3 years ago
How is the Australian dollar doing today?
- Cryptocurrency3 years ago
What happened in the crypto market – current events today
- World3 years ago
Why are modern video games an art form?
- Commodities3 years ago
Copper continues to fall in price on expectations of lower demand in China
- Economy3 years ago
Crude oil tankers double in price due to EU anti-Russian sanctions


