Cryptocurrency
ATOM Cosmos crypto ready for reversal: Expect a price rally in March

ATOM’s Cosmos crypto price shows signs of a completed correction that could lead to a sustained upward move.
Cosmos is a decentralized, scalable, interoperable ecosystem of interconnected independent blockchains built on the Tendermint Core protocol. It is a potential competitor to Ethereum. The goal of the project is to create a “blockchain internet” in which participants interact with each other in a decentralized way. Cosmos Hub’s native token is called ATOM. Holders can add it to stacking or delegate it to a validator to generate additional revenue.
Cosmos ATOM crypto price prediction
According to the weekly chart, ATOM is trading in a long-term range with limits of $8.90 and $15.60, which have been repeatedly confirmed since July 2022. Even though the asset was never able to break the upper boundary of the range, the weekly RSI looks bullish. The indicator has rebounded from the descending resistance line and is above the 50 level, which is considered a positive sign.
If Cosmos manages to break above $15.6, the price of the token might rise to the next resistance at $22. Otherwise, the asset is expected to fall to the nearest support area.
ATOM price reversal is just around the corner
The technical analysis of the six-hour chart shows that the ATOM price rebounded from the rising support line and continued to the upside and then corrected. If you combine this with the wave chart, we can assume that the asset has completed a five-wave upward movement. If so, its price is currently in wave C of the A-B-C correction.
The most likely level to complete the wave would be the area between $11.95 and $12, created by the 0.5 Fibonacci support level and the A:C wave ratio of 1:1. In this case, we can expect the ATOM price to reach $15.45 and head towards $22. A close below $11.12 would put this scenario in jeopardy, while a drop below $8.43 would cancel the long-term bullish outlook and could send ATOM towards $5.
We previously reported that Americans are interested in cryptocurrency despite strict regulation.


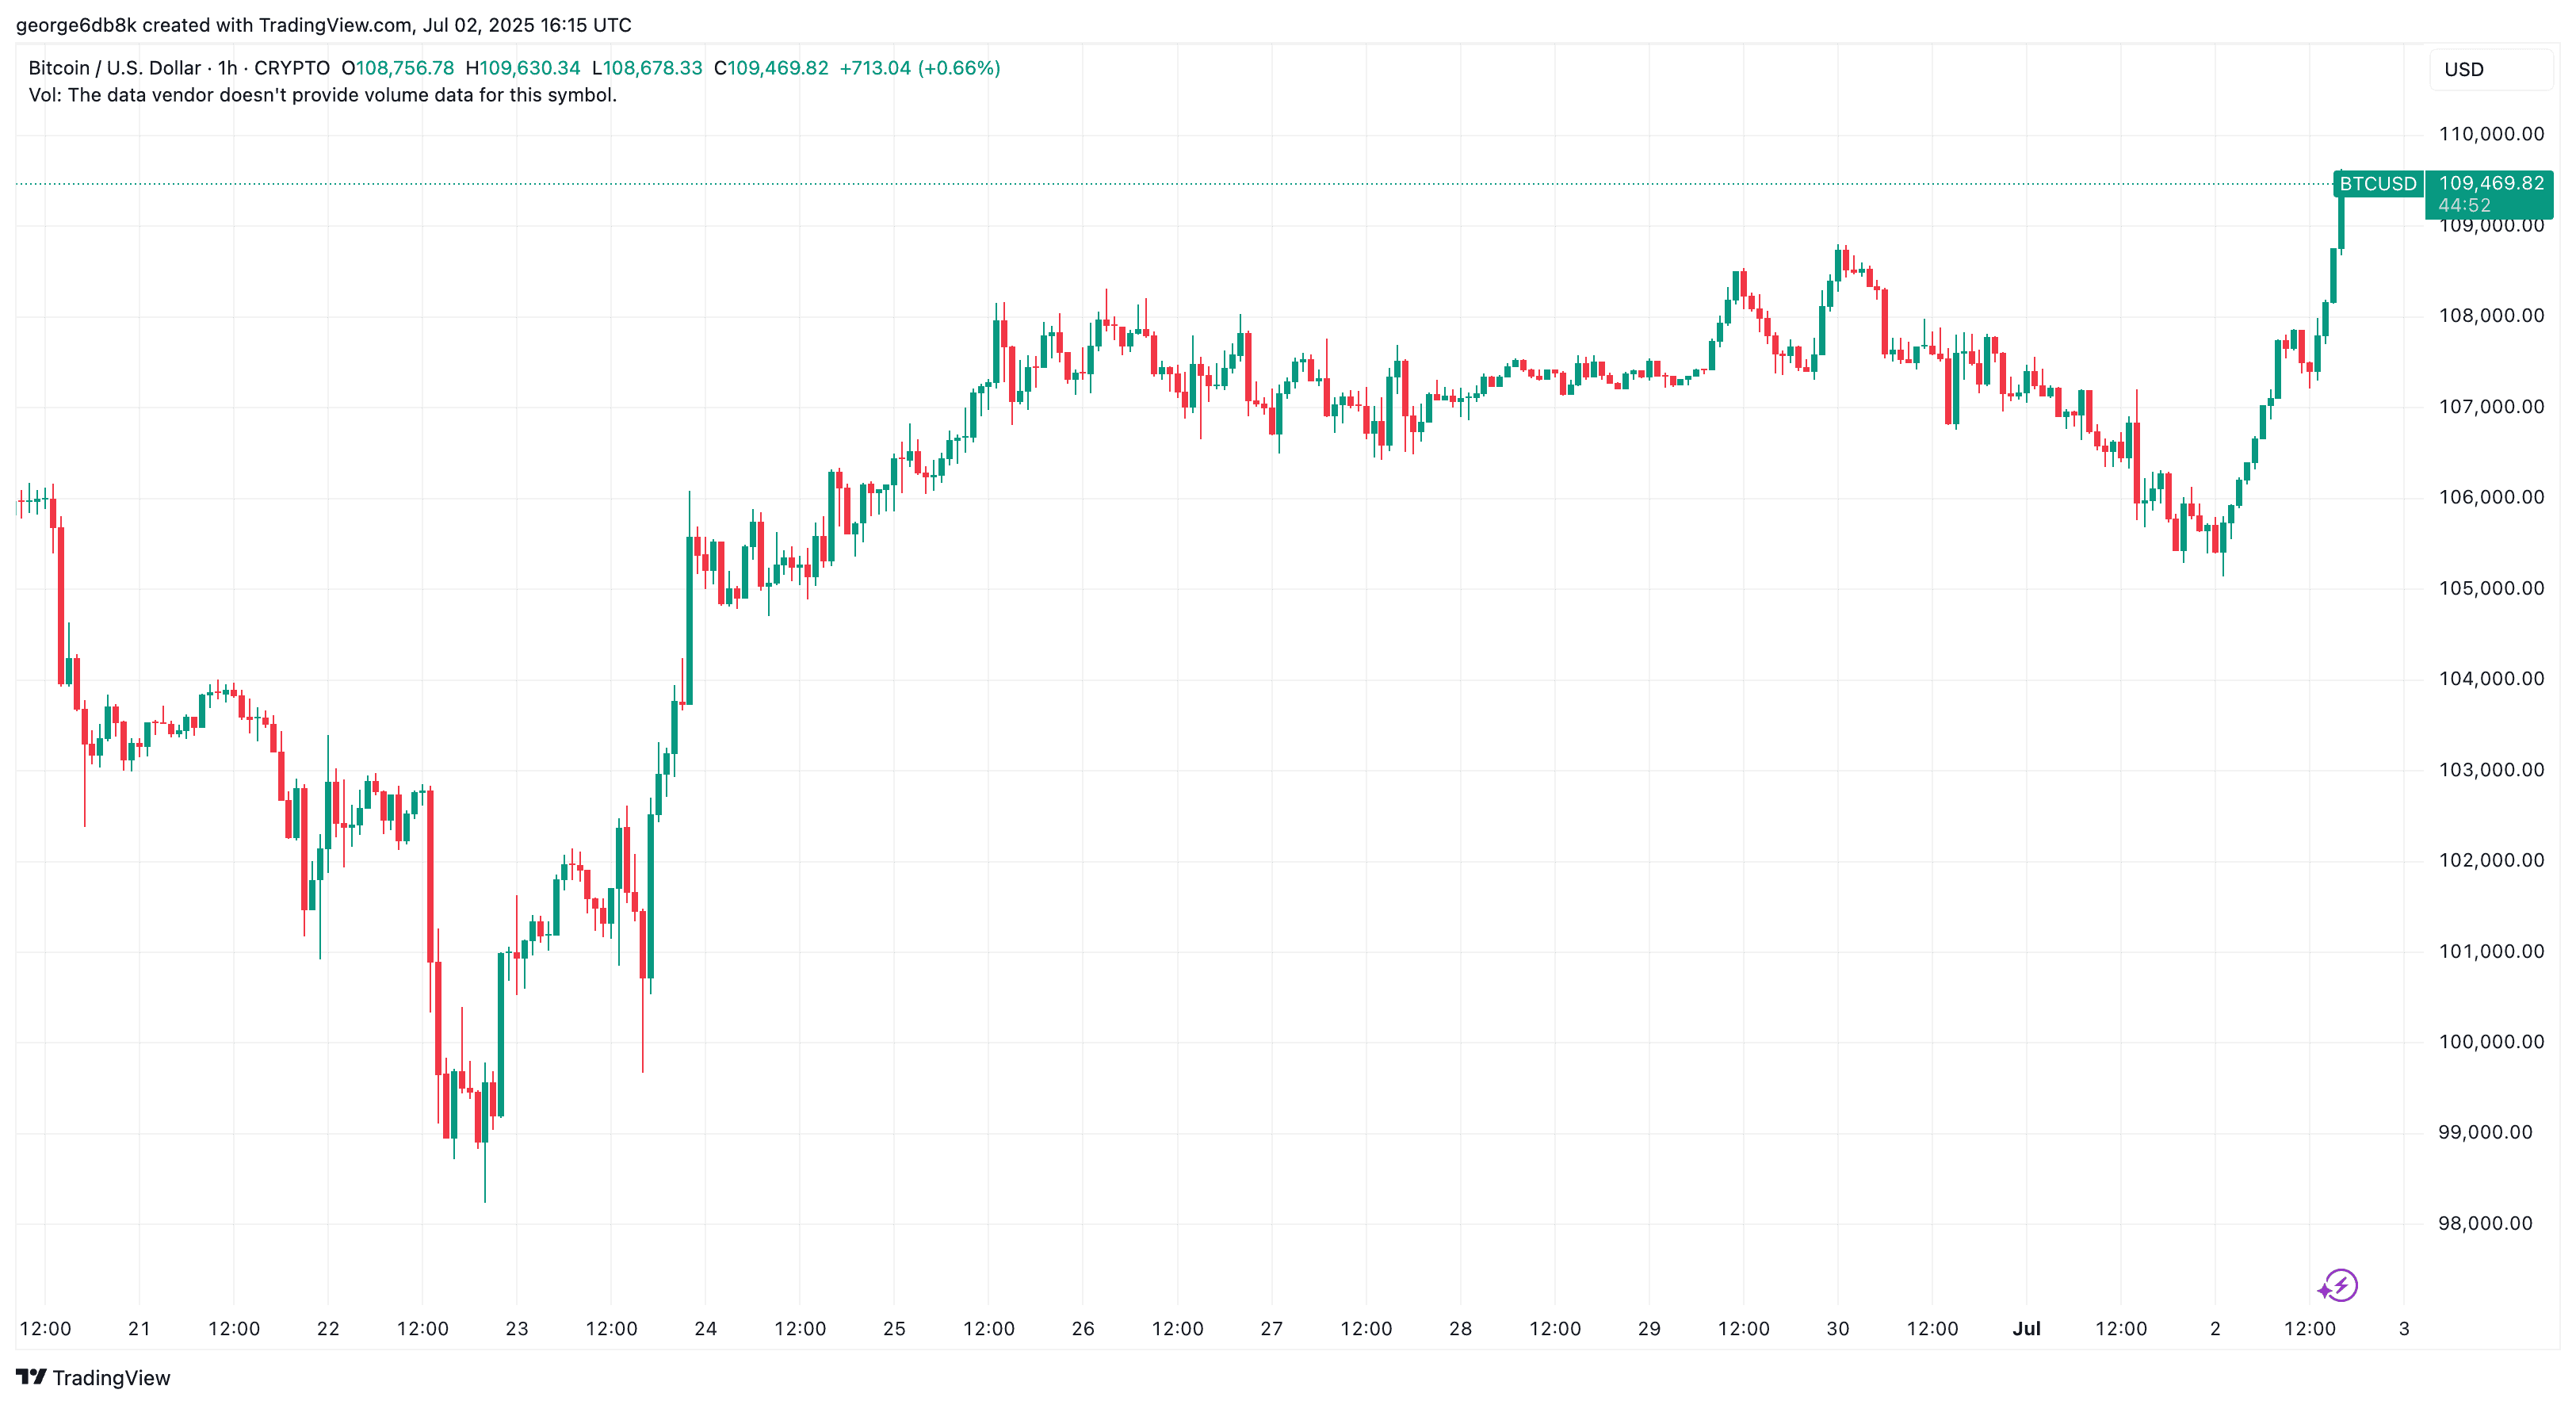
Bitcoin’s price has managed to completely erase the losses from yesterday and it appears that bulls are on the run again.
At the time of this writing, BTC is trading at around $109,500, preparing to test the pivotal technical and psychological level of $110K, sitting right below the cryptocurrency’s all-time high.
Data from Coinglass shows that the total number of liquidations across the derivatives market currently sits at almost $300 million – a 32% increase compared to the previous 24 hours.
BTC leads the way with around $50 million in liquidations, where the majority of positions were short. In total, $190M out of the $300 million in forced-closed traders were betting on the price to go down.
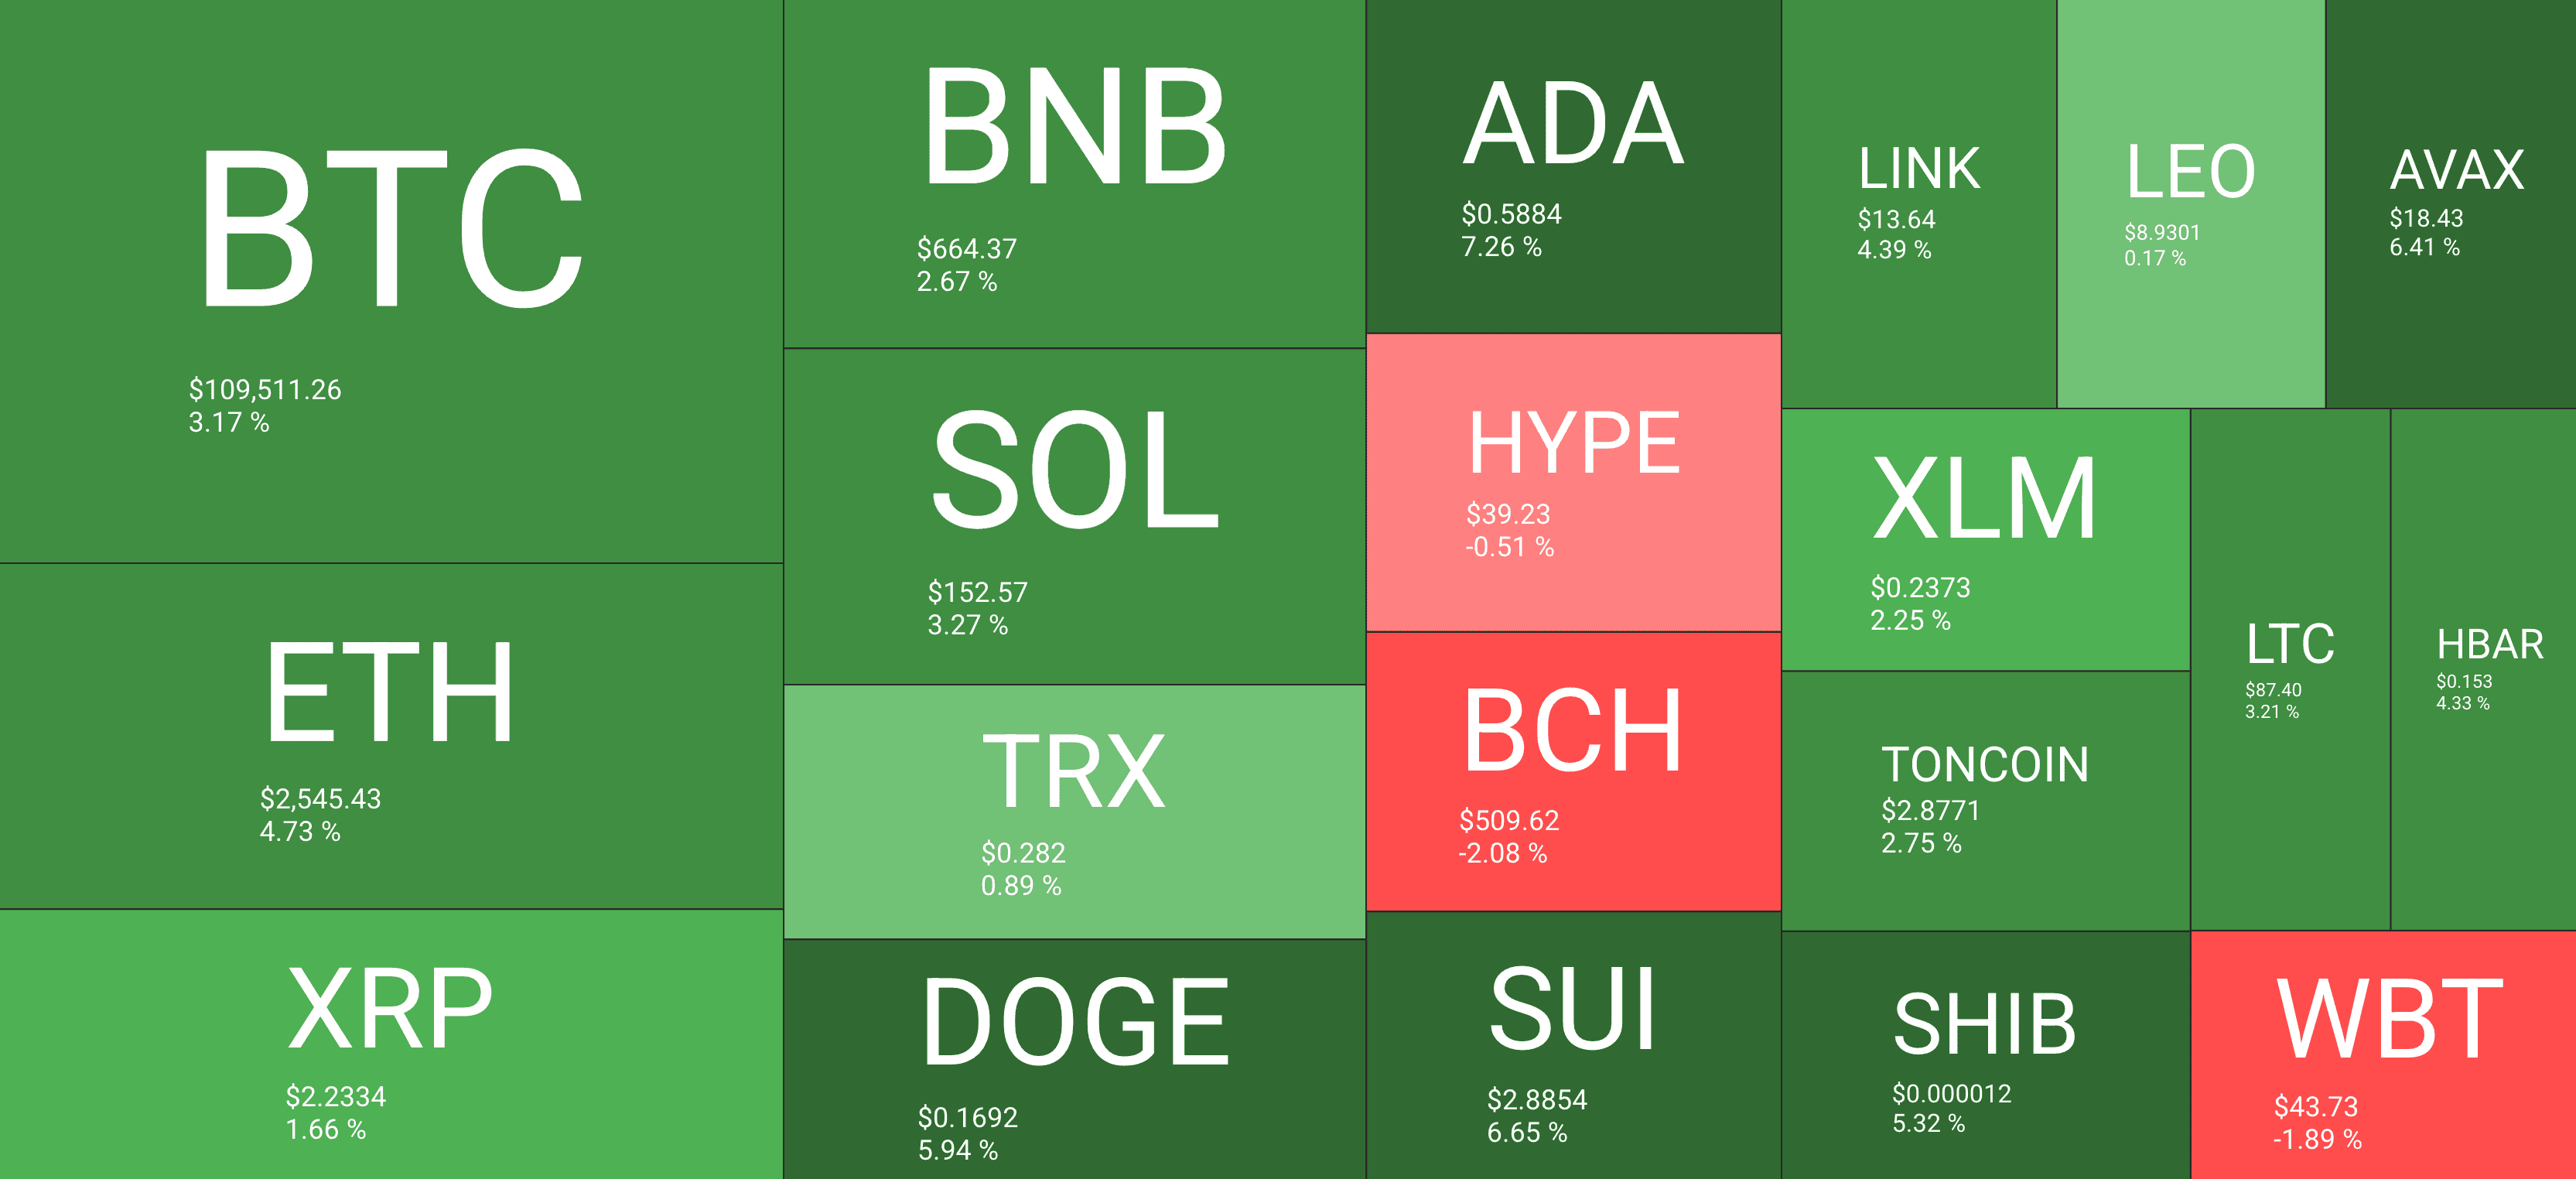
Naturally, the altcoins are following suite and are also recovering and most of them are now trading in the green. It’s interesting to see if this will transition into a more sustained upward movement in the next few days.
Binance Free $600 (CryptoPotato Exclusive): Use this link to register a new account and receive $600 exclusive welcome offer on Binance (full details).
LIMITED OFFER for CryptoPotato readers at Bybit: Use this link to register and open a $500 FREE position on any coin!

TL;DR
XRP’s recent dip comes alongside a drop in key on-chain metrics – like active accounts and executed transactions – hinting at declining user engagement and a potential short-term correction.
Despite the concerns, optimism remains high as Polymarket gives a 92% chance for a spot XRP ETF approval by end-2025, while negative exchange netflows suggest reduced immediate selling pressure.

Pullback on the Horizon?
Ripple’s XRP started July on the right foot, with its price rising to as high as $2.30. The uptrend, however, was short-lived, and it currently trades at around $2.17 (according to CoinGecko’s data).
Meanwhile, the decline of certain XRP metrics suggests the asset’s investors may have to endure a more substantial correction in the near future. Data shows that the number of active accounts, the number of executed transactions, and the number of newly activated accounts have headed south in the past few days.
This development points to reduced user engagement and utility in XRP’s ecosystem, which may lead to price stagnation or even a pullback.
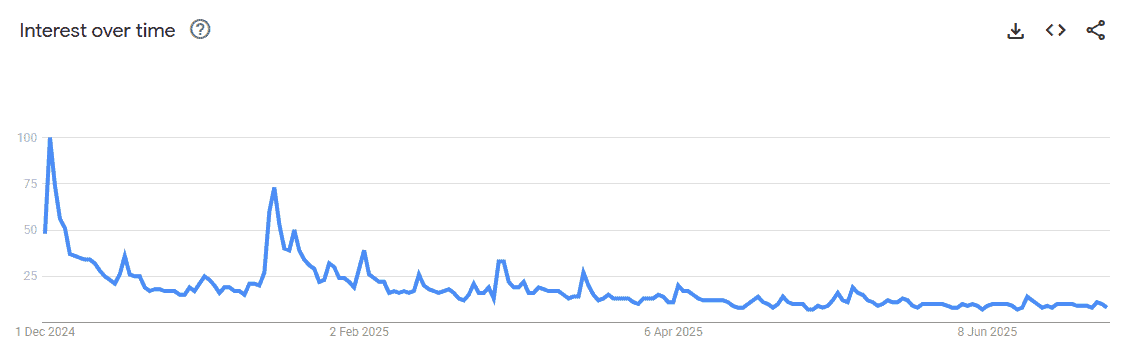
Interest in Ripple’s cross-border token has also waned over the past several months. Google searches involving the asset are currently far below the peak levels registered in December last year. This could mean that fewer new buyers are entering the market.
The Bullish Signals
Every coin has two sides, so let’s also observe the factors that suggest Ripple’s native token might be on the verge of a renewed rally.
To begin with, XRP investors could gain significantly if a spot ETF receives regulatory approval in the United States. A growing list of major firms – such as Grayscale, Bitwise, Franklin Templeton, 21Shares, and others – have already expressed interest in launching such a product.”
According to Polymarket, there’s a 92% chance that a spot XRP ETF will be greenlighted in America before the end of 2025.
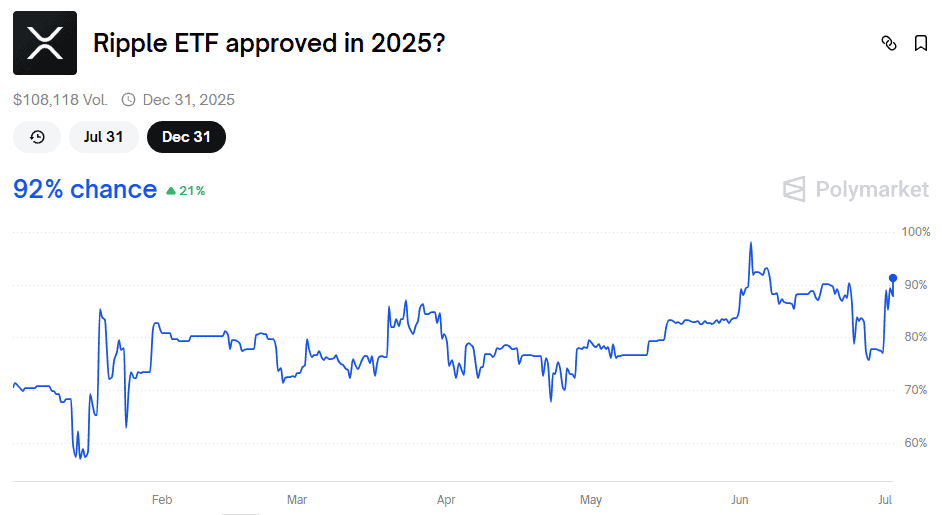
The surge in odds follows the SEC’s recent approval of Grayscale’s request to convert its Digital Large Cap Fund (GDLC) into a spot ETF – a fund that holds multiple cryptocurrencies, including XRP.
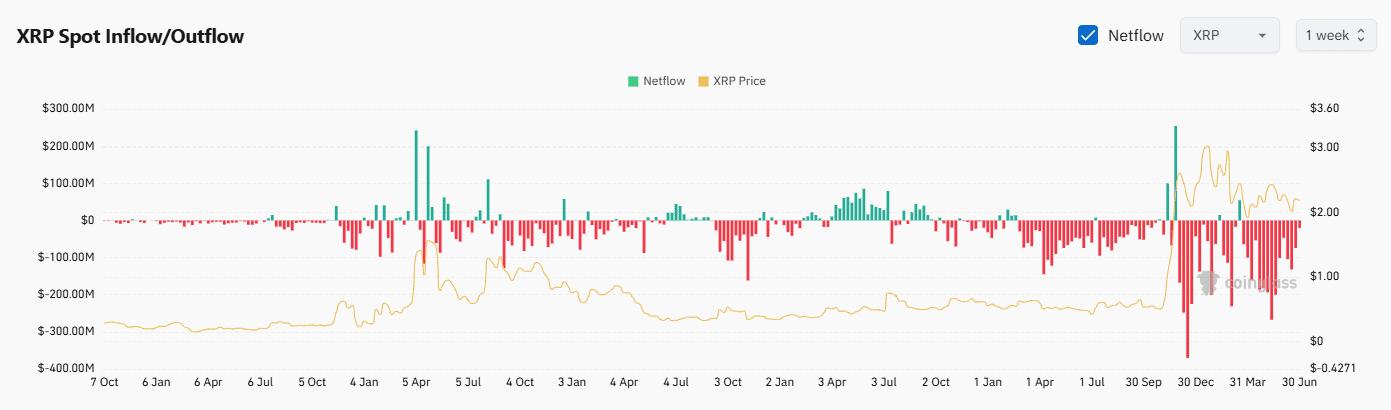
Next on the list is XRP’s exchange netflow, which has been predominantly negative in the last several weeks. This indicates that investors have switched from centralized platforms toward self-custody methods, reflecting a reduced immediate selling pressure.
Binance Free $600 (CryptoPotato Exclusive): Use this link to register a new account and receive $600 exclusive welcome offer on Binance (full details).
LIMITED OFFER for CryptoPotato readers at Bybit: Use this link to register and open a $500 FREE position on any coin!
About a month ago, market analysts noted that profit-taking on the Bitcoin network was modest. However, that has changed.
The on-chain insights provider Glassnode has revealed that profit-taking on the leading digital network is ramping up again. This comes as Bitcoin (BTC) remains in a consolidation phase following weeks of upward movement.
BTC Holders Take Profits
According to Glassnode’s tweet, bitcoin’s realized profits hit $2.46 billion on June 30, while the network’s seven-day Simple Moving Average (SMA) spiked to $1.52 billion.
The SMA, which identifies trends by averaging prices over a specific period, is currently above its year-to-date (YTD) average of $1.14 billion. However, the metric is still below its November-December 2024 peak of approximately $4.5 billion.
The spike in Bitcoin’s seven-day SMA indicates that coin distribution on the network is on the rise. Mid-to-long-term BTC holders have been leading this profit-taking spree; Glassnode said investors aged three to five years have realized at least $849 million in profits. This cohort of market participants is followed by those aged seven to ten years, with $485 million in profits, and investors aged one to two years with $445 million.
Short-term BTC holders, those holding for under one year, have been cashing out the least gains, at less than $6 million.
Interestingly, older BTC holders have been leading the profit-taking for this cycle. CryptoPotato reported a rise in spending by this cohort in late May, which drove the aggregate volume for the one- to five-year cohorts to $4 billion, its highest level since February. While older investors take the lead, the bulk of the volume is coming from this particular group of Bitcoin holders.
Whales Are Redistributing Too
Glassnode’s latest report is further substantiated by an analysis from the institutional decentralized finance (DeFi) analytics platform, Sentora (previously known as IntoTheBlock).
The firm disclosed that wallets holding more than 1,000 BTC have been steadily reducing their balances. This indicates that although institutional money is flowing into Bitcoin, whales are still offloading their holdings.
It is worth mentioning that Sentora sees the redistribution by whales as a sign of a maturing market rather than weakness. Older whale coins being dispersed could become a dynamic that would strengthen Bitcoin’s long-term potential.
Meanwhile, BTC was still consolidating at the time of writing, hovering under $110,000 – a level, which it has remained confined to in the last few weeks.
Binance Free $600 (CryptoPotato Exclusive): Use this link to register a new account and receive $600 exclusive welcome offer on Binance (full details).
LIMITED OFFER for CryptoPotato readers at Bybit: Use this link to register and open a $500 FREE position on any coin!

 Forex3 years ago
Forex Today: the dollar is gaining strength amid gloomy sentiment at the start of the Fed’s week
- Forex3 years ago
Unbiased review of Pocket Option broker
- Forex3 years ago
Dollar to pound sterling exchange rate today: Pound plummeted to its lowest since 1985
- Forex3 years ago
How is the Australian dollar doing today?
- Cryptocurrency3 years ago
What happened in the crypto market – current events today
- World3 years ago
Why are modern video games an art form?
- Commodities3 years ago
Copper continues to fall in price on expectations of lower demand in China
- Economy3 years ago
Crude oil tankers double in price due to EU anti-Russian sanctions


