Cryptocurrency
Bitcoin Price Analysis: Reclaiming This Level Will Open the Door for New All-Time High
Following a notable rebound, Bitcoin has surged toward the crucial 200-day MA of $88K. This price region is significantly important, as if the asset successfully reclaims it, it can exhibit a surge toward the ATH of $109K.
Technical Analysis
By Shayan
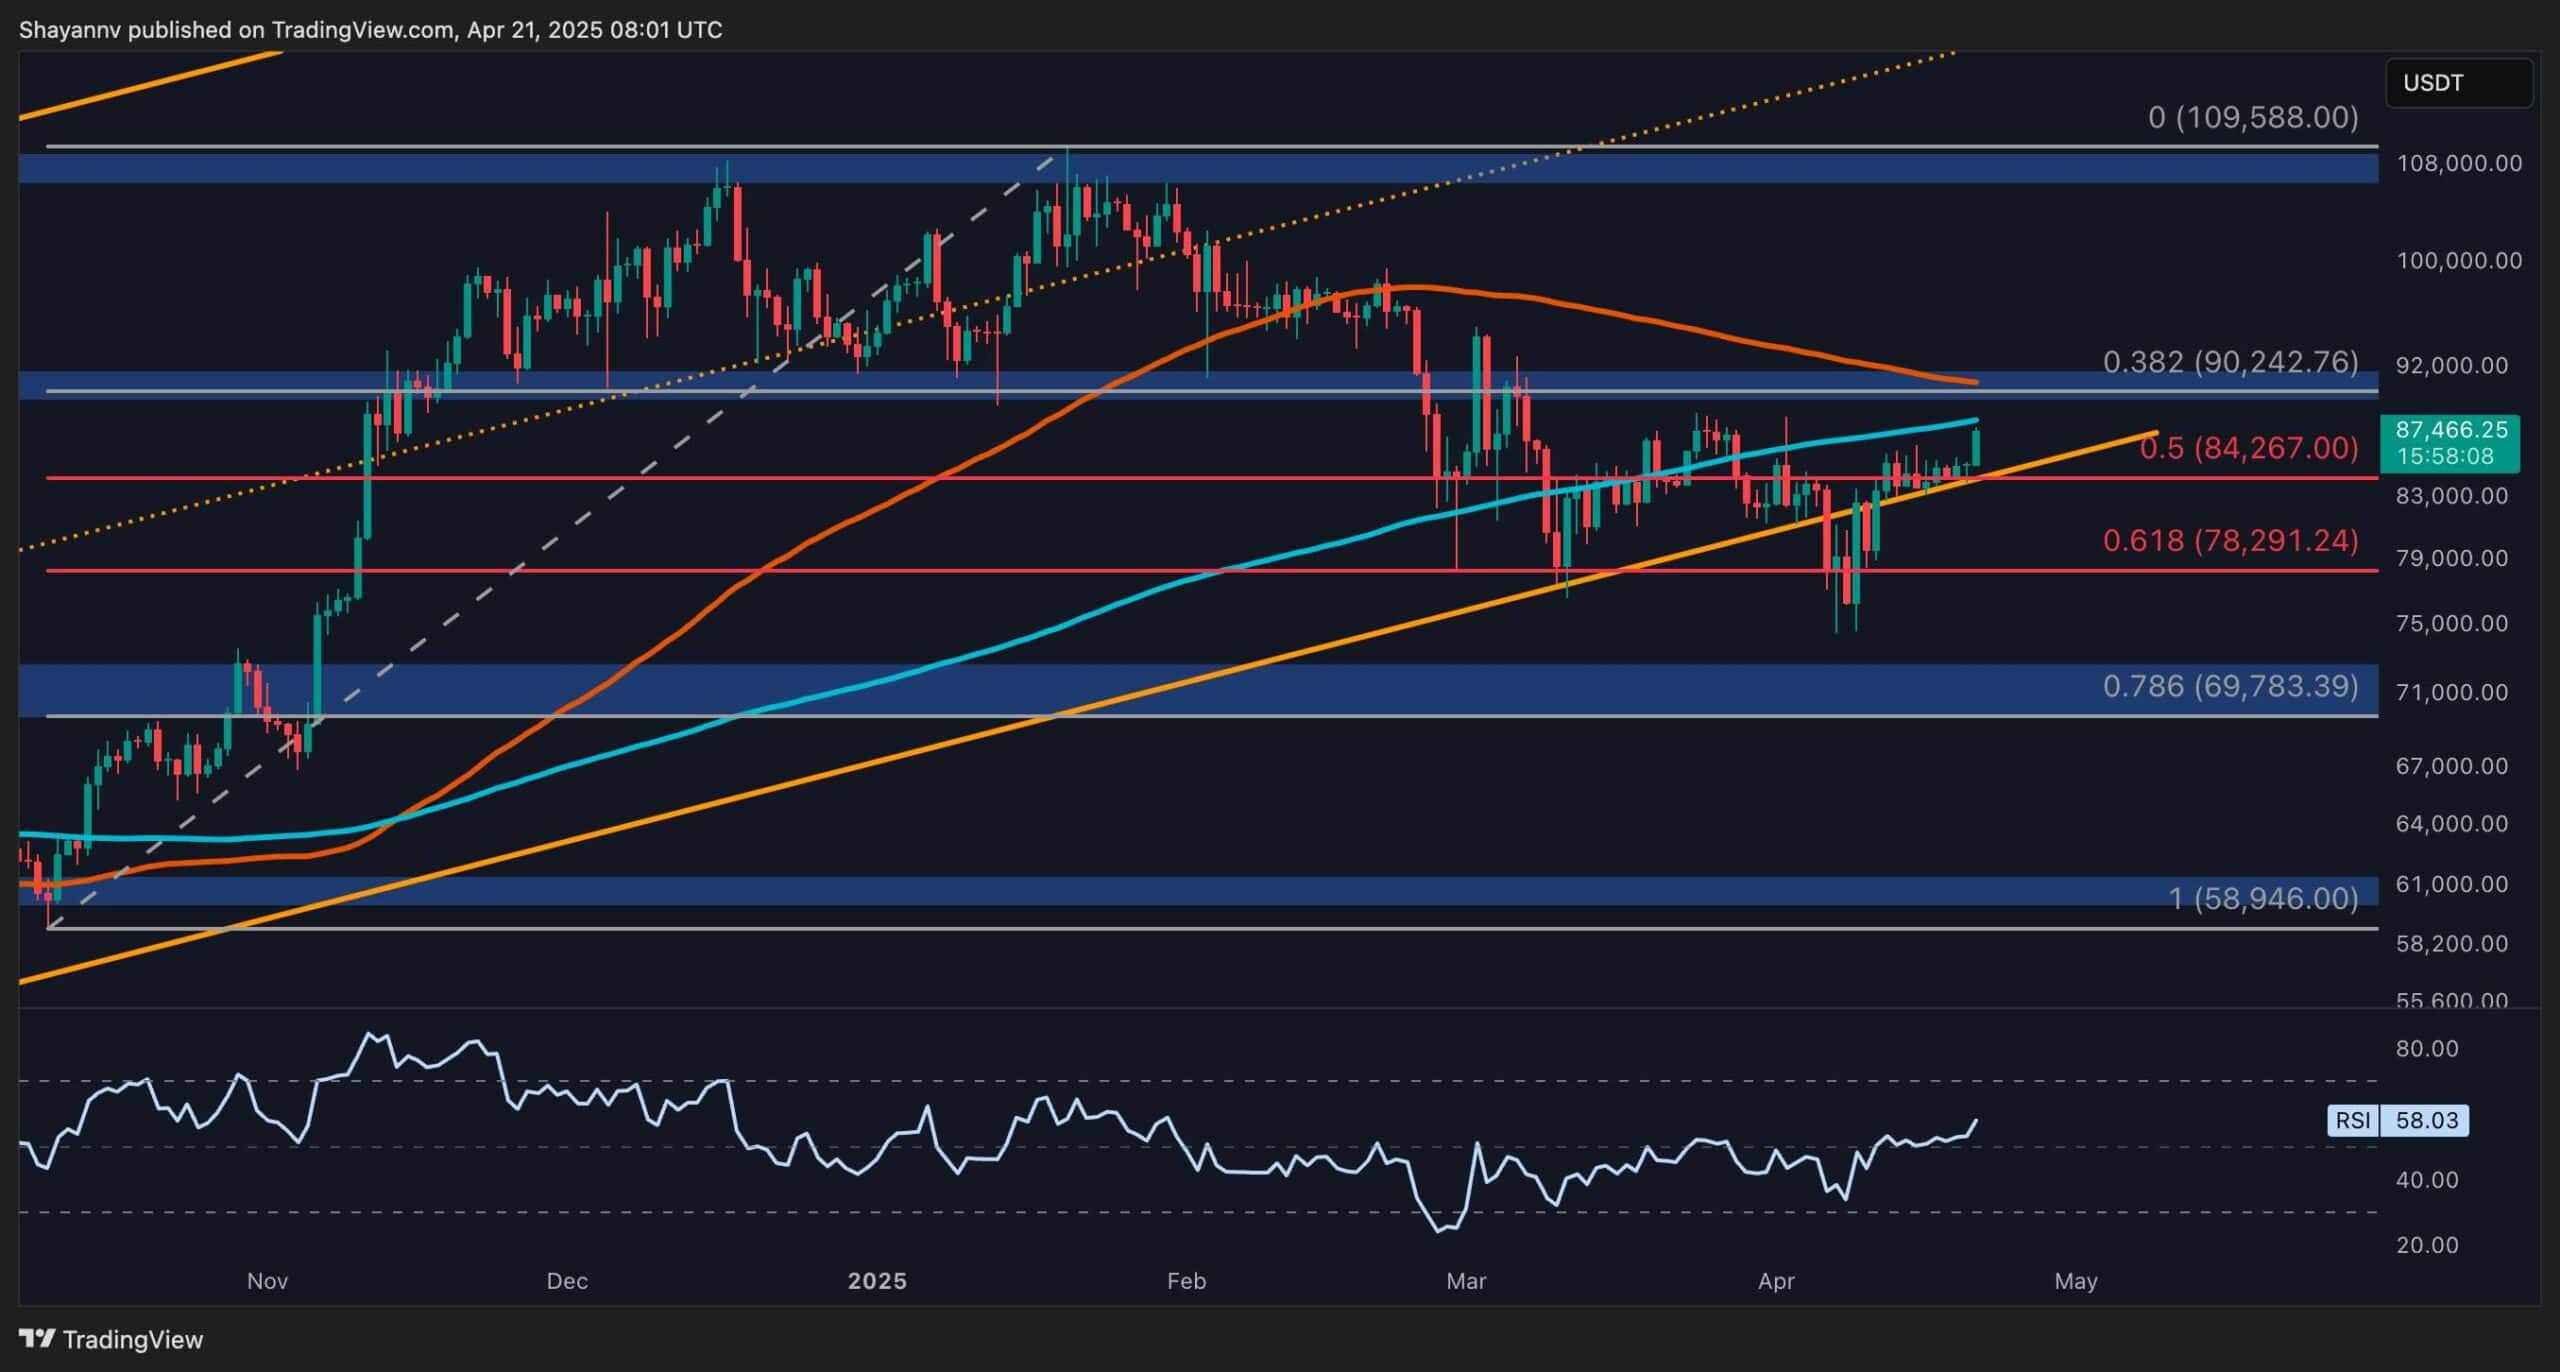
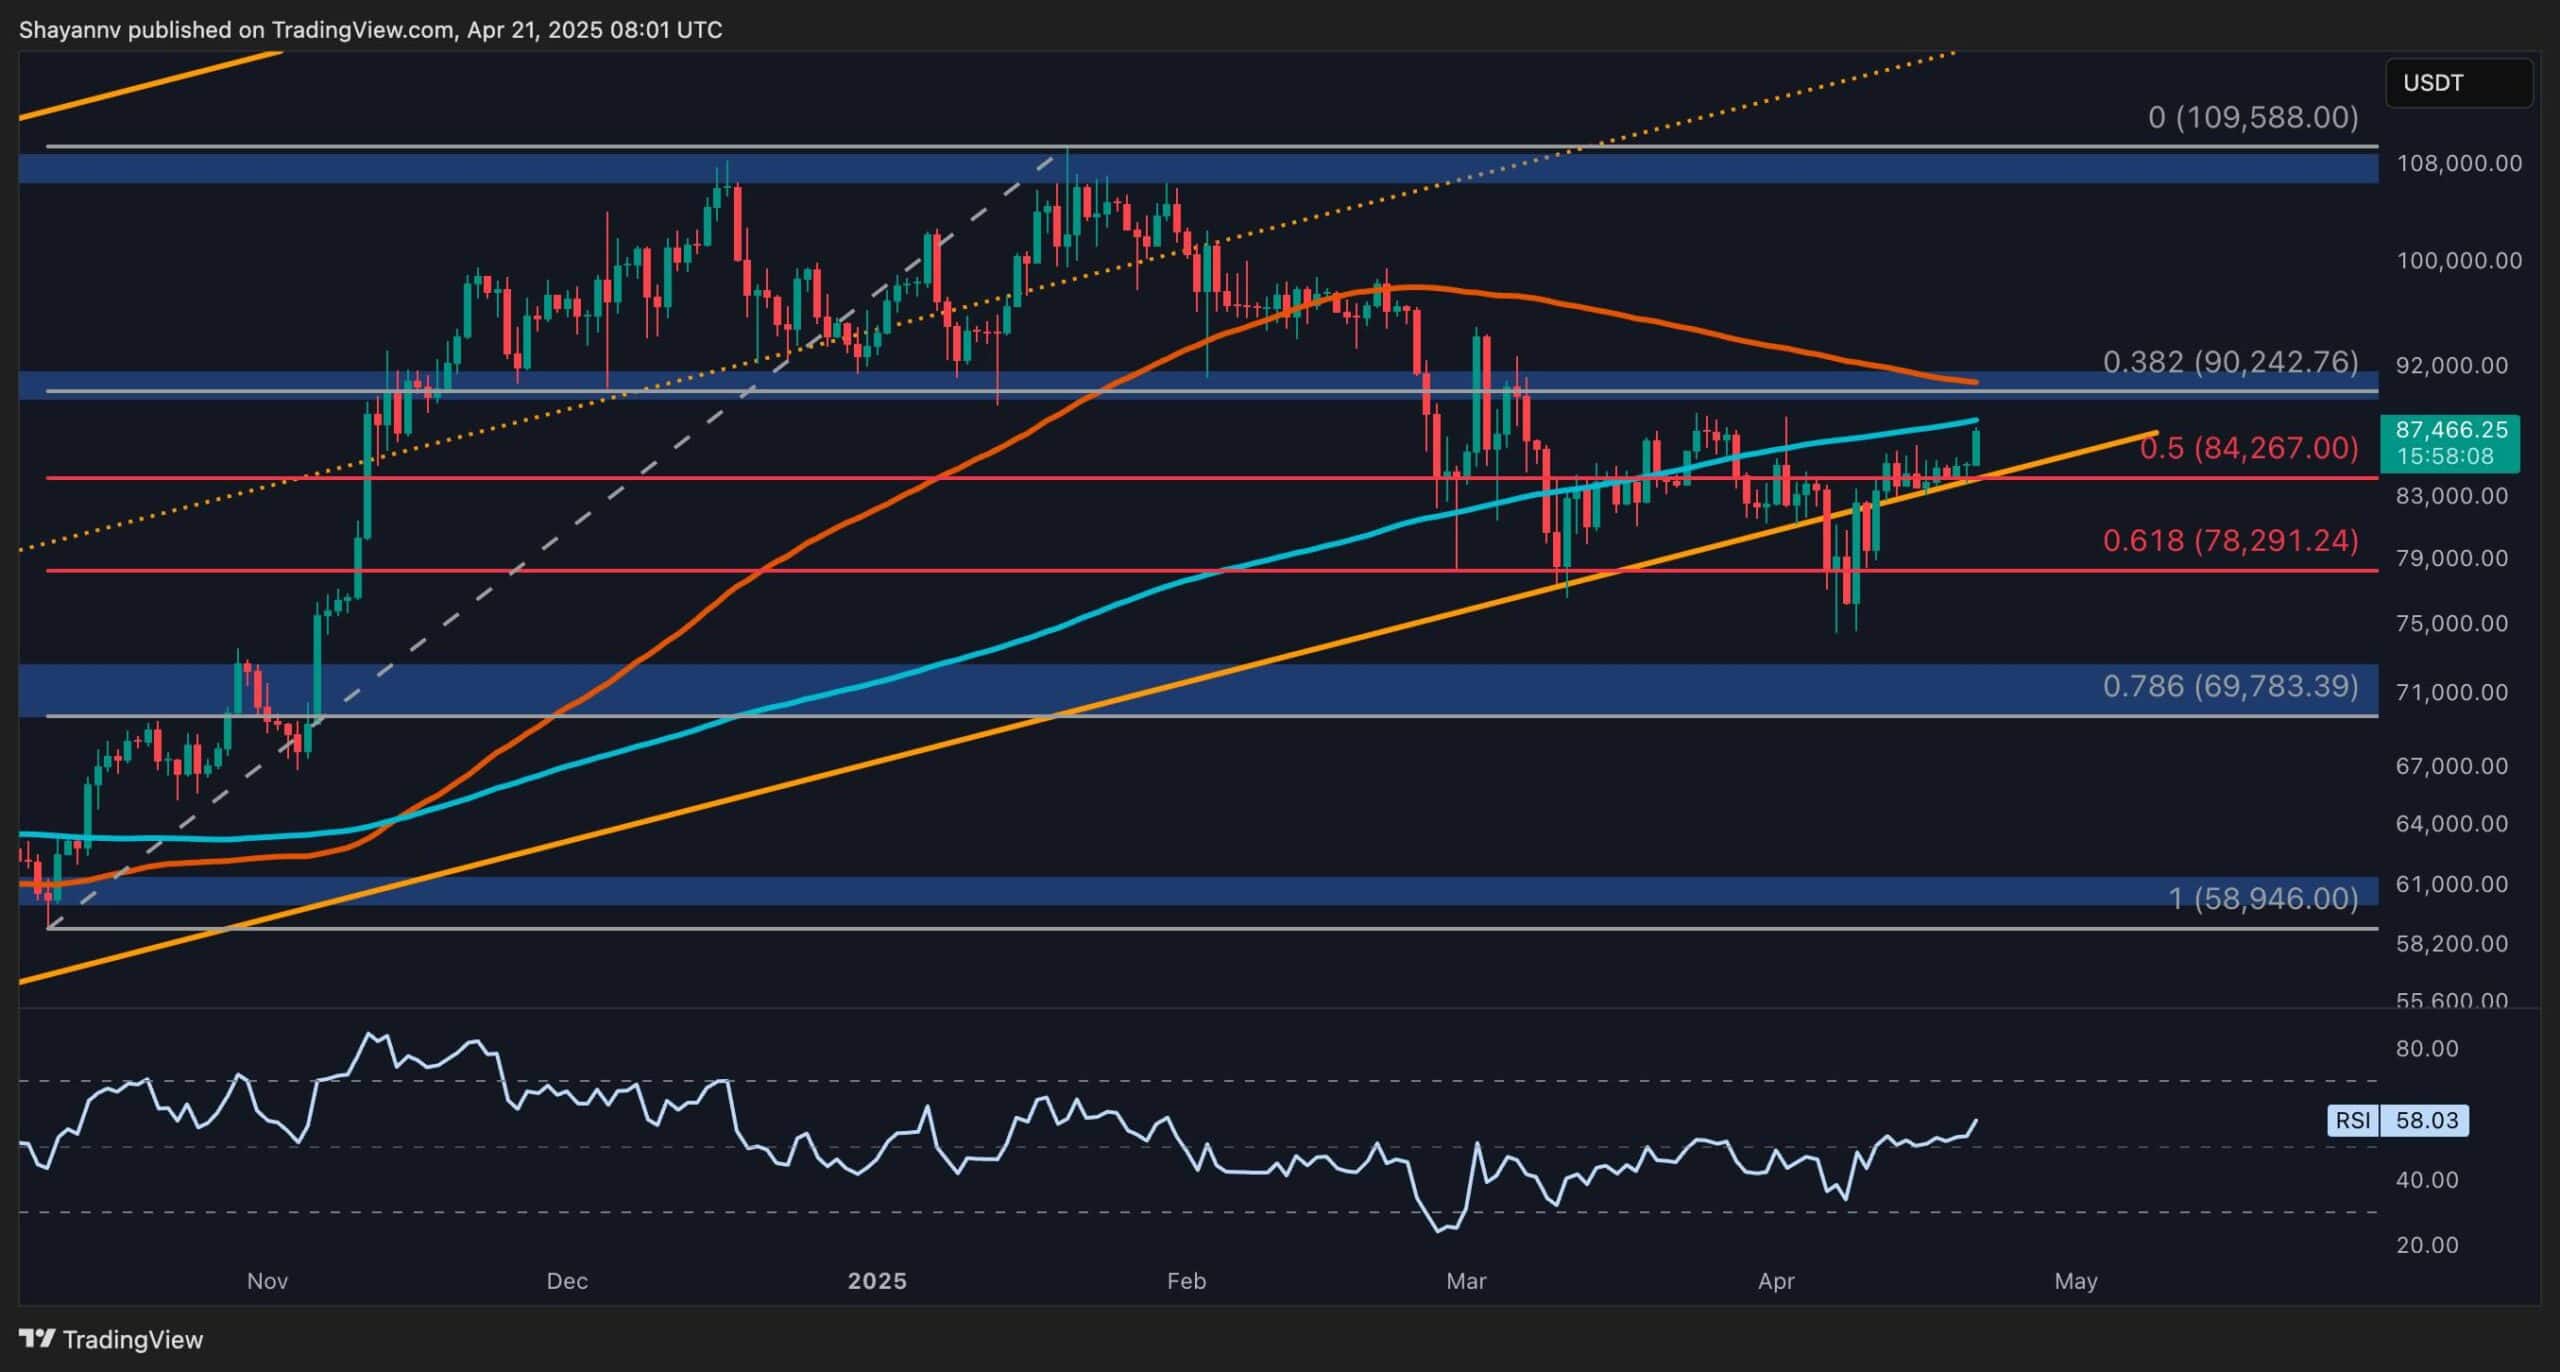
The Daily Chart
BTC has recently staged a notable bullish rebound after establishing strong support within the $75K–$80K demand zone. This upward move has propelled the price toward a decisive resistance area around the $88K mark. This level is particularly important as it coincides with both the 100-day and 200-day moving averages, as well as the asset’s previous daily swing high, making it a formidable barrier for the bulls.
Given the confluence of resistance factors, Bitcoin is expected to enter a temporary consolidation phase around this region. However, if bullish momentum prevails and the price breaks above $88K with strength, the next major target would be the $93K zone. A successful breach of that could open the door to a rally toward the all-time high of $109K.
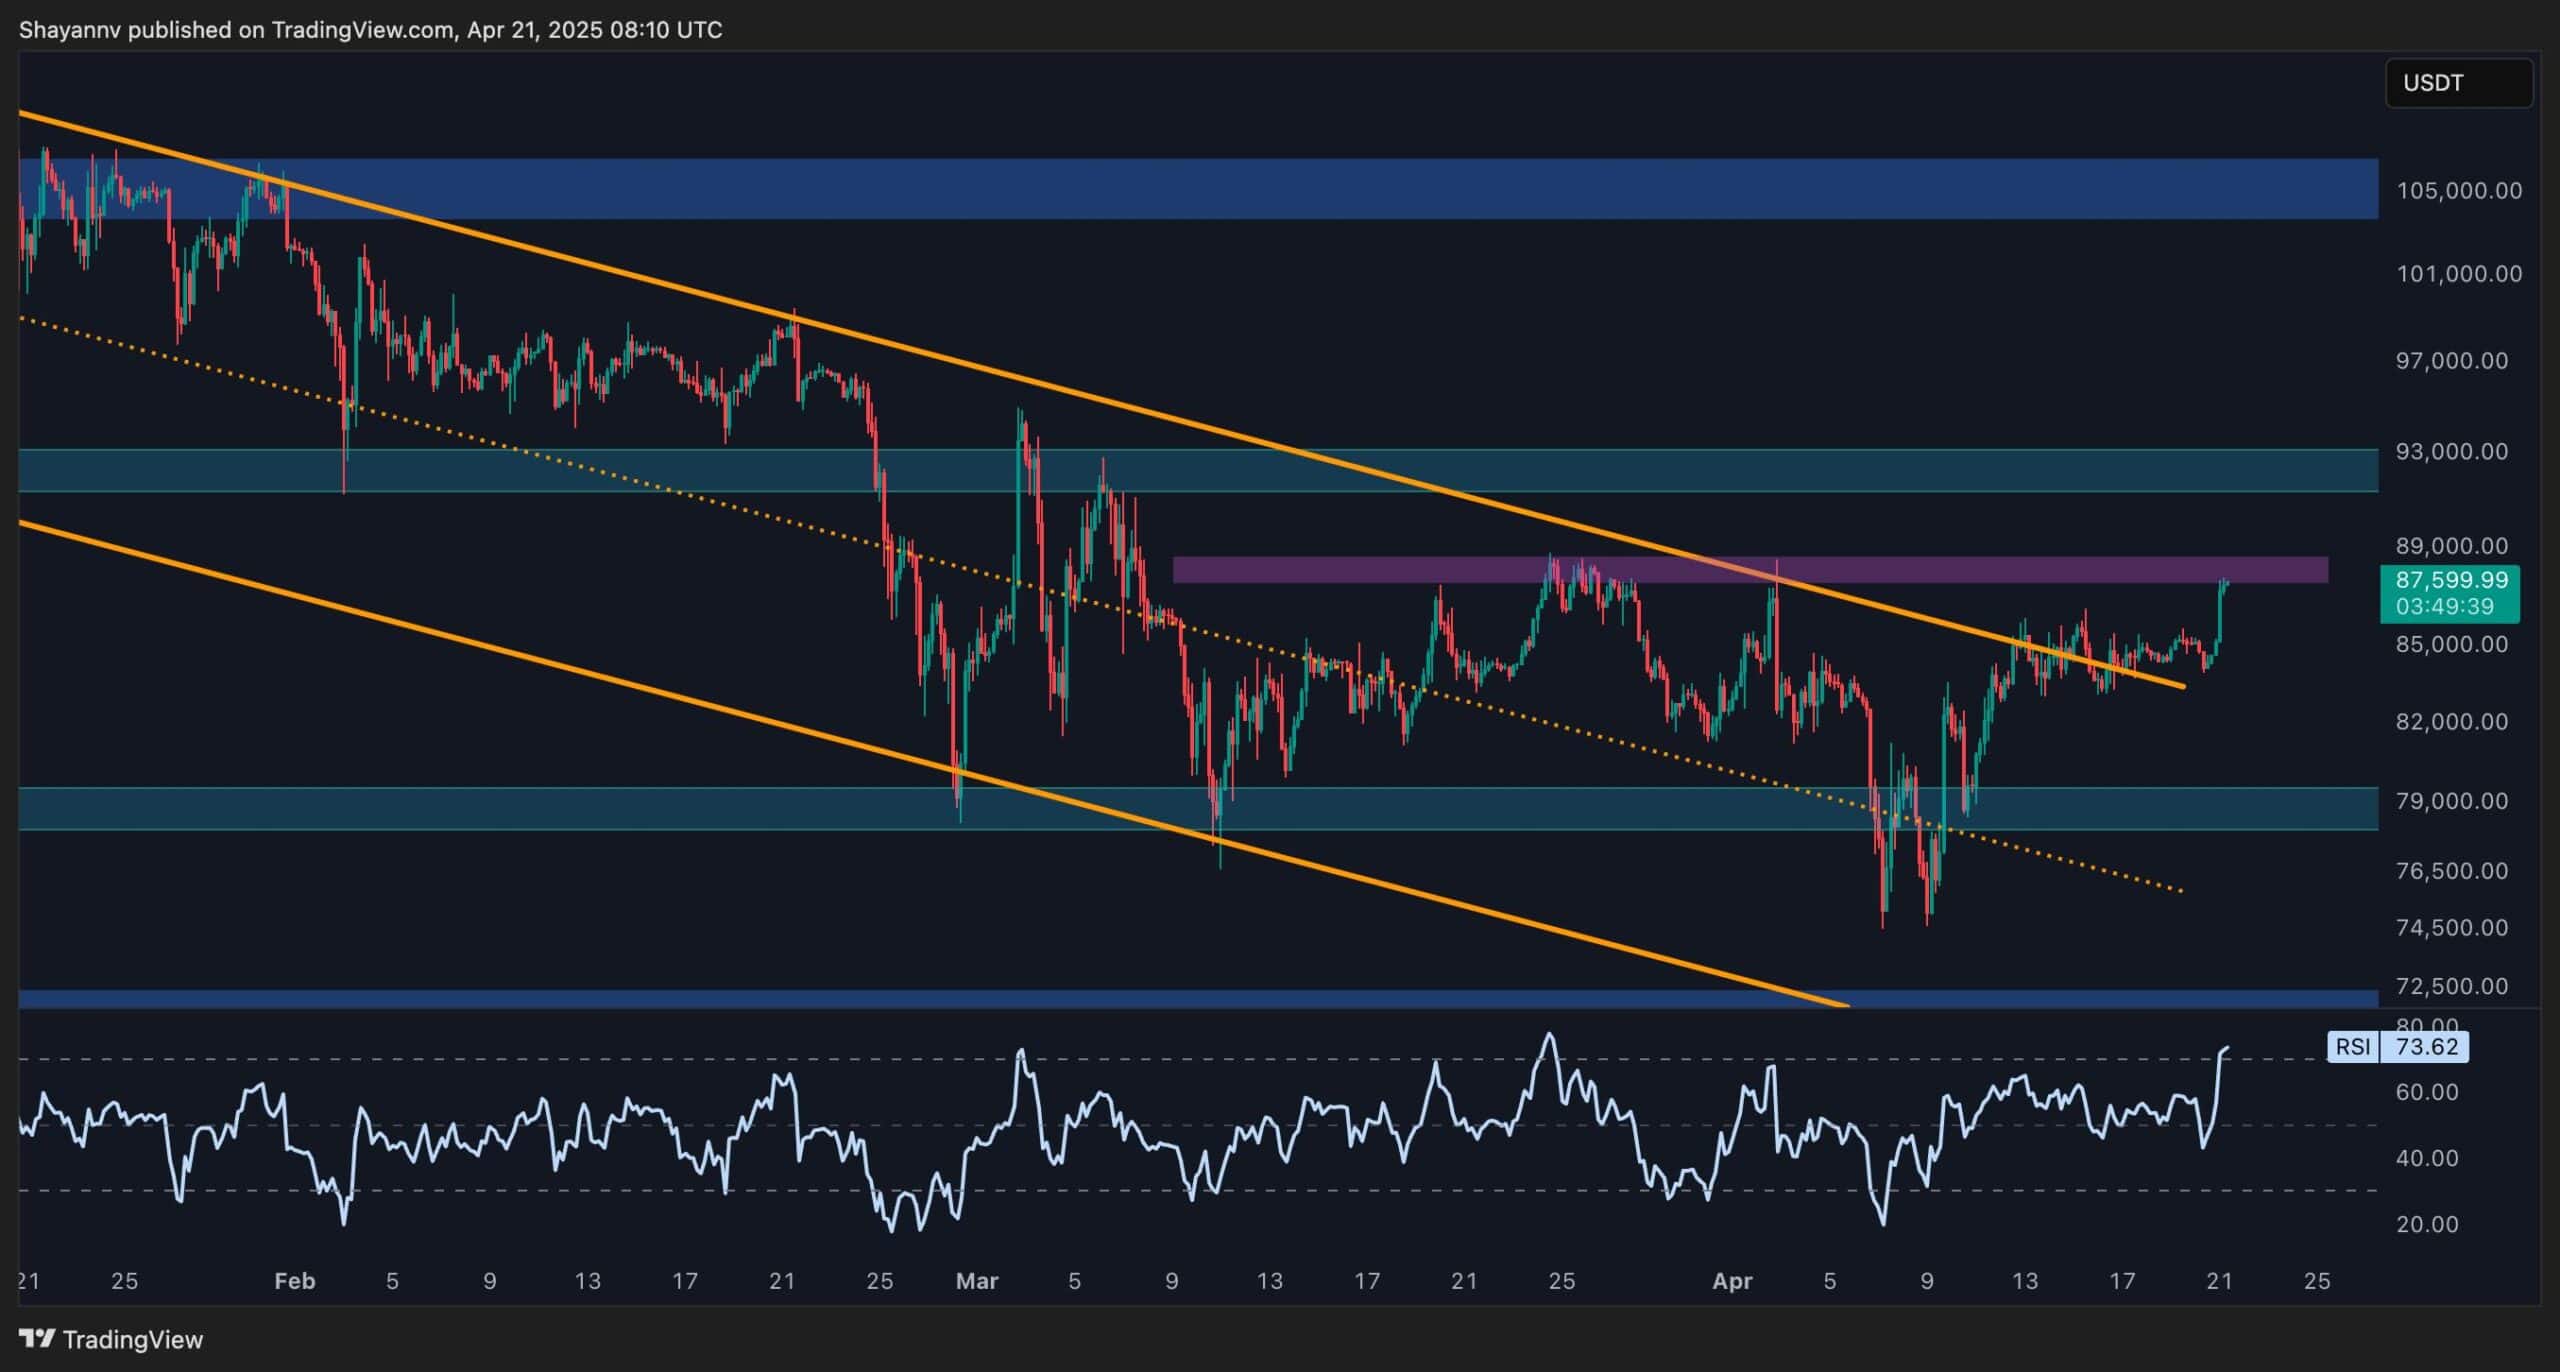
The 4-Hour Chart
On the lower timeframe, Bitcoin has broken above the upper boundary of the descending channel at $84K, signaling a bullish market structure shift. The breakout was followed by a pullback and continuation, confirming the breakout’s validity.
The asset has now reached a key short-term resistance zone at $88K, aligning with the previous major swing high on this timeframe. If bulls manage to break above this level, the path toward the $93K resistance becomes increasingly likely. Conversely, failure to surpass this barrier could result in a consolidation phase below $88K before any further directional move.
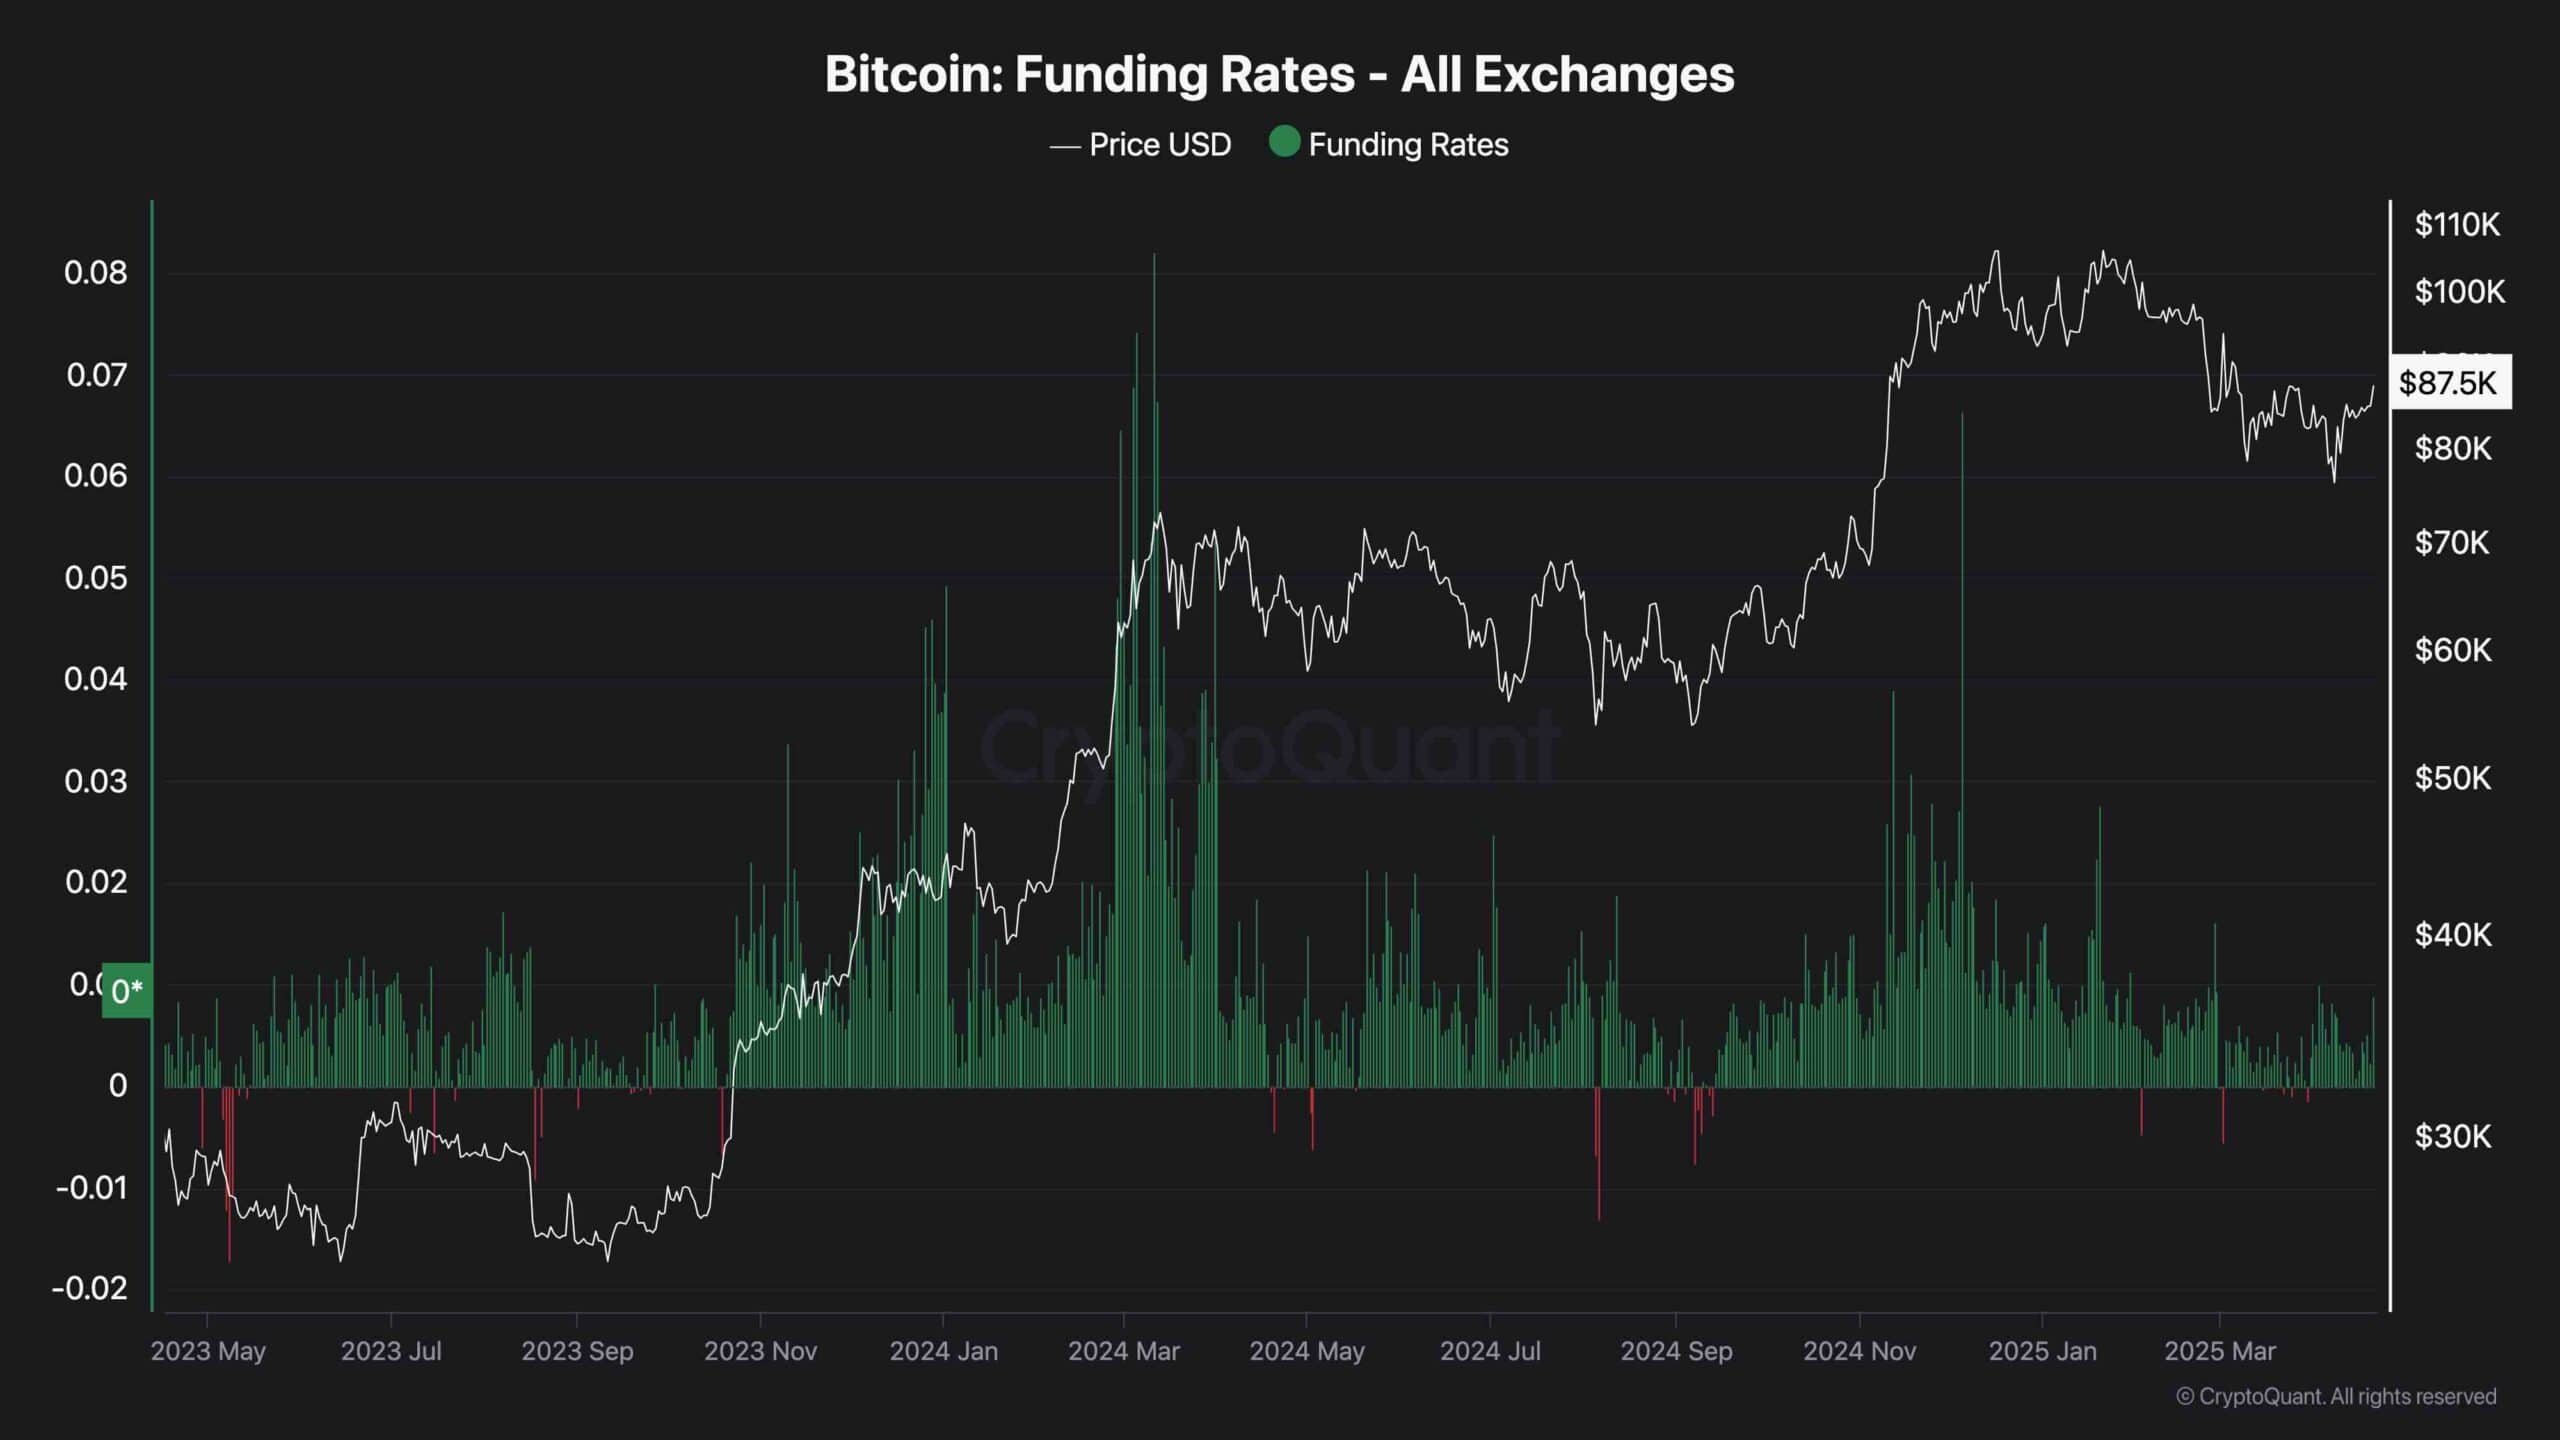
On-chain Analysis
By Shayan
Analyzing recent funding rate behavior provides valuable insights into Bitcoin’s potential next moves. During the recent market-wide sell-off, both price and funding rates declined significantly, signaling a cooling of speculative activity in the futures market. This pattern mirrors the March to September 2024 period, a phase characterized by extended consolidation and sharp corrections that ultimately led to a robust bullish rally.
Now, with funding rates surging once again, it suggests that market participants are increasingly opening aggressive long positions. If this momentum persists, Bitcoin could reclaim the key $93K resistance level and potentially push toward its all-time high.
Binance Free $600 (CryptoPotato Exclusive): Use this link to register a new account and receive $600 exclusive welcome offer on Binance (full details).
LIMITED OFFER for CryptoPotato readers at Bybit: Use this link to register and open a $500 FREE position on any coin!
Disclaimer: Information found on CryptoPotato is those of writers quoted. It does not represent the opinions of CryptoPotato on whether to buy, sell, or hold any investments. You are advised to conduct your own research before making any investment decisions. Use provided information at your own risk. See Disclaimer for more information.
Cryptocurrency charts by TradingView.


Cryptocurrency
Ripple (XRP) Price Explosion, Shiba Inu’s (SHIB) Potential, and More: Bits Recap July 18

TL;DR
- XRP surged by 60% in the last month, hitting a new historic peak. Analysts predict further gains, with targets up to $10.
- SHIB rose 30% in two weeks, yet 45% of holders remain in the red. Market observers see more upside based on certain chart patterns.
- BTC dipped to $119K after peaking at $123K, but strong ETF inflows and whale activity suggest the bull run may continue.

XRP Reached Uncharted Territory
Ripple’s XRP has been on the crest of the wave recently, with its price tapping an all-time high (on most exchanges and data aggregators) of over $3.60. The asset’s investors had to wait more than seven years for this achievement since the previous peak of approximately $3.40 was registered at the start of 2018.
Meanwhile, XRP’s market capitalization surged well above $200 billion, solidifying the token as the third-largest cryptocurrency and widening the gap with the fourth, Tether’s USDT.
The coin’s massive rally appears to be a combination of multiple bullish factors, including rising public interest, growing network growth, whales’ accumulation, and the recent green light on some important crypto bills in the United States.
Unsurprisingly, crypto X is rammed with users expecting the uptrend to continue in the short term. Ali Martinez believes a weekly close above $3 could open the door for a price ascent to as high as $4.80. Others like Javon Marks were even more bullish, envisioning a rise to the major milestone of $10.
What’s Going on With SHIB?
The second-largest meme coin experienced a 30% price increase over the last two weeks, while its market capitalization briefly exceeded $9 billion.
However, many of its holders await more substantial gains as they remain in the red. Earlier this week, the percentage of SHIB investors sitting on unrealized losses was around 54%, while currently it is 45%. This is so because a lot of holders joined the ecosystem years ago when Shiba Inu’s price was in much better condition.

Still, numerous analysts think the meme coin has the potential to pump much more significantly during this bull cycle. X user CJ claimed SHIB has formed “a pretty epic structure” on its price chart and predicted a massive jump in the near term.
Is BTC Ready for More?
While the leading cryptocurrency exploded to an all-time high of approximately $123,000 on July 14, it cooled off slightly in the following days. As of this writing, it trades at around $119,000, but certain indicators suggest the rally is far from being over.
BTC’s Market Value to Realized Value (MVRV), for instance, currently stands at around 2.36. “Historically, values over 3.7 indicated price top and values below 1 indicated price bottom,” CryptoQuant explained.

The flow of capital toward spot BTC ETFs remains solid, showing huge interest from investors, while the whales’ accumulation efforts can also be added to the bullish factors.
Binance Free $600 (CryptoPotato Exclusive): Use this link to register a new account and receive $600 exclusive welcome offer on Binance (full details).
LIMITED OFFER for CryptoPotato readers at Bybit: Use this link to register and open a $500 FREE position on any coin!
TL;DR
- XLM climbs 61% in seven days, nearing key resistance after strong technical breakout signals.
- Peter Brandt calls XLM the “most bullish chart,” eyes $1 breakout to confirm a multi-year pattern.
- Franklin Templeton tokenizes $446M in U.S. Treasuries on Stellar blockchain, boosting confidence.
Brandt Eyes Breakout Above $1
Stellar (XLM) has gained over 60% in the past week, with the price reaching $0.48 at press time. It is up nearly 5% in the last 24 hours, backed by a 24-hour trading volume of $2.1 billion. The rally has drawn fresh attention after market veteran Peter Brandt described the XLM chart as “potentially the most bullish chart of all.”
Brandt stated that XLM must hold above its April 2025 low near $0.22 and “must must close decisively above $1” to confirm the setup. Until that happens, he said, the chart “will remain range bound.”
Potentially the most bullish chart of all belongs to $XLM
XLM MUST MUST remain above Apr low and MUST MUST close decisively above $1. Until then this chart will remain range bound pic.twitter.com/NZvKLp5SVW— Peter Brandt (@PeterLBrandt) July 17, 2025
Price Structure Builds Toward Key Resistance
Notably, the long-term chart shows a potential ascending triangle along with a cup-and-handle pattern. Both patterns are forming below long-standing resistance at the $1.00 level. That resistance has been tested multiple times since 2018 but has not yet been broken on a closing basis.
XLM’s price is trading above both the 8-period and 18-period moving averages. The shorter-term average has crossed above the longer one, which often signals rising momentum. The ADX is at 45.16, showing that trend strength is elevated.
A short-term resistance area sits near $0.58, according to market analyst CW.
“$XLM is heading towards the sell wall at $0.58. Below that, there is support from the buy wall,” they said.
Stellar Network Sees Institutional Growth
Franklin Templeton recently tokenized $446 million in U.S. Treasuries on the Stellar network. This reflects continued use of the blockchain platform for real-world asset settlement.
In addition, the Stellar Development Foundation also announced new executive hires. José Fernández da Ponte, who previously led blockchain efforts at PayPal, has joined as President and Chief Growth Officer. Jason Karsh, who held roles at Blockchain.com and Coinbase, is now Chief Marketing Officer.
Stellar’s Protocol 23 is set for a mainnet vote on August 14, 2025. The proposal focuses on updates to core features. Ahead of the vote, interest in XLM has increased, with users and developers watching the outcome closely.
Binance Free $600 (CryptoPotato Exclusive): Use this link to register a new account and receive $600 exclusive welcome offer on Binance (full details).
LIMITED OFFER for CryptoPotato readers at Bybit: Use this link to register and open a $500 FREE position on any coin!
TL;DR
- ADA breaks resistance at $0.74 and tests $0.85 as bulls push toward higher price levels.
- Analysts eye $1.18 and $1.31 targets if ADA closes daily above the $0.85 breakout level.
- Open Interest on ADA hits $1.65 billion, setting a new record and showing rising trader confidence.
Cardano Holds Gains Near $0.85 After Breakout
Cardano (ADA) traded at $0.852 after rising 7% in 24 hours and 20% over the week. The move followed a breakout from a long downward trend, with buyers now pushing into higher price zones.
Earlier resistance around $0.74 had held the price in check during multiple attempts this year. That level has now been breached. ADA touched nearly $0.78 last week before a brief pullback, but buyers stepped in again, pushing the price above $0.84 heading into the weekend.
Analysts Watch the $0.85 Level for Confirmation
Crypto analyst Ali Martinez said a daily close above $0.85 could open the way toward $1.31. His view is based on earlier market structure and current momentum. ADA has cleared the $0.68 mark, which may now serve as support if prices remain above it.
A daily close above $0.85 could propel Cardano $ADA toward the next key resistance at $1.31! pic.twitter.com/RVgw3yE9lr
— Ali (@ali_charts) July 17, 2025
Marcus Corvinus noted that ADA has exited a long-term descending channel and flagged $0.77 to $0.82 as the next zone to watch. He added that holding above $0.82 could shift attention to $1.18. On the downside, $0.68 and $0.58 are the nearest support zones in case of any pullback.
Open Interest Pushes Higher With Price
Cardano’s recent gains are backed by rising interest in its futures market. Data from CoinGlass shows Open Interest (OI) on ADA has grown by 16% in the last 24 hours, reaching $1.65 billion, surpassing the previous record high of $1.50 billion set on January 18.
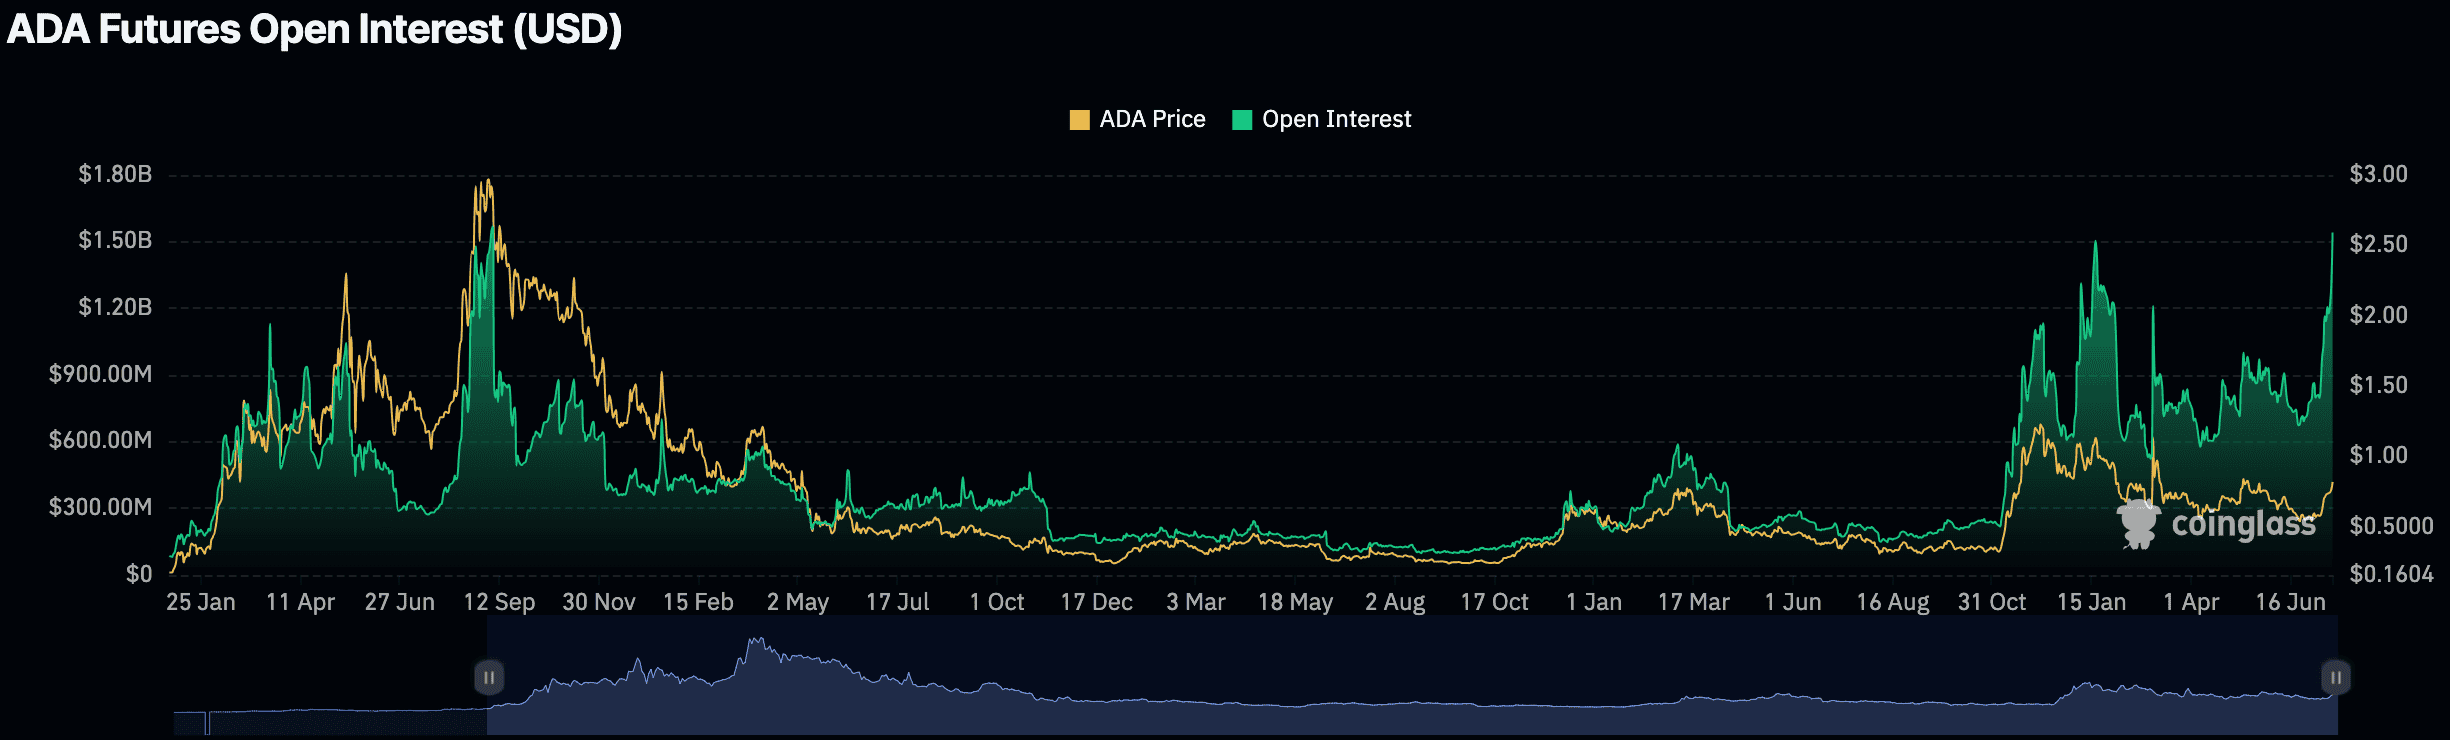
Open Interest reflects capital tied to active trading positions. A steady rise often means traders are committing more capital, which can support ongoing moves. This increase adds weight to the recent price trend.
In fact, with ADA reclaiming the $0.80 range and testing $0.85, traders are focused on whether it can close the day above that level.
Binance Free $600 (CryptoPotato Exclusive): Use this link to register a new account and receive $600 exclusive welcome offer on Binance (full details).
LIMITED OFFER for CryptoPotato readers at Bybit: Use this link to register and open a $500 FREE position on any coin!

 Forex3 years ago
Forex Today: the dollar is gaining strength amid gloomy sentiment at the start of the Fed’s week
- Forex3 years ago
Unbiased review of Pocket Option broker
- Forex3 years ago
Dollar to pound sterling exchange rate today: Pound plummeted to its lowest since 1985
- Forex3 years ago
How is the Australian dollar doing today?
- Cryptocurrency3 years ago
What happened in the crypto market – current events today
- World3 years ago
Why are modern video games an art form?
- Commodities3 years ago
Copper continues to fall in price on expectations of lower demand in China
- Economy3 years ago
Crude oil tankers double in price due to EU anti-Russian sanctions


