Cryptocurrency
Bitcoin price prediction – “Will Bitcoin go back to the low”? Why the asset risks falling in price again
Experts explain what’s causing the rise in Bitcoin prices today and what events may affect the market soon. On July 29, Bitcoin reached a 1.5-month high of $24.4 thousand; its price went up by 5% per day, and by more than 26% over the month. Ethereum price rose to $1.77 thousand, showing a monthly increase of 70%. Current Bitcoin price is around $23,650.
Bitcoin price prediction
The largest altcoins by capitalization are also rising in price, and the total estimate of the cryptocurrency market exceeded $1.41 trillion, while a month ago it was $946 billion.
The rise in cryptocurrency prices accelerated on the evening of July 27, when the Federal Reserve announced a 75 basis point rate hike. Also, the appearance of precise dates for Ethereum’s transition to the Proof-of-Stake protocol had a positive impact on some token prices.
What factors are affecting the crypto-market at the moment, and what may be the dynamics of rates soon?
Downward pressure
The main reason for the growth of the CFA market in recent days is fundamental pressure on the market by the U.S. Federal Reserve. Tightening of the monetary policy occurs softly, without dramatic raises of rates over the forecasts.
Decreased pressure of authorities together with low rate of taper (gradual reduction of economic stimulation by central banks) allows cryptocurrency investors to increase volume of purchases without fear of price fall because of actions of regulators.
In the case of a positive scenario, Bitcoin may test the $30,000 level. The current volume of purchases and activity in the networks will not allow the price to grow significantly. As we remember, Bitcoin prices all-time high in 2021. Before we see the market rise to historic highs, the price could still fall this year. Therefore, I recommend buying cryptocurrency at current prices with an eye on the fact that there is a possibility of a price correction after the rise.
Intermediate Bottom
The corrective channel that started with the lowest prices in June emerged as an intermediate stop before further declines. This was confirmed by the price exiting through the upper boundary and returning back. Quotes were already moving to the lower boundary, but the situation became more complicated. Now there was another exit over the upper boundary, but it happened in the absence of the necessary conditions for growth.
The ascending wedge on the Bitcoin price chart, which indicates a limited upside potential. The price is on top, which does not allow an upward movement to develop. Globally, the situation has not changed, but further downward hikes will be possible already in the new formation.
The current price impulse has occurred without any serious reason, and soon nothing special is expected. Negative influence can be made by such factors as investigations concerning Coinbase or legislative decisions on stablecoins in the USA.
But the impact of external factors should not be overestimated, because the crypto market only matters supply and demand, not reporting, like the stock market, the expert said. He suggested that the increase in rates could simply contribute to large purchases in a situation of reduced liquidity.
Bitcoin prices by the end of 2022: Downside risks exist
In the coming weeks, the main focus of market players is on Ethereum’s transition to the PoS version, which will make adjustments to the activities of miners and investors around the world. The overall outlook for Ethereum is assessed positively. But the current growth in the value of ETH will probably not be unstoppable: there are risks of falling prices amid the problems of ETH 2.0.
Market participants are upbeat now, despite the recession risks in the US. The U.S. inflation data, which will be released in mid-August, will be slightly better than forecasts, and this will entail a positive reaction of the economy to the Fed’s actions. These events will cause stock markets to rise, which will also support crypto-asset prices.
If inflation data turns out to be bad, it will cause a flight out of risky assets, a drop in stock markets and an expectation of tougher Fed action. This is what could momentarily put pressure on cryptocurrency, causing prices to return to their sideways rally without a surge.
Now the main task of sellers is to prevent the enthusiasts, who bought Bitcoin at the exit of the channel for the first time (in mid-July), from making money. This means a possible movement downwards and fixing of stop-orders at $21K. After that, the support level will be broken and the rate will go down: at first, towards $19K and then to the local minimum of $17.5K. Well, the price growth up to $100K is rather Bitcoin price prediction 2025.


Standard Chartered has become the first internationally recognized financial heavyweight to launch direct spot trading for Bitcoin and Ethereum.
The offering positions the UK-based institution at the forefront of regulated digital asset integration within traditional finance.
Launch Mechanics and Client Access
According to reports, the new service will allow institutional clients, including asset managers, corporations, and large investors, to trade BTC and ETH directly using FX trading interfaces established by the bank.
Standard Chartered stressed that the trades are “deliverable,” meaning that customers will receive actual crypto assets upon settlement rather than mere exposure via derivatives. Additionally, users can choose their own custodian, including Standard Chartered’s in-house service.
At first, the offering will be available during Asian and European trading hours, with potential demand determining whether there will be 24/5 access in the future.
The bank also plans to introduce non-deliverable forwards (NDFs) trading for the two largest crypto assets by market cap. This will further expand risk management tools amid growing institutional appetite for digital assets.
Traditional banks are under increasing pressure to bridge the gap between legacy finance and crypto infrastructure, and Standard Chartered hopes to eliminate a major point of friction for institutional players who were previously forced to navigate a fragmented and often unregulated crypto sector.
A Broader Crypto Strategy
The UK spot trading launch is just one piece of Standard Chartered’s growing arsenal of digital asset solutions. At the beginning of the year, the bank established a dedicated Luxembourg entity to offer regulated crypto custody services within the EU.
Around the same time, it also dipped its feet into stablecoins and tokenization, partnering with Animoca Brands and HKT to develop a Hong Kong dollar-pegged stablecoin.
Compteitors like JPMorgan and Goldman Sachs have taken a more conservative approach to direct crypto spot trading, with Nate Geraci, co-founder of The ETF Institute, decrying this cautious stance.
Recently, while referencing Vanguard, another heavyweight player in the financial management space, he suggested that the refusal by such institutions to offer crypto products could alienate investors seeking exposure to such assets.
“What Vanguard is missing (*huge* miss IMO)…” Geraci posted. “Is there are tons of investors who love Vanguard’s low cost approach to stock & bond investing AND they want to own some btc & crypto.”
Meanwhile, Standard Chartered Group CEO Bill Winters has consistently stated that “digital assets are here to stay.” The company’s aggressive positioning grants it an early-mover advantage in a market where deep-pocketed investors are increasingly demanding secure, compliant crypto exposure amid a shifting regulatory environment and rising BTC adoption.
Binance Free $600 (CryptoPotato Exclusive): Use this link to register a new account and receive $600 exclusive welcome offer on Binance (full details).
LIMITED OFFER for CryptoPotato readers at Bybit: Use this link to register and open a $500 FREE position on any coin!

TL;DR
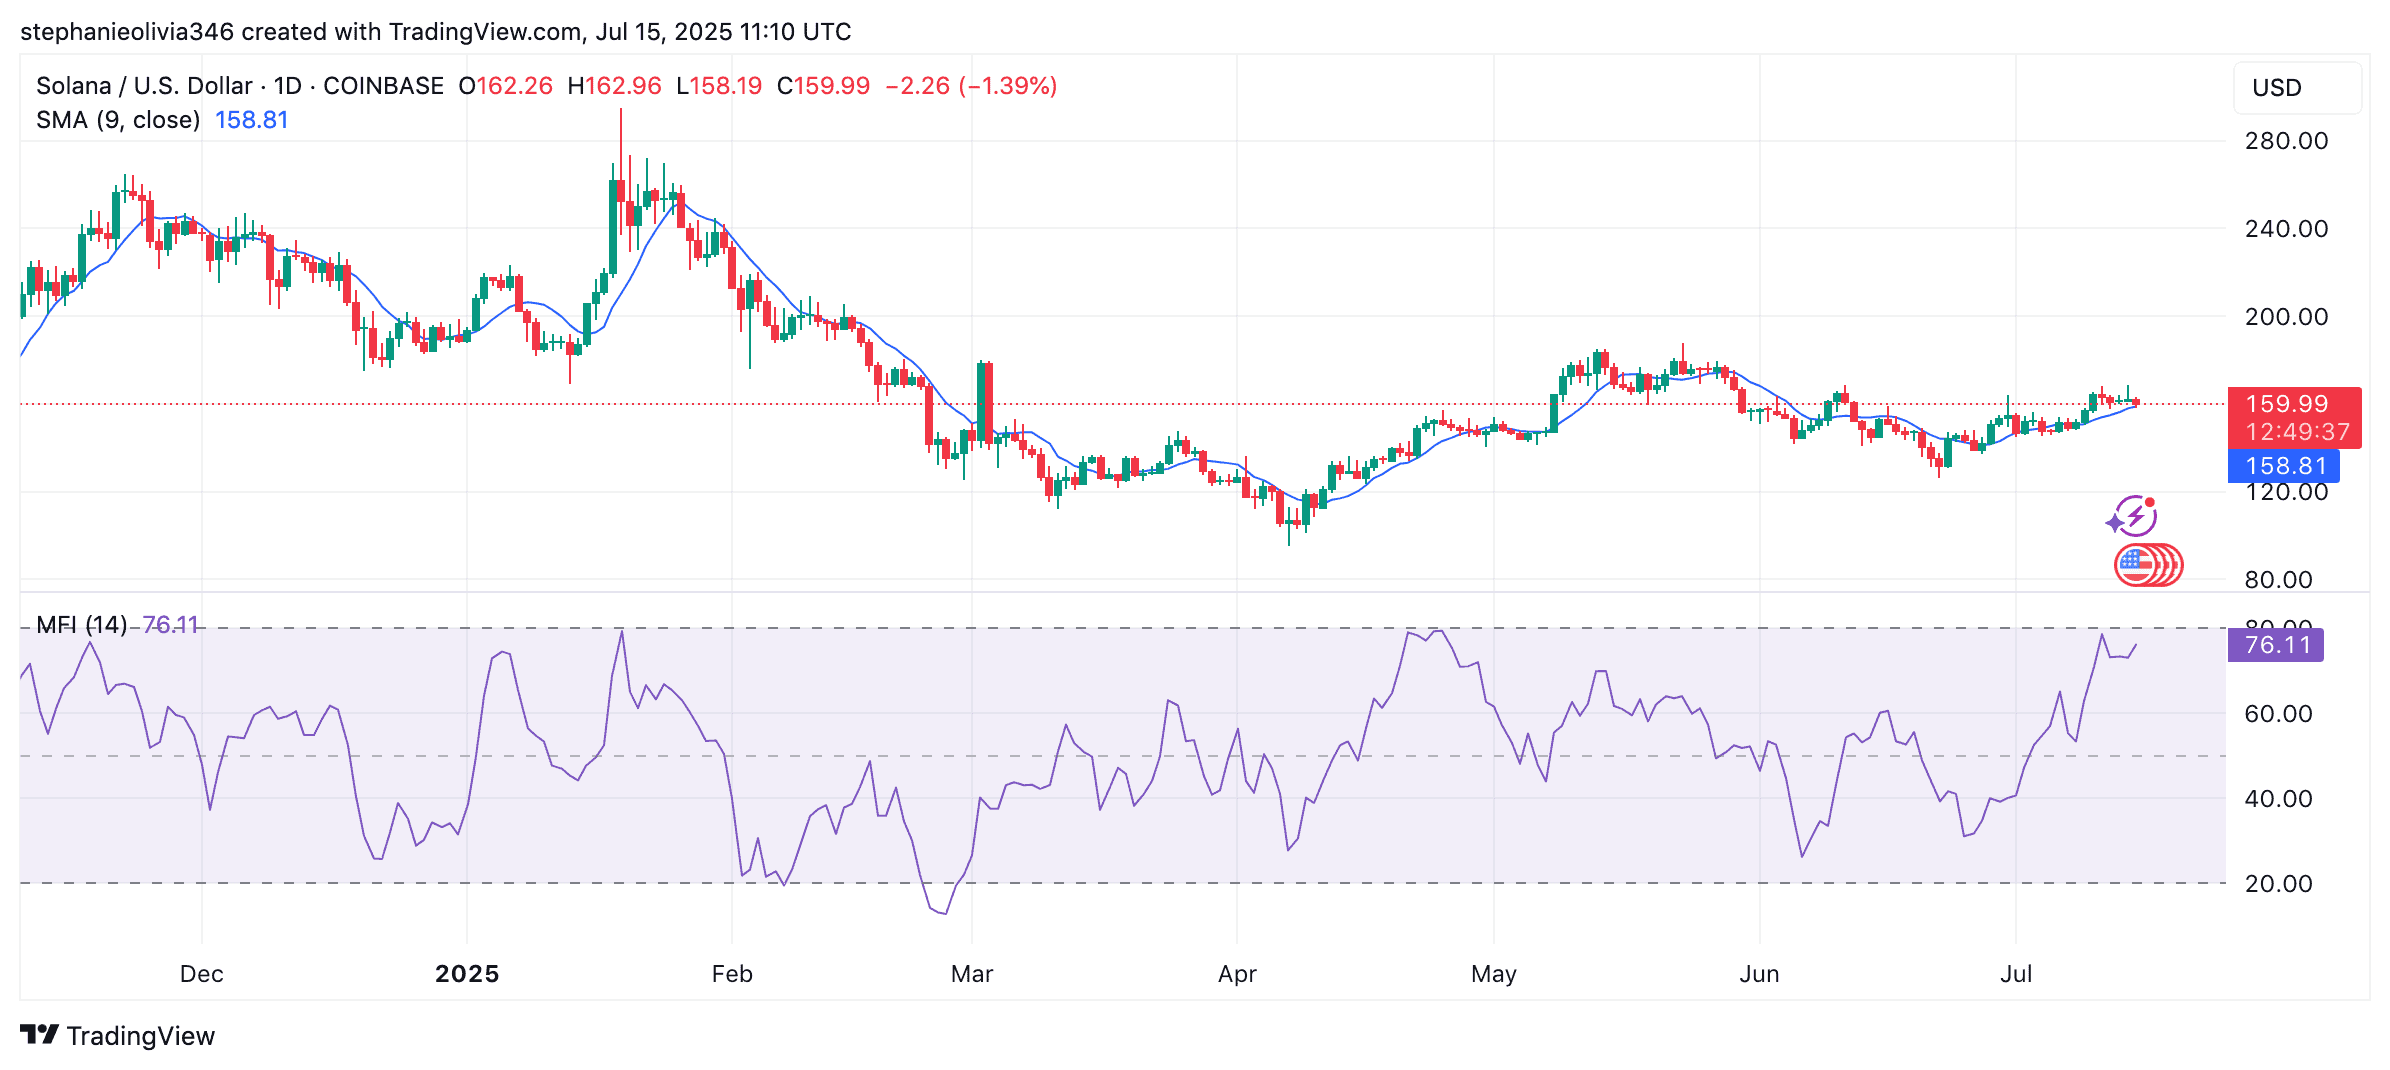
- Solana breaks above $166 Fibonacci level, with bulls eyeing targets at $171, $179, and $185.
- SOL trades above 9-day SMA, while MFI at 76 signals strong inflows but potential exhaustion.
- SEC ETF reviews add momentum to Solana’s ongoing upward price action.
SOL Chart Points to Bullish Target
Solana (SOL) has broken out of an ascending triangle. The price cleared the $166 mark, which is the 1.272 Fibonacci level. Traders now watch for the next levels at $171, $179, and $185. The structure shows rising lows and growing volume, which supports the move.
“This could be the cleanest breakout I’ve seen all month,” said analyst Ali on X.
If buyers stay in control, the $185 level may be next. But traders also watch for pullbacks, especially as prices move higher into resistance zones.
This could be the cleanest breakout I’ve seen all month! pic.twitter.com/FGWTYaOqDg
— Ali (@ali_charts) July 15, 2025
SMA and MFI Indicate Bullish Momentum
Solana trades above its 9-day simple moving average, which now sits at $158. This shows that buyers are still active. The slope of the line is pointing up, which supports the current direction.
At the same time, the Money Flow Index is at 76.16, which is close to the overbought line. This reading shows that funds have flowed in fast. But it also warns of possible profit-taking or price pauses near this level.
Network Use and ETF Talk Support Momentum
As CryptoPotato reported, the number of active users on Solana’s network has recently ticked up. This rise in activity often helps price moves stay strong. The added use shows interest in Solana is growing.
Meanwhile, the SEC is now reviewing spot ETF filings tied to Solana. These efforts are said to be moving quickly. If approved, they may open more ways for funds to buy SOL directly.
Binance Free $600 (CryptoPotato Exclusive): Use this link to register a new account and receive $600 exclusive welcome offer on Binance (full details).
LIMITED OFFER for CryptoPotato readers at Bybit: Use this link to register and open a $500 FREE position on any coin!
Cryptocurrency
Large Bitcoin Investors Realize $1.54 Billion in Profits but Rally Still Intact: CryptoQuant
Bitcoin’s climb above the coveted $120,000 level was short-lived, as the cryptocurrency pulled back to below $117,000 amidst renewed volatility. Over the past 24 hours, it declined by over 4%.
On-chain signals reveal increased miner activity, which suggests short-term selling pressure.
Miners Cashing Out?
As the price approached new highs, the Miners’ Position Index (MPI) – which gauges the ratio of miner outflows to their one-year moving average – spiked to levels last seen during major sell-off periods. This means that some of them may have begun taking profits into strength, a pattern often seen when the MPI reading rises above 2, hinting at larger-than-usual Bitcoin outflows from miners to exchanges.
While such moves can introduce short-term selling pressure, CryptoQuant explained that historical patterns indicate they do not always derail broader bullish trends when demand from other investor cohorts remains strong.
At the same time, Binance, the world’s largest cryptocurrency exchange, recorded net inflows of nearly 6,000 BTC between July 12 and July 14. This activity reversed a period of predominantly neutral or negative netflows. The sudden influx alongside the recent price rally points to potential arbitrage activity, derivative hedging, or preparations for large-scale transactions rather than outright panic selling.
Considering all these factors together, the uptick in miner activity and increased exchange deposits mean that while some market participants are realizing gains, others may be positioning for continued price action.
Amid these miner outflows and Binance inflows, Glassnode recorded one of the year’s largest profit-taking days.
Bitcoin Logs One of Its Largest Profit-Taking Days
According to the blockchain intelligence platform’s findings, Bitcoin investors collectively realized $3.5 billion in profits over the past 24 hours.
This is one of the largest profit-taking days for BTC this year. Interestingly, long-term holders accounted for approximately $1.96 billion, or 56% of the realized gains, while short-term holders captured around $1.54 billion and accounted for the rest.
The significant wave of profit realization, led predominantly by long-term holders, demonstrated how seasoned investors are seizing the opportunity to lock in gains as Bitcoin hit a fresh peak while still allowing room for fresh capital to enter.
Binance Free $600 (CryptoPotato Exclusive): Use this link to register a new account and receive $600 exclusive welcome offer on Binance (full details).
LIMITED OFFER for CryptoPotato readers at Bybit: Use this link to register and open a $500 FREE position on any coin!

 Forex3 years ago
Forex Today: the dollar is gaining strength amid gloomy sentiment at the start of the Fed’s week
- Forex3 years ago
Unbiased review of Pocket Option broker
- Forex3 years ago
Dollar to pound sterling exchange rate today: Pound plummeted to its lowest since 1985
- Forex3 years ago
How is the Australian dollar doing today?
- Cryptocurrency3 years ago
What happened in the crypto market – current events today
- World3 years ago
Why are modern video games an art form?
- Commodities3 years ago
Copper continues to fall in price on expectations of lower demand in China
- Economy3 years ago
Crude oil tankers double in price due to EU anti-Russian sanctions


