Cryptocurrency
Coinbase: Speculators are responsible for cryptocurrency market decline

Analysts at Coinbase assure that long-term bitcoin holders hardly ever sell VTCs in the falling market.
Coinbase’s “Elusive Bottom,” a June report, said miners and companies forced to liquidate their positions to remain solvent amid a liquidity drain demonstrated: the industry is facing credit risks, not a crisis.
The number of bitcoin holders has dropped to 77%, although back in early 2022 the figure was 80%. The report also states that bitcoin has managed to show that it is a strong asset. The number of long-term holders was over 60%. This is even higher than at its peak in December 2017. The situation was not even affected by the high turbulence in the market. Coinbase says that centralized blockchain lenders (CeFi) increased their short-term debt at the peak of the bull trend.
“They were taking huge loans on DeFi protocols and shrinking capital to counterparties that were paying even higher interest rates. Some counterparties had duration mismatches and serious re-listing of assets on their books” provided to hedge funds and other entities,” the report said.
The report’s authors believe that the credit crunch was building up until a severe correction hit the market, reinforcing a kind of contagion effect that quickly spread through the market.
Compounding the ongoing credit crisis, listed miners, who had taken out huge loans secured against bitcoins or mining equipment during a bullish trend, were forced to sell their positions amid falling asset values. But since the top 28 publicly traded mining companies account for only 20% of Bitcoin’s hash rate, their sales don’t have a significant impact on trading volume.
Analysts at Glassnode argue that the massive drop in the market has led to a “flight of tourists and margin traders.”
Hoarders continue to accumulate bitcoins, and the pace has increased significantly over the past month. Small holders, who hold no more than 1 BTC in their wallets, have purchased nearly 60,500 BTC in a month. And this is “the most aggressive pace in history.”
Activity in the Bitcoin network has decreased noticeably – in November there were more than 1 million active addresses daily; now the figure is about 870,000. At the same time, if you count exactly the market participants – companies and holders with multiple wallets – their number even reaches 244,000 per day.
The number of daily transactions, meanwhile, remains at about the same level. On the one hand, it speaks about the lack of demand from new market participants. On the other hand – it shows the intention of long-term investors to keep coins further.


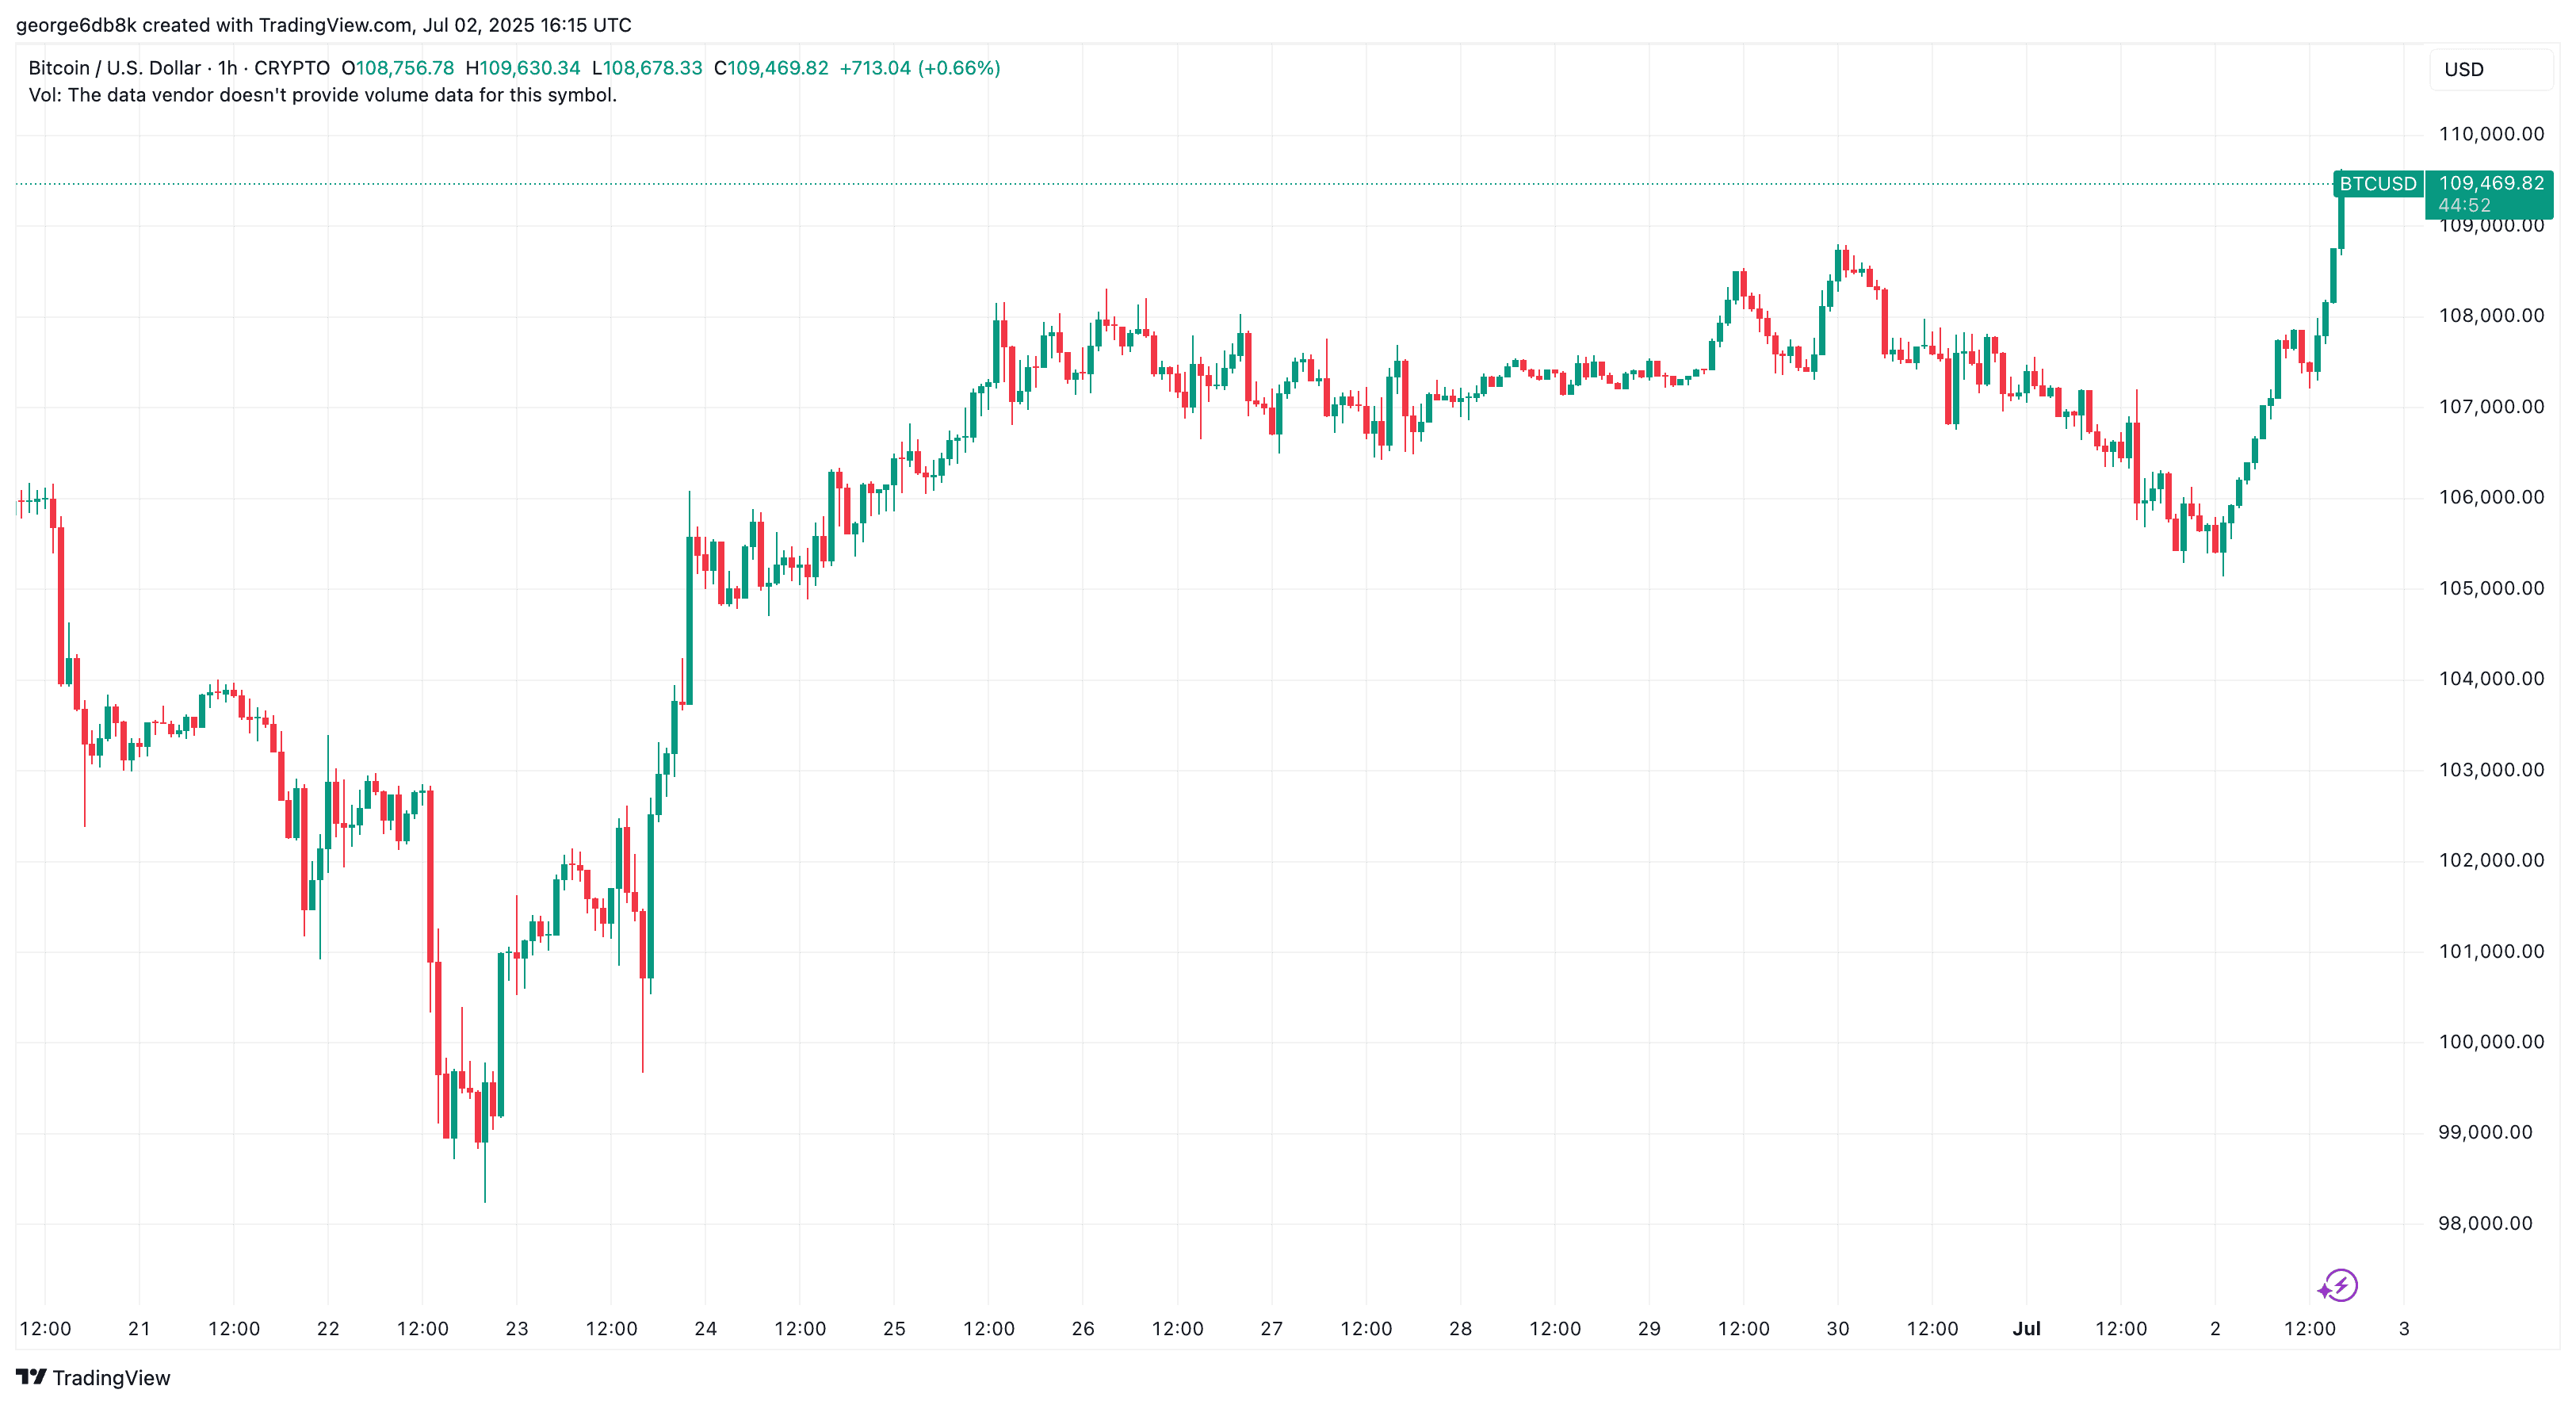
Bitcoin’s price has managed to completely erase the losses from yesterday and it appears that bulls are on the run again.
At the time of this writing, BTC is trading at around $109,500, preparing to test the pivotal technical and psychological level of $110K, sitting right below the cryptocurrency’s all-time high.
Data from Coinglass shows that the total number of liquidations across the derivatives market currently sits at almost $300 million – a 32% increase compared to the previous 24 hours.
BTC leads the way with around $50 million in liquidations, where the majority of positions were short. In total, $190M out of the $300 million in forced-closed traders were betting on the price to go down.
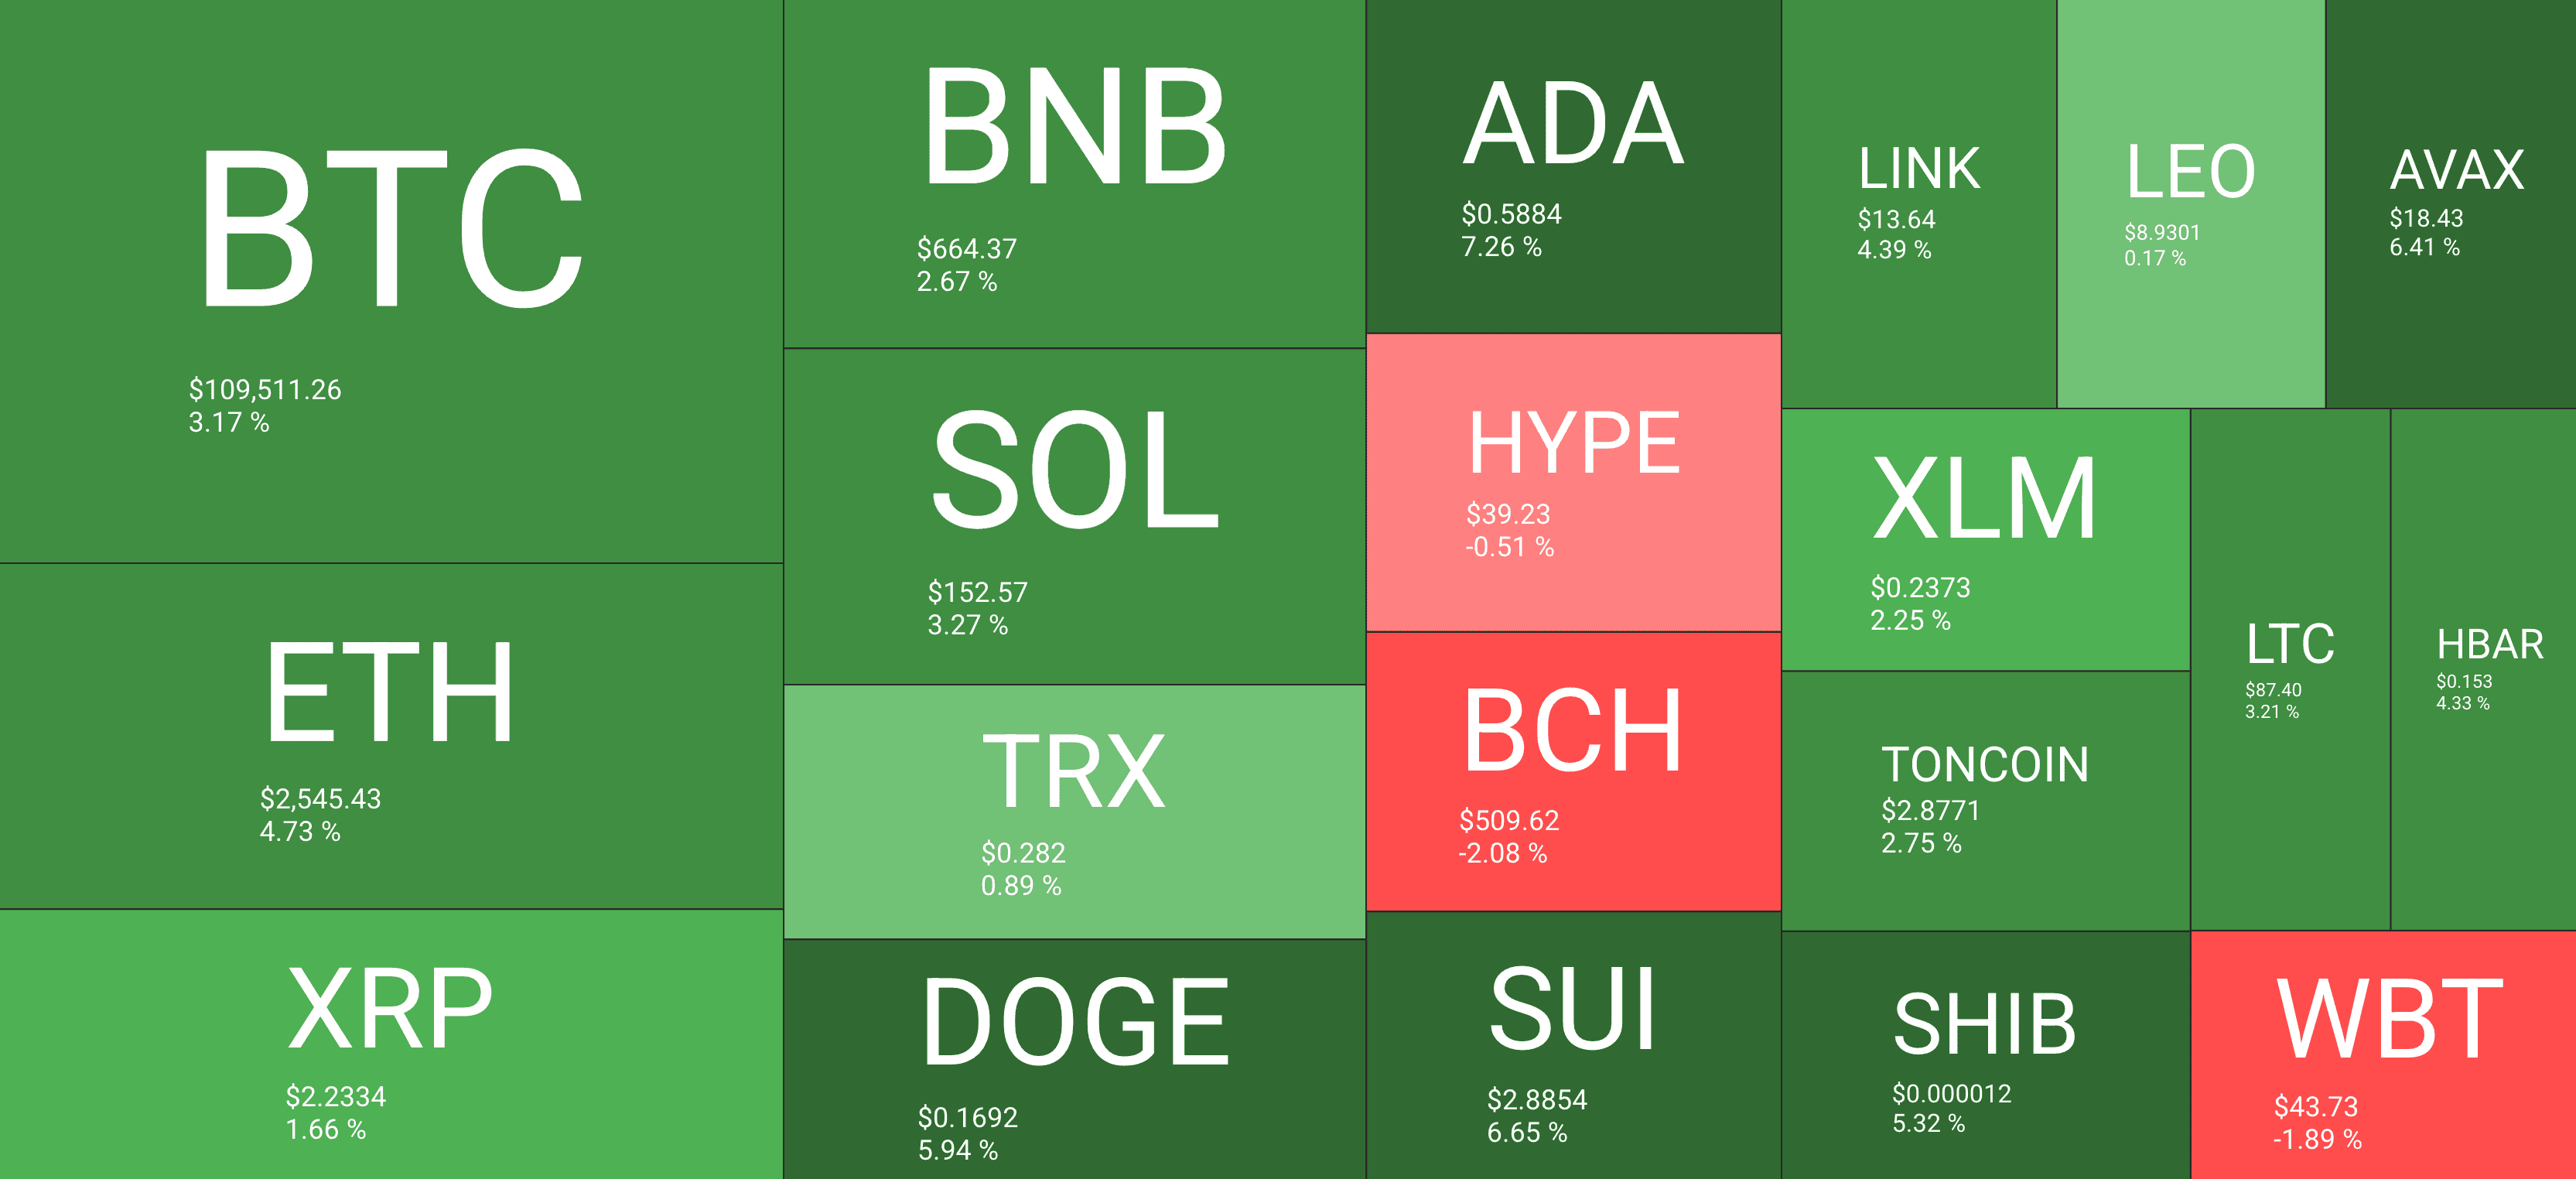
Naturally, the altcoins are following suite and are also recovering and most of them are now trading in the green. It’s interesting to see if this will transition into a more sustained upward movement in the next few days.
Binance Free $600 (CryptoPotato Exclusive): Use this link to register a new account and receive $600 exclusive welcome offer on Binance (full details).
LIMITED OFFER for CryptoPotato readers at Bybit: Use this link to register and open a $500 FREE position on any coin!

TL;DR
XRP’s recent dip comes alongside a drop in key on-chain metrics – like active accounts and executed transactions – hinting at declining user engagement and a potential short-term correction.
Despite the concerns, optimism remains high as Polymarket gives a 92% chance for a spot XRP ETF approval by end-2025, while negative exchange netflows suggest reduced immediate selling pressure.

Pullback on the Horizon?
Ripple’s XRP started July on the right foot, with its price rising to as high as $2.30. The uptrend, however, was short-lived, and it currently trades at around $2.17 (according to CoinGecko’s data).
Meanwhile, the decline of certain XRP metrics suggests the asset’s investors may have to endure a more substantial correction in the near future. Data shows that the number of active accounts, the number of executed transactions, and the number of newly activated accounts have headed south in the past few days.
This development points to reduced user engagement and utility in XRP’s ecosystem, which may lead to price stagnation or even a pullback.
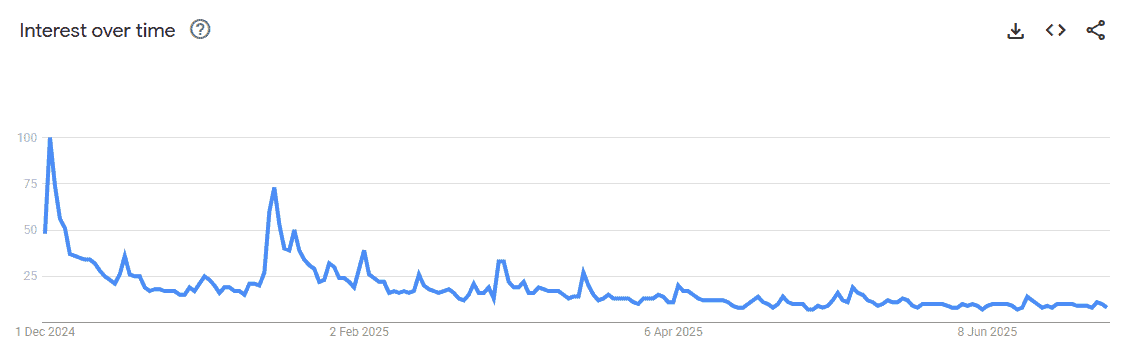
Interest in Ripple’s cross-border token has also waned over the past several months. Google searches involving the asset are currently far below the peak levels registered in December last year. This could mean that fewer new buyers are entering the market.
The Bullish Signals
Every coin has two sides, so let’s also observe the factors that suggest Ripple’s native token might be on the verge of a renewed rally.
To begin with, XRP investors could gain significantly if a spot ETF receives regulatory approval in the United States. A growing list of major firms – such as Grayscale, Bitwise, Franklin Templeton, 21Shares, and others – have already expressed interest in launching such a product.”
According to Polymarket, there’s a 92% chance that a spot XRP ETF will be greenlighted in America before the end of 2025.
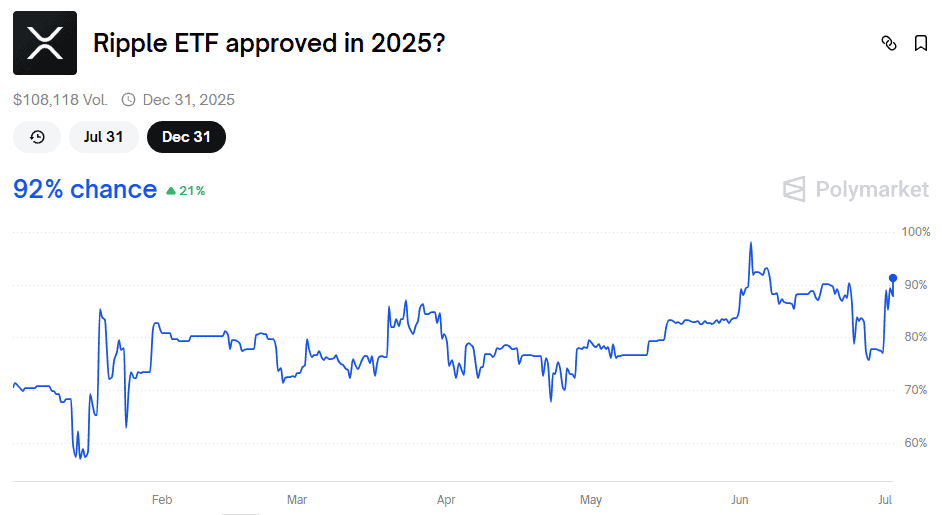
The surge in odds follows the SEC’s recent approval of Grayscale’s request to convert its Digital Large Cap Fund (GDLC) into a spot ETF – a fund that holds multiple cryptocurrencies, including XRP.
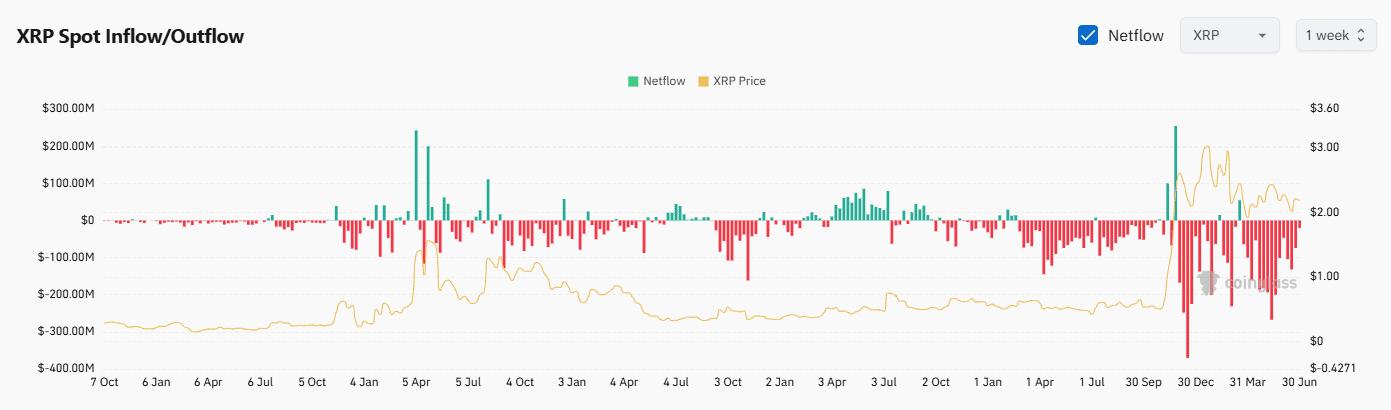
Next on the list is XRP’s exchange netflow, which has been predominantly negative in the last several weeks. This indicates that investors have switched from centralized platforms toward self-custody methods, reflecting a reduced immediate selling pressure.
Binance Free $600 (CryptoPotato Exclusive): Use this link to register a new account and receive $600 exclusive welcome offer on Binance (full details).
LIMITED OFFER for CryptoPotato readers at Bybit: Use this link to register and open a $500 FREE position on any coin!
About a month ago, market analysts noted that profit-taking on the Bitcoin network was modest. However, that has changed.
The on-chain insights provider Glassnode has revealed that profit-taking on the leading digital network is ramping up again. This comes as Bitcoin (BTC) remains in a consolidation phase following weeks of upward movement.
BTC Holders Take Profits
According to Glassnode’s tweet, bitcoin’s realized profits hit $2.46 billion on June 30, while the network’s seven-day Simple Moving Average (SMA) spiked to $1.52 billion.
The SMA, which identifies trends by averaging prices over a specific period, is currently above its year-to-date (YTD) average of $1.14 billion. However, the metric is still below its November-December 2024 peak of approximately $4.5 billion.
The spike in Bitcoin’s seven-day SMA indicates that coin distribution on the network is on the rise. Mid-to-long-term BTC holders have been leading this profit-taking spree; Glassnode said investors aged three to five years have realized at least $849 million in profits. This cohort of market participants is followed by those aged seven to ten years, with $485 million in profits, and investors aged one to two years with $445 million.
Short-term BTC holders, those holding for under one year, have been cashing out the least gains, at less than $6 million.
Interestingly, older BTC holders have been leading the profit-taking for this cycle. CryptoPotato reported a rise in spending by this cohort in late May, which drove the aggregate volume for the one- to five-year cohorts to $4 billion, its highest level since February. While older investors take the lead, the bulk of the volume is coming from this particular group of Bitcoin holders.
Whales Are Redistributing Too
Glassnode’s latest report is further substantiated by an analysis from the institutional decentralized finance (DeFi) analytics platform, Sentora (previously known as IntoTheBlock).
The firm disclosed that wallets holding more than 1,000 BTC have been steadily reducing their balances. This indicates that although institutional money is flowing into Bitcoin, whales are still offloading their holdings.
It is worth mentioning that Sentora sees the redistribution by whales as a sign of a maturing market rather than weakness. Older whale coins being dispersed could become a dynamic that would strengthen Bitcoin’s long-term potential.
Meanwhile, BTC was still consolidating at the time of writing, hovering under $110,000 – a level, which it has remained confined to in the last few weeks.
Binance Free $600 (CryptoPotato Exclusive): Use this link to register a new account and receive $600 exclusive welcome offer on Binance (full details).
LIMITED OFFER for CryptoPotato readers at Bybit: Use this link to register and open a $500 FREE position on any coin!

 Forex3 years ago
Forex Today: the dollar is gaining strength amid gloomy sentiment at the start of the Fed’s week
- Forex3 years ago
Unbiased review of Pocket Option broker
- Forex3 years ago
Dollar to pound sterling exchange rate today: Pound plummeted to its lowest since 1985
- Forex3 years ago
How is the Australian dollar doing today?
- Cryptocurrency3 years ago
What happened in the crypto market – current events today
- World3 years ago
Why are modern video games an art form?
- Commodities3 years ago
Copper continues to fall in price on expectations of lower demand in China
- Economy3 years ago
Crude oil tankers double in price due to EU anti-Russian sanctions


