Cryptocurrency
Crypto Winners from Trump Victory: Bitcoin, Solana, FreeDum Fighters
The crypto market is always primed for action, but important political events kick things up a notch.
With Trump now confirmed as the next US president, certain coins are already seeing big price jumps.
Bitcoin, Solana, and FreeDum Fighters are three standouts – all rallying in the past day.
Bitcoin Smashes All-Time High as Trump Victory Signals New Crypto Era
Bitcoin’s surge past $75,000 came just as the election results began to roll in.
This new all-time high has been widely linked to Trump’s presidential win.
Though Bitcoin’s price has now settled around $73,900, the mood remains strongly bullish – a clear shift from the struggles of last week.
Trump’s campaign promises, including plans for a national BTC reserve and a new SEC chair, seem to have resonated with traders.
And that has pushed trading volumes through the roof.
Dennis Porter, co-founder of the Satoshi Action Fund, was blunt about the impact of Trump’s win.
He said that the “anti-Bitcoin movement” in the US is essentially over.
Let’s be absolutely clear, the anti-Bitcoin movement died last night. The USA will be the most pro-Bitcoin nation in the world. We will have a Bitcoin Strategic Reserve. We will enshrine a national law to defend Bitcoin Rights.
— Dennis Porter (@Dennis_Porter_) November 6, 2024
For crypto traders who have navigated years of regulatory pressure, Trump’s pro-crypto approach feels like a refreshing change.
It suggests that the US might soon become the “crypto capital” of the world, as he promised.
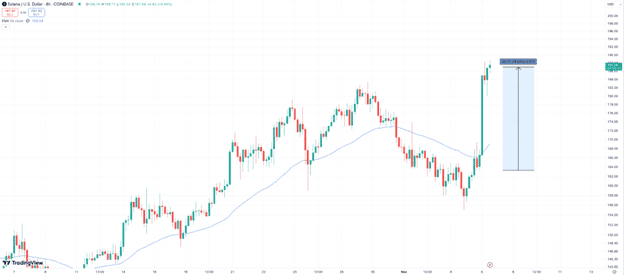
Solana Flips BNB as Trump Win Boosts Spot ETF Hopes
Solana is proving to be another big winner in the post-election rally.
SOL has jumped to $187 and overtaken Binance Coin to secure its spot as the fourth-largest cryptocurrency by market cap.
This 14% surge isn’t just due to random volatility.
It’s a sign of the growing optimism that a spot SOL ETF could finally get approved under the Trump administration.
Trading volumes reflect this optimism, with SOL activity spiking 220% to over $9 billion in the past day.
Analysts are already revising their forecasts, with some even hinting that SOL could rival Ethereum.
Syncracy Capital’s Daniel Cheung thinks the market still hasn’t grasped the potential impact of today’s Trump win.
He believes an ETF approval in early 2025 could push SOL towards $1,000.
His enthusiasm stems from Trump’s pro-crypto outlook and the belief that his administration might take a more relaxed stance on token classification.
Plus, with ETF applications from VanEck and 21Shares already live, the path to approval now seems closer than ever.
And that’s causing the SOL price to soar.
PolitiFi Meme Coin FreeDum Fighters Soars as High-APY Staking App Attracts Investors
Alongside Bitcoin and Solana, another winner in the post-election crypto market is FreeDum Fighters.
FreeDum Fighters is a meme coin that’s tapping into the political buzz with its tongue-in-cheek features.
The project’s presale has raised over $440,000 as investors pile in due to its mix of political parody and passive rewards potential.
This latter aspect is particularly interesting.

FreeDum Fighters has a staking system featuring two fictional characters – MAGATRON and Kamacop 9000 – designed as playful nods to the election’s leading players.
Investors can stake DUM tokens to “back” either of these candidates.
And by doing so, they’ll earn even more DUM tokens in return.
On top of that, FreeDum Fighters will also host weekly debates on social media, with supporters of the winning side earning extra DUM.
It’s a setup that’s been a hit due to the political energy in the market right now.
With Trump’s victory, members of FreeDum Fighters’ Telegram channel believe the project might see even more interest.
Crypto influencer ClayBro believes that will be the case.
He recently suggested that FreeDum Fighters could send politically themed tokens “to the next level.”
Fellow influencer Jacob Bury even predicted the DUM token might pump.
All in all, with Trump back in the White House and the crypto market on fire, FreeDum Fighters seems like it could be on track for an explosive debut.
Visit FreeDum Fighters Presale
Disclaimer: The above article is sponsored content; it’s written by a third party. CryptoPotato doesn’t endorse or assume responsibility for the content, advertising, products, quality, accuracy, or other materials on this page. Nothing in it should be construed as financial advice. Readers are strongly advised to verify the information independently and carefully before engaging with any company or project mentioned and do their own research. Investing in cryptocurrencies carries a risk of capital loss, and readers are also advised to consult a professional before making any decisions that may or may not be based on the above-sponsored content.
Readers are also advised to read CryptoPotato’s full disclaimer.
Binance Free $600 (CryptoPotato Exclusive): Use this link to register a new account and receive $600 exclusive welcome offer on Binance (full details).
LIMITED OFFER 2024 at BYDFi Exchange: Up to $2,888 welcome reward, use this link to register and open a 100 USDT-M position for free!


Cryptocurrency
Gate Launches xStocks Trading Section, Bridging Crypto Finance and Global Capital Markets
[PRESS RELEASE – Panama City, Panama, July 3rd, 2025]
In July 2025, Gate, a global leading digital asset trading platform, officially launched its xStocks trading section, covering both spot and futures markets. The initial listings include 8 popular tokenized stocks, such as COINX, NVDAX, CRCLX, AAPLX, METAX, HOODX, TSLAX, and GOOGLX, enabling global users to trade tokenized stocks directly with crypto assets like USDT. Gate Alpha has also rolled out support for xStocks, listing MSTRx, CRCLx, SPYx, NVDAx, TSLAx, and AAPLx, further expanding users’ access to on-chain assets and strategic trading options.
This initiative not only diversifies investment channels for crypto users but also marks a new phase in the convergence of crypto finance and traditional markets. Gate is now the first platform to launch a futures market for tokenized stocks, establishing a fully closed-loop trading infrastructure at the intersection of digital and traditional finance.
Removing Barriers: Connecting Global Users to Wall Street
Gate’s xStocks trading section adopts a compliant, asset-backed tokenization model. All tokens are fully collateralized and represent publicly traded U.S. stocks. These tokens are freely transferable and compatible across multiple blockchains and ecosystems.
Unlike traditional brokers that require regional accounts, complex KYC, and fiat settlement, Gate’s tokenized stocks services are globally accessible and require no KYC, allowing users to invest using USDT and other crypto assets. This borderless trading model significantly lowers entry barriers for global participants, offering a seamless path for cross-border capital movement and global portfolio allocation.
The platform also supports 24/7 trading, fractional investment, and on-chain liquidity, breaking down traditional time and regulatory constraints, and delivering a highly flexible, decentralized investment experience that links TradFi and DeFi.
World-First Futures Market for Tokenized Stocks, Redefining Derivatives Boundaries
As the first platform globally to launch the futures market for tokenized stocks, Gate enables users to apply leverage and execute two-way strategies on U.S. stocks, all under a USDT pricing system, empowering more dynamic risk and return management.
The trading infrastructure has been fully optimized for this launch, with upgrades to matching engines, pricing models, and risk control systems. Tailored to the liquidity profiles of U.S. stocks and the behavioral patterns of crypto-native traders, the system delivers high responsiveness, strong compatibility, and robust user experience across both spot and futures markets.
A Strategic Leap Toward the Next-Generation Crypto Exchange
Gate’s expansion into tokenized stocks represents a key milestone in its long-term strategy of bridging traditional and future finance. By building crypto-native infrastructure for traditional assets, Gate is redefining how users access and interact with global capital markets.
Dr. Han, Founder and CEO of Gate, stated: “Our mission isn’t just to add a new asset class, but to transform the relationship between users and assets. We aim to create a truly global, borderless investment platform that empowers everyone to access financial opportunities worldwide.”
In 2025, Gate completed a major brand upgrade and transitioned to the unified domain Gate.com, marking a new chapter in its global strategy. The platform currently ranks Top 2 globally in spot trading volume, with continued strength in derivatives, liquidity depth, and user activity, reinforcing its position as a leader in global crypto financial infrastructure.
As the digital transformation of global finance accelerates, Gate’s launch of tokenized stocks offers a model for the industry and demonstrates a pioneering approach to integrating decentralized infrastructure with traditional capital markets, propelling the platform toward its vision as the next-generation crypto exchange.
About Gate
Gate, founded in 2013 by Dr. Han, is one of the world’s earliest cryptocurrency exchanges. The platform serves over 30 million users with 3,600+ digital assets and pioneered the industry’s first 100% proof-of-reserves. Beyond core trading services, Gate’s ecosystem includes Gate Wallet, Gate Ventures, and other innovative solutions, while its global partnerships extend to top-tier sports brands like Oracle Red Bull Racing in F1 and Inter.
For more information, users can visit: Website | X | Telegram | LinkedIn | Instagram | YouTube
Disclaimer:
This content does not constitute an offer, solicitation, or recommendation. You should always seek independent professional advice before making investment decisions. Gate may restrict or prohibit certain services in specific jurisdictions. For more information, users can read the User Agreement via https://www.gate.com/user-agreement.
Binance Free $600 (CryptoPotato Exclusive): Use this link to register a new account and receive $600 exclusive welcome offer on Binance (full details).
LIMITED OFFER for CryptoPotato readers at Bybit: Use this link to register and open a $500 FREE position on any coin!
Cryptocurrency
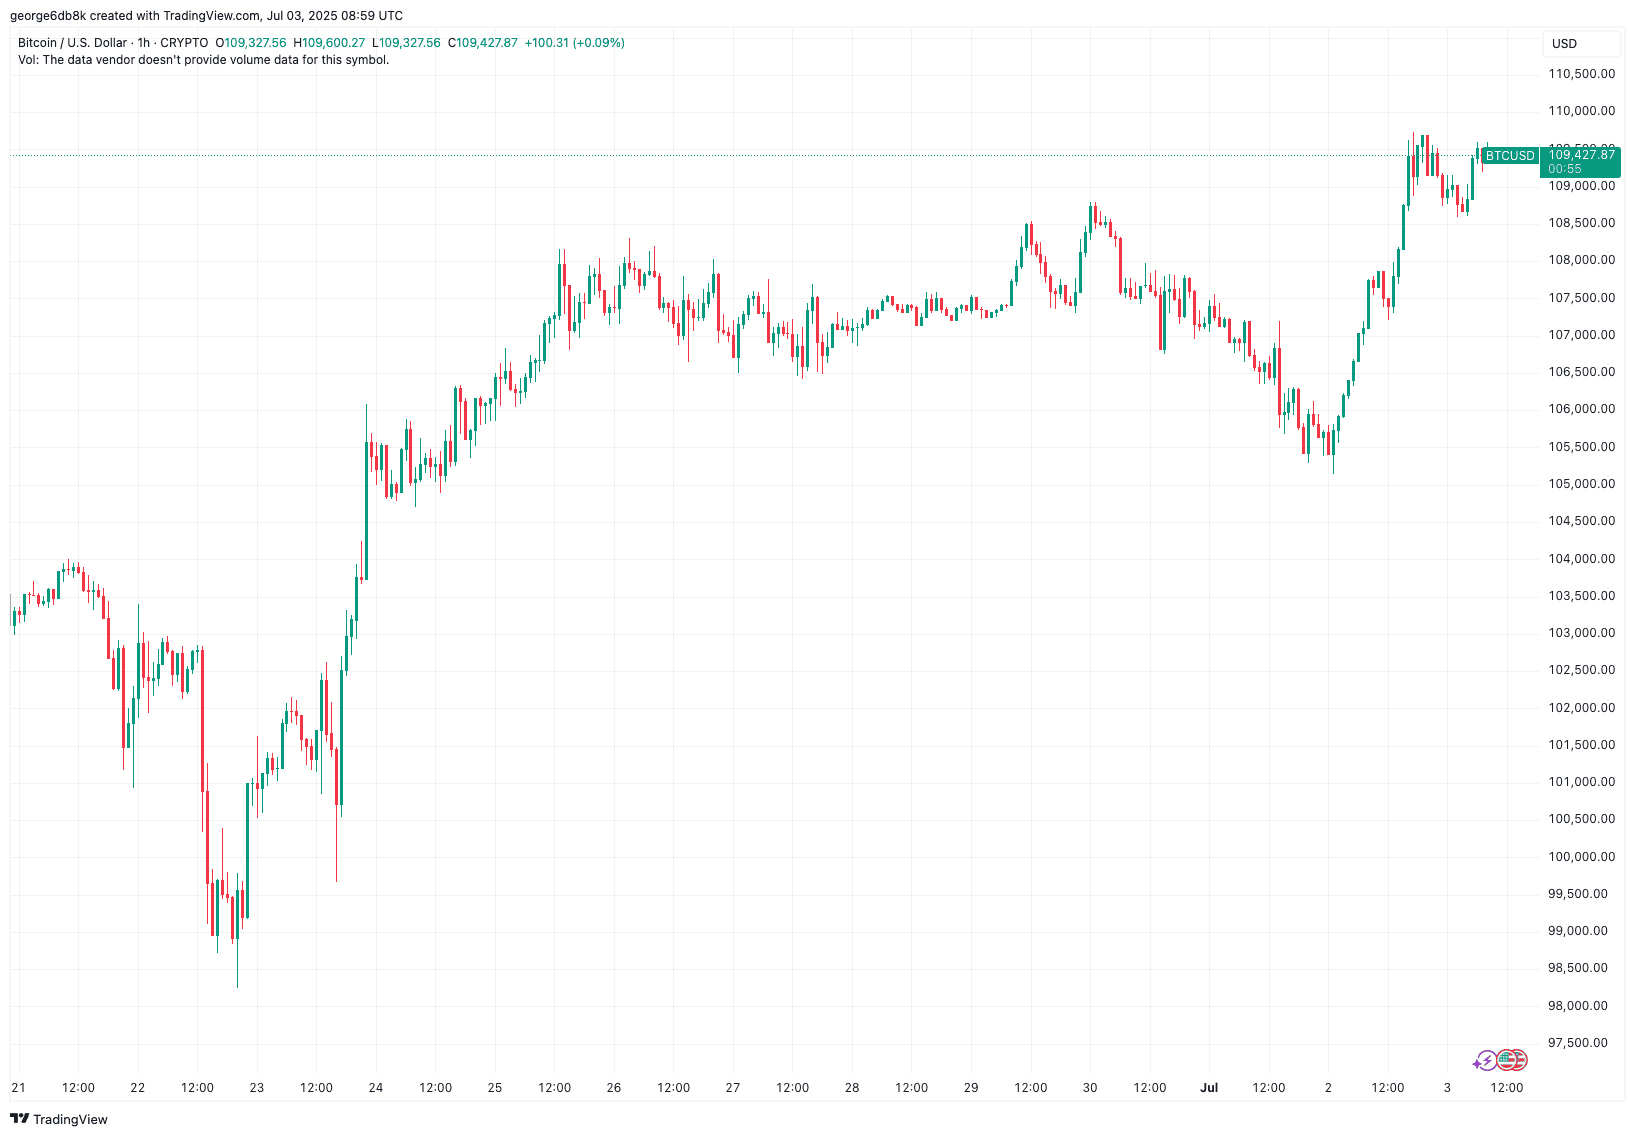
Bitcoin Price Shoots Toward $110K while Fartcoin and BONK Lead Meme Coin Gains: Market Watch
Bitcoin’s price is starting to heat up again, pushing towards the important $110,000 level and recording an increase of around 1.6% in the past 24 hours. This comes amid an even more impressive rally from certain meme coins such as Fartcoin and Bonk.
The total crypto market capitalization added around $50 billion during the day and is inching closer to $3.5 trillion. All of this happens as important regulatory changes are likely to take effect in the United States.
Bitcoin Price En Route to New All-Time Highs
At the time of this writing, BTC trades at around $109,500 which is around 2% below its all-time high achieved on May 22nd – about a month a go. And while we’re on the topic of statistics – the all-time low recorded on CoinGecko took place on July 6th 12 years ago. Since then, the cryptocurrency has returned the staggering 161,270% increase.
Anyways, back to the day-to-day news. BTC looks eager to take on its former highs and this is happening as the “One Big, Beautiful Bill” proposed by Donald Trump’s administration passed both Senate and the House votes in the past 24 hours.
It doesn’t include any direct crypto regulations, but it does intend to alleviate taxes on retail users and also introduce (or re-introduce, to be more precise) the so-called 100% bonus depreciation rule, which will allow Bitcoin mining companies to write off their equipment immediately, potentially allowing them to ramp up operations and increase the network’s hash rate, which has historically been bullish for the price.
In other BTC-related news, the BlackRock IBIT ETF, which tracks Bitcoin’s price, is now generating more fees than their legendary S&P 500 fund – a clear indication of the pent up demand and the fact that investors are willing to pay premium fees for exposure.
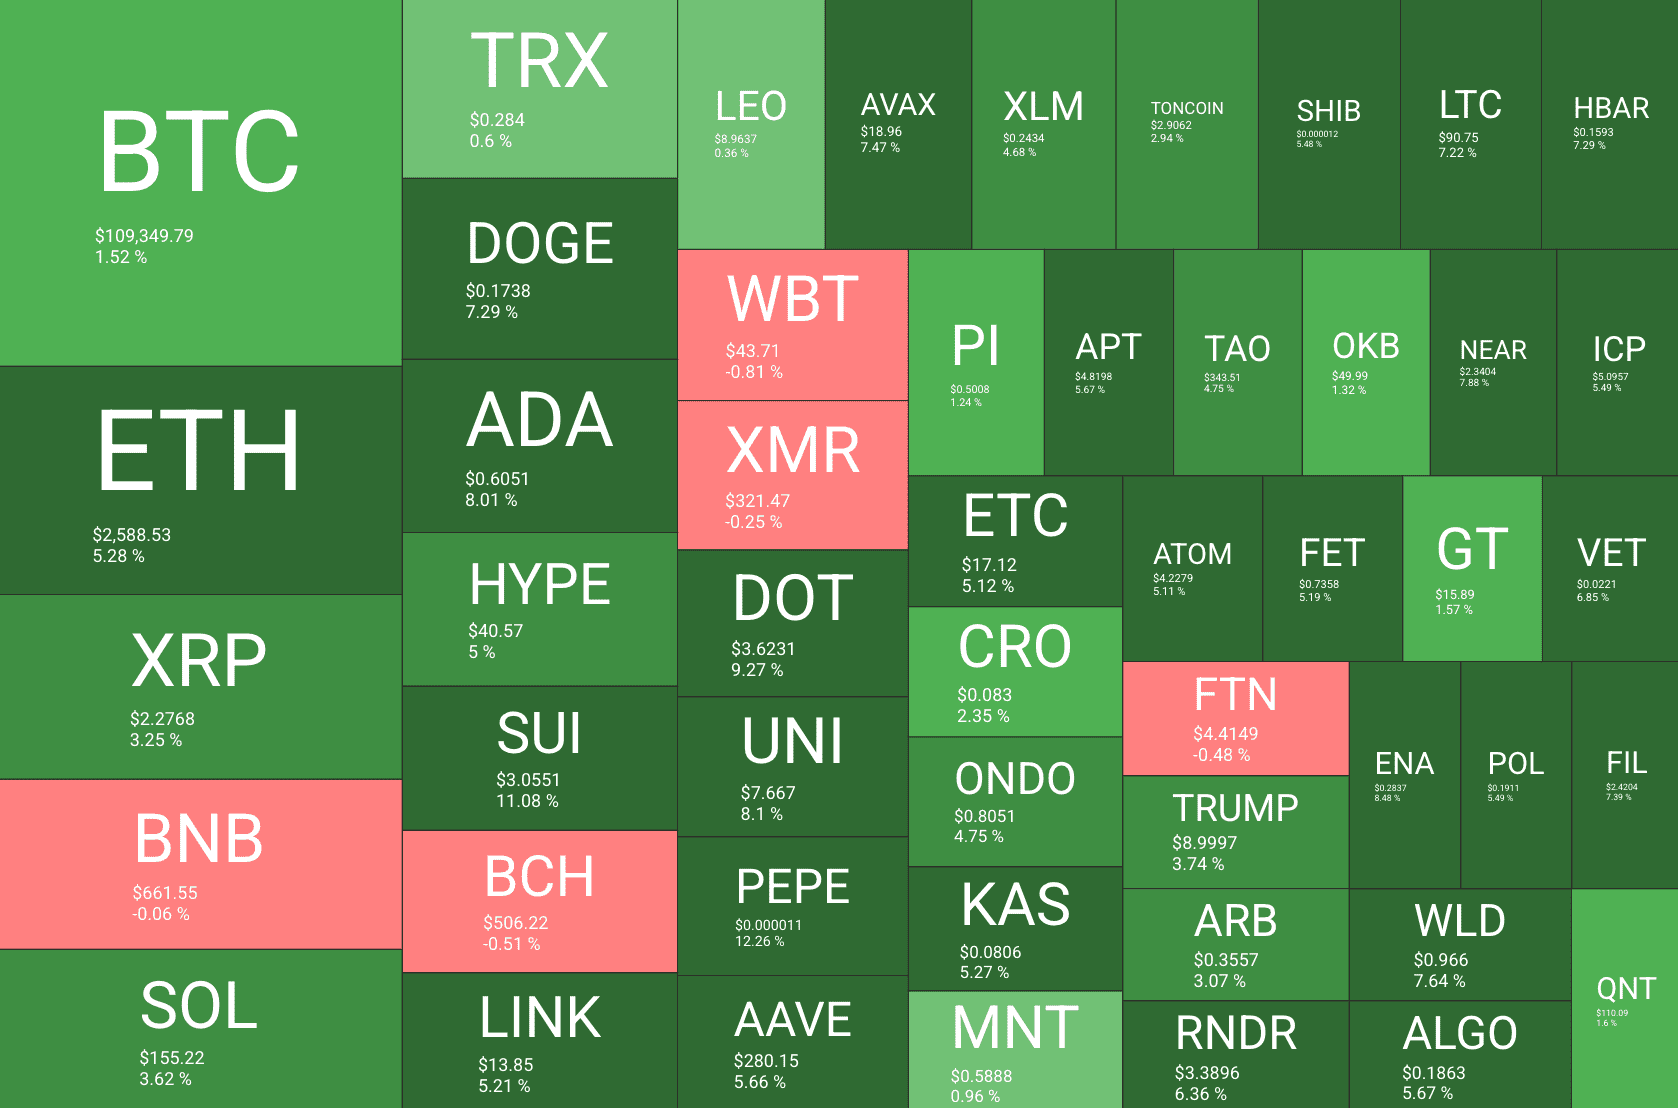
Fartcoin, Bonk Lead Meme Coin Gains
As you can see in the heatmap below, it’s a sea of green in the altcoins market today. Most of them are charting notable increases. Even the large-caps are up a lot – ETH gains 5.8%, DOGE – 7.7%, ADA – 8.5%, HYPE – 5.5%, SUI – 11.6%, and so forth.
But the most impressive gains for the day come from two of the more polarizing meme coins – Fartcoin and Bonk. The latter is today’s best performer, gaining about 20%, while the latter is up by 17%. Right behind them is Celestia (TIA), which gained 16%.
It’s one of those days where the worst-performing cryptocurrencies are stablecoins (ironically, of course), with just Fasttoken (FTN) and Bitcoin Cash (BCH) struggling to gain and trade flat.
Binance Free $600 (CryptoPotato Exclusive): Use this link to register a new account and receive $600 exclusive welcome offer on Binance (full details).
LIMITED OFFER for CryptoPotato readers at Bybit: Use this link to register and open a $500 FREE position on any coin!
Disclaimer: Information found on CryptoPotato is those of writers quoted. It does not represent the opinions of CryptoPotato on whether to buy, sell, or hold any investments. You are advised to conduct your own research before making any investment decisions. Use provided information at your own risk. See Disclaimer for more information.
Cryptocurrency charts by TradingView.

TL;DR
- Analysts see potential for further gains for XRP, with targets ranging from $2.80 to over $3.50 – while some even speculate on a parabolic rally similar to 2017.
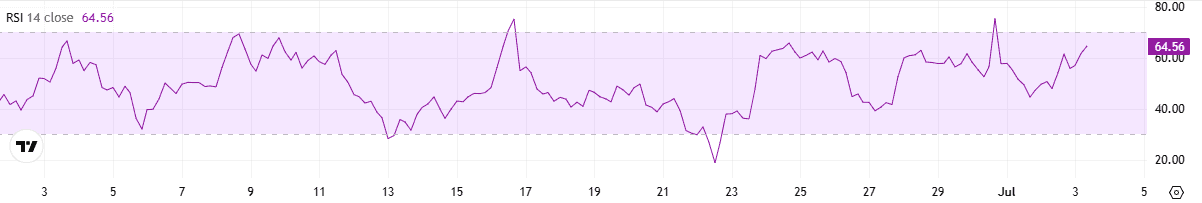
- Despite the bullish outlook, XRP’s Relative Strength Index (RSI) nears 70, signaling potential overbought conditions and raising the chance of a short-term correction before any continued breakout.

What’s Next for XRP?
XRP has followed the overall resurgence of the cryptocurrency market in the last 24 hours, soaring to almost $2.30. Another factor that may have positively impacted its recent price performance is Ripple’s application for a license with the US national bank regulator, the Office of the Comptroller of the Currency (OCC).
According to multiple analysts, its ascent has yet to reach new dimensions. The X user CRYPTOWZRD noted that XRP closed the day “bullish,” setting $2.80 as the next resistance target.
“The intraday chart was highly volatile and bullish. It is now testing the $2.2550 resistance target. A successful breakout and a close above this level will offer the next long opportunity,” the trader added.
World of Charts believes an XRP breakout and retest has already been confirmed. The analyst expects a move towards $3 in the coming days, followed by a pump beyond $3.50 sometime this month.
The X user Maxi is even more optimistic. The crypto enthusiast believes XRP could replicate its performance in 2017 when it experienced a staggering 1,200% surge in a matter of days. Nowadays, a spike of that magnitude would drive the token’s valuation to a new all-time high of $30.
At the moment, such a rally seems quite unrealistic, considering that XRP’s market cap needs to skyrocket above $1.6 trillion. Currently, Bitcoin (BTC) is the only cryptocurrency whose capitalization exceeds that mark, while Ethereum (ETH) is far below with $313 billion.
Observing Some Indicators
Despite the bullish predictions, there are some red flags popping up suggesting the asset could head in the opposite direction in the short term.
The Relative Strength Index, which measures the speed and magnitude of recent price changes, has climbed to almost 70. Such readings generally mean that the valuation has increased too rapidly over a short period of time, signaling that it might be time for a correction.
If you’re curious about more indicators that could hint at XRP’s next move, check out our in-depth article here.
Binance Free $600 (CryptoPotato Exclusive): Use this link to register a new account and receive $600 exclusive welcome offer on Binance (full details).
LIMITED OFFER for CryptoPotato readers at Bybit: Use this link to register and open a $500 FREE position on any coin!

 Forex3 years ago
Forex Today: the dollar is gaining strength amid gloomy sentiment at the start of the Fed’s week
- Forex3 years ago
Unbiased review of Pocket Option broker
- Forex3 years ago
Dollar to pound sterling exchange rate today: Pound plummeted to its lowest since 1985
- Forex3 years ago
How is the Australian dollar doing today?
- Cryptocurrency3 years ago
What happened in the crypto market – current events today
- World3 years ago
Why are modern video games an art form?
- Commodities3 years ago
Copper continues to fall in price on expectations of lower demand in China
- Economy3 years ago
Crude oil tankers double in price due to EU anti-Russian sanctions


