Cryptocurrency
Dogeverse Price Outlook as $15M Presale Enters Final Stage – Next Meme Coin to Explode?

Crypto investors can’t seem to get enough of Dogeverse, the multi-chain meme coin that’s taken the market by storm.
With its record-breaking $15 million presale entering its final stretch before exchange listings, speculation is ramping up that Dogeverse (DOGEVERSE) could be the next joke token to explode.

Dogeverse Presale Countdown – Final Chance to Invest
The countdown is on for investors to get in early on Dogeverse.
Having raised over $15 million in funding from investors, Dogeverse’s presale is entering its final ten days before hitting the open market.
For anyone still deciding, this is the last opportunity to buy DOGEVERSE tokens at the low rate of $0.00031 each.
Come June 3, that price will no longer be available as the presale window closes.

Those who miss that cutoff will only be able to buy DOGEVERSE on the open market once the token is listed on a DEX.
However, those who do invest in the presale can claim their tokens on June 5 – just before the token’s first exchange listing.
Members of Dogeverse’s Telegram channel are already buzzing about how this listing could impact price.
As has been the case with recent successful meme coin presales, like Book of Meme (BOME), the pre-listing hype often translates to an immediate pump once the token hits exchanges.
Dogeverse Innovates with Multi-Chain Feature & High Staking Rewards
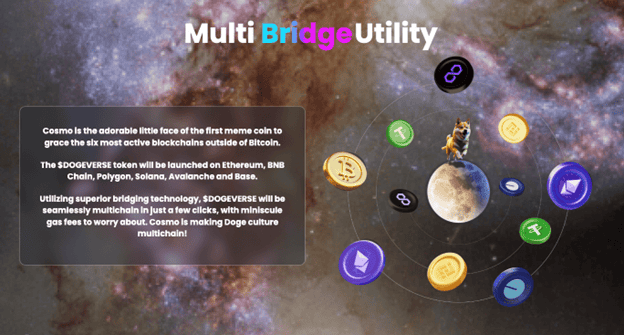
What’s really generating interest in Dogeverse is its multi-chain approach.
This token won’t be available on just one blockchain – it aims to be the first meme coin deployable across six major chains.
Using bridging protocols like Wormhole, DOGEVERSE tokens will be transferable between Ethereum, Solana, Base, Polygon, Avalanche, and BNB Chain.
No more being confined to just one network.
This means, for example, that an investor who has DOGEVERSE on Ethereum but wishes to check out Solana’s DeFi ecosystem can easily transfer their tokens without having to sell and re-buy on a different exchange.
Alongside this multi-chain feature, Dogeverse offers a passive income stream through its staking protocol.
By simply locking up DOGEVERSE tokens, investors can earn estimated annual yields of 51%.
It’s this combination of meme-style fun and real utility that has helped drive presale demand for DOGEVERSE.
And with mysterious “community incentives” hinted at in the project’s whitepaper, there could be even more surprises in store.
How High Could the DOGEVERSE Price Go Post-Listing?
So, will Dogeverse’s ambition pay off with an explosive price surge once it lists?
Many in the meme coin community think this is a possibility.
At its current presale price of $0.00031, with a hard-capped supply of 200 billion tokens, that translates to a fully diluted market cap (FDMC) of $62 million.
This is a drop in the ocean compared to established meme coins like Pepe (PEPE) and Bonk (BONK).
Even a modest 10x surge from that level to $0.0031 would push DOGEVERSE’s FDMC to over $620 million.
That’s certainly plausible, considering the actual circulating supply would be far lower than 200 billion thanks to staking lockups and other allocations.
A more aggressive price target could be $0.005 since that would give DOGEVERSE an FDMC of $1 billion – a key psychological milestone.
Bullish projections for Dogeverse are also making the rounds on social media.
Last week, popular YouTuber Jacob Bury declared that he sees “10x potential” for DOGEVERSE based on its multi-chain premise and community growth so far.
Of course, given the nature of the meme coin space, there are no guarantees of upside.
But with such positive sentiment and strong fundamentals, Dogeverse seems to have all the ingredients needed for a successful launch.
Disclaimer: The above article is sponsored content; it’s written by a third party. CryptoPotato doesn’t endorse or assume responsibility for the content, advertising, products, quality, accuracy, or other materials on this page. Nothing in it should be construed as financial advice. Readers are strongly advised to verify the information independently and carefully before engaging with any company or project mentioned and do their own research. Investing in cryptocurrencies carries a risk of capital loss, and readers are also advised to consult a professional before making any decisions that may or may not be based on the above-sponsored content.
Readers are also advised to read CryptoPotato’s full disclaimer.
Binance Free $600 (CryptoPotato Exclusive): Use this link to register a new account and receive $600 exclusive welcome offer on Binance (full details).
LIMITED OFFER 2024 at BYDFi Exchange: Up to $2,888 welcome reward, use this link to register and open a 100 USDT-M position for free!


Cryptocurrency
MORI COIN (MORI) Explodes by 300% in a Day: The New Crypto Sensation or a Downright Scam?

TL;DR
- The price of the Solana-based meme coin skyrocketed after drawing massive attention across social media platforms.
- One trader turned $290 into $1.6 million but still holds the position – risky, as the valuation could crash just as fast. Moreover, the token lacks real utility, making the rally purely speculative.

The Impressive Jump
It’s a familiar sight in the meme coin sector: a token suddenly skyrocketing by double or even triple digits in a short period. Today’s best performer is the lesser-known MORI COIN (MORI), whose price has exploded by over 300% on a 24-hour scale, while its market capitalization has surged past $150 million.
The Solana-based asset is one of the top-trending cryptocurrencies on CoinGecko, and among the most talked-about on the social media platform X. Its rally is driven by considerable interest from traders.
Earlier today, Stalkchain estimated that MORI headed north due to a wave of fresh wallets that were “aggressively buying in.”
While the meme coin’s rally is undoubtedly impressive, investors contemplating whether to jump on the bandwagon should keep some important notes in mind. For one, MORI was launched by a notorious Russian YouTuber (with over 3.2 million followers) who allegedly runs a massive Darknet marketplace.
That said, many X users labeled the asset as one of the biggest scams in the crypto space. David Crypto Scam Hunter supports that thesis, albeit suggesting that further gains in the future are not out of the question.
⚠️⛔️$MORI
One of the biggest scams rn
It might go higher – why not?
But no doubt… it’s a massive scam
Update coming soon. https://t.co/idZMnn6MdK pic.twitter.com/u2BOo496HR
— David Crypto Scam Hunter (@CryptoScamHuntO) June 30, 2025
Besides its purported connection to a Dark Web marketplace, MORI lacks intrinsic value, and its price is driven purely by hype, speculation, and insider promotion. There’s also limited transparency regarding the token’s supply, developer wallets, or whale distributions. Its marketing strategy mirrors previous pump-and-dump schemes, which have caused crucial losses to investors in the past.
Early Birds Make Fortunes
Scam or not, MORI (just like many other meme coin that recorded massive gains in its early days) allowed savvy traders to generate substantial profits.
The X account, DexCheck AI, revealed the case of one person (or entity) who turned $290 into $1.6 million by investing in the token. As of this writing, the wallet still holds the position. This is a risky move, as a potential crash could wipe out the paper profits entirely. However, MORI’s bull run might still be in its early stages, and the fortune could potentially grow even larger in the coming days.
Binance Free $600 (CryptoPotato Exclusive): Use this link to register a new account and receive $600 exclusive welcome offer on Binance (full details).
LIMITED OFFER for CryptoPotato readers at Bybit: Use this link to register and open a $500 FREE position on any coin!

Bitcoin is starting the week with a test of the $108,000 level. The primary cryptocurrency also attempted to break above this level during the weekend but failed to do so.
Meanwhile, certain altcoins are charting notable gains, while the majority of the market is trading in the green.
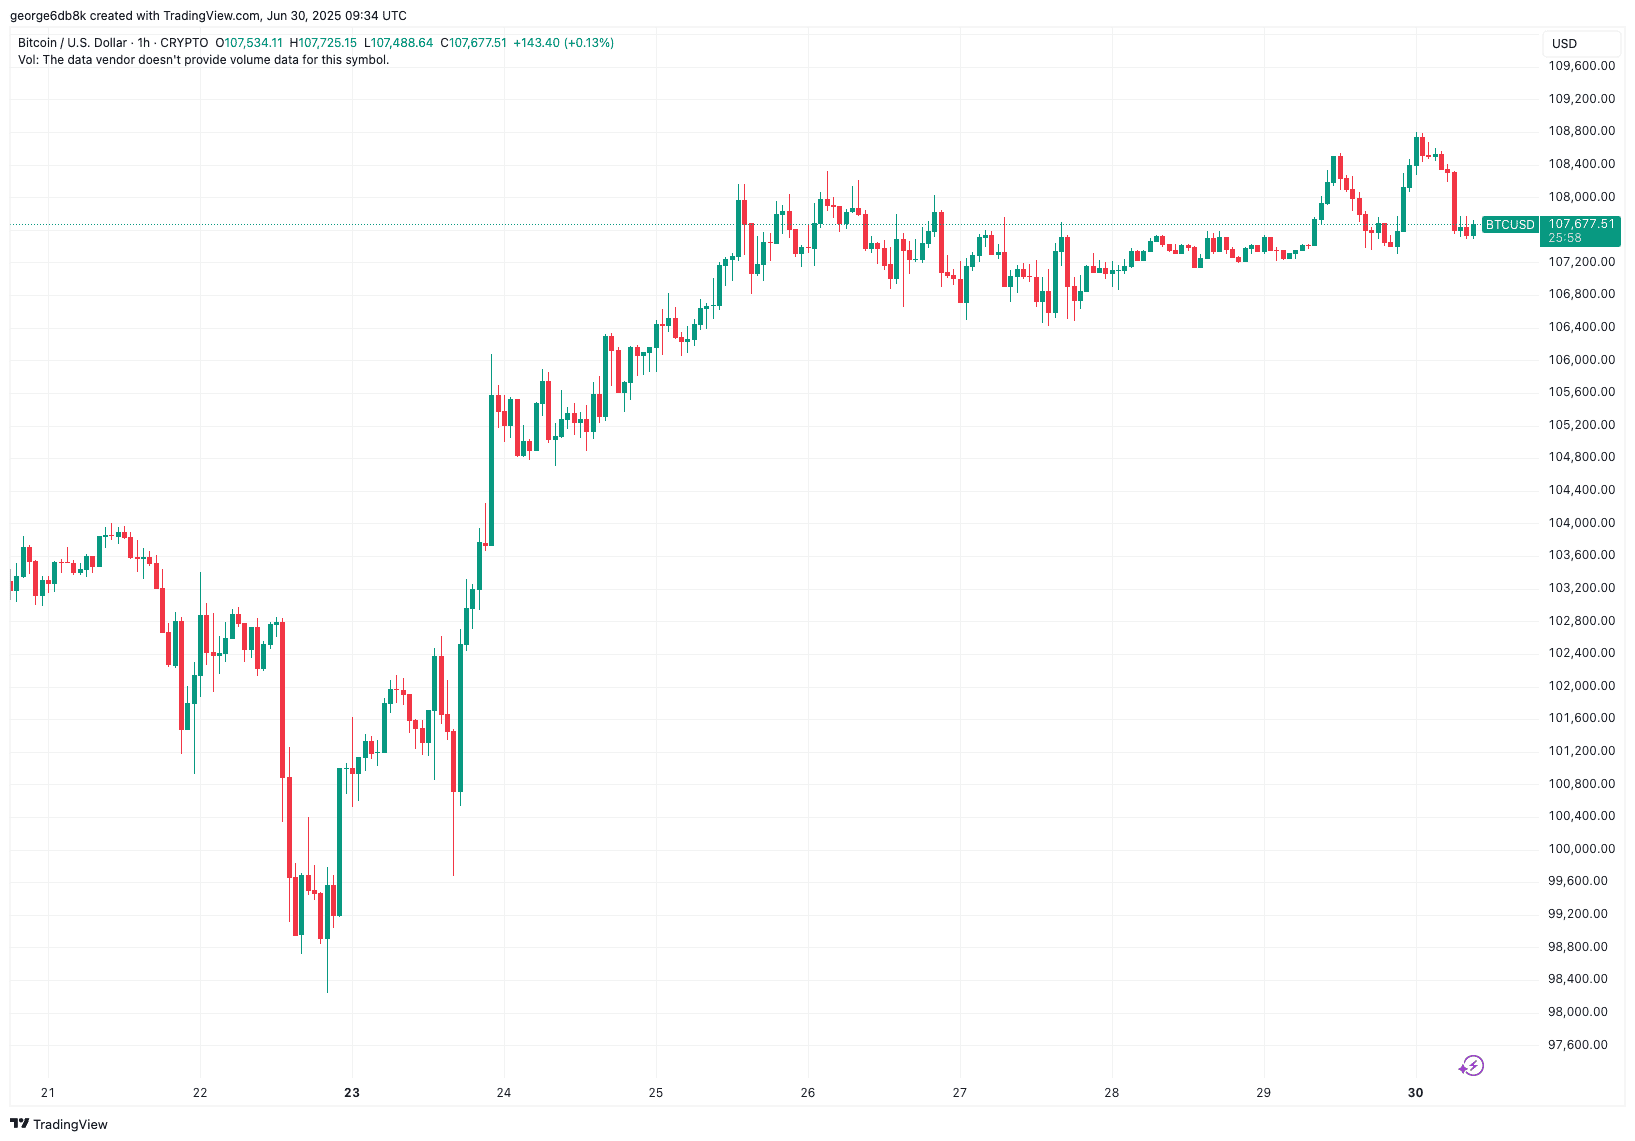
Bitcoin Price Testing $108K
Bitcoin is seemingly attempting to break above the $108,000 level – something that it’s been trying to do for quite a while now. Unfortunately, at least up until this moment, the cryptocurrency has been unsuccessful in doing so. Today, however, it almost reached $109,000 before the sellers took the stage.
The most recent attempt comes amid news that the Japanese comapny MetaPlanet has made yet another Bitcoin buy worth some $108,000 and amid growing expectations that Michael’s Saylor’s Strategy will announce its own strategic purchase.
At the time of this writing, BTC’s price retraced to around $107,700 and it’s interesting to see if it will finally be able to break above this relatively narrow range that it’s been trading within for the past week.
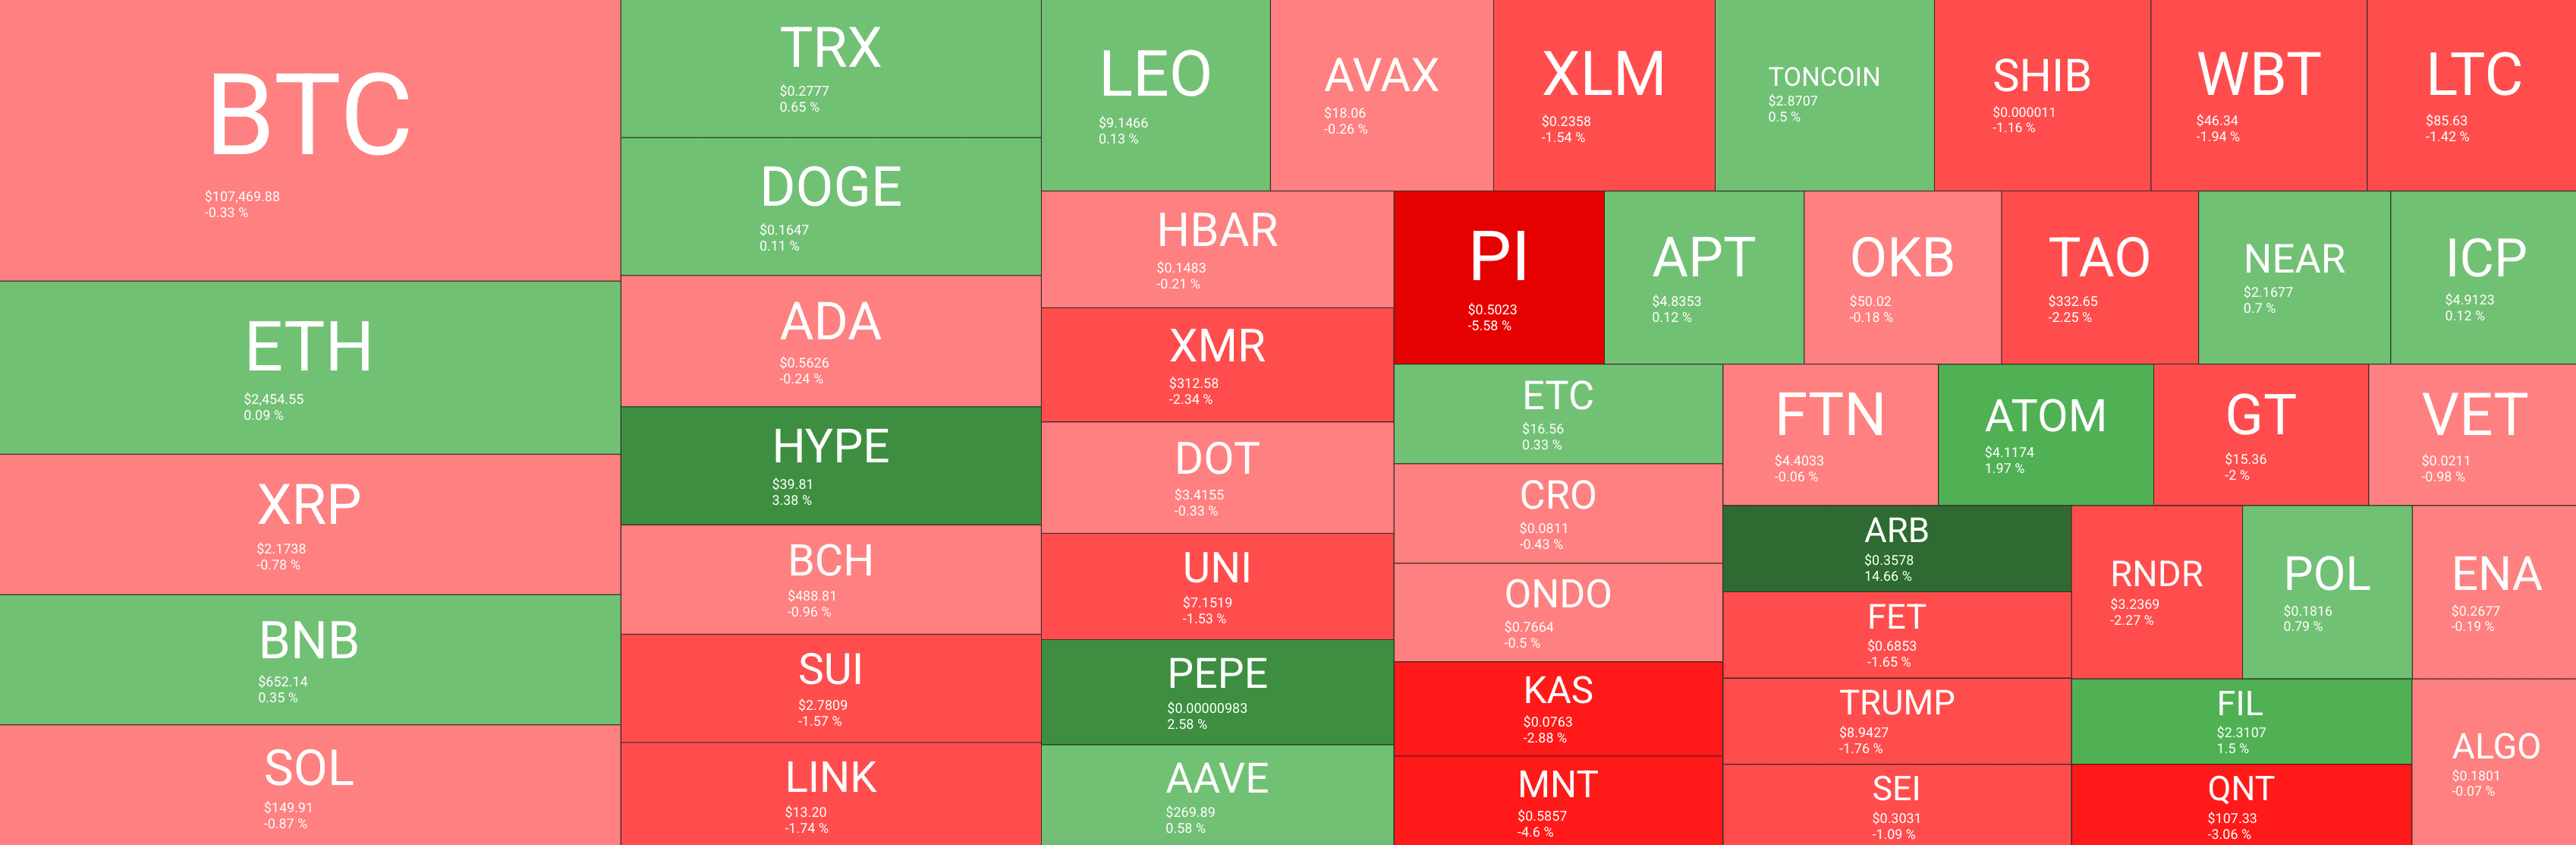
Altcoins Mixed, ARB Rallies
Today’s heatmap is rather mixed with the majority of altcoins trading mostly flat. However, there’s an obvious exceeption to it all in the face of Arbitrum’s ARB token, that’s up 15% on the day. In fact, it soared by around 20% but has since retraced a little bit.
As CryptoPotato reported, the primary reason behind Arbitrum’s surge today is that there are some rumors that the popular retail-oriented trading app Robinhood might use the network to build its own protocol. Hours ago, the fintech comapny revealed that it will be conducting a fireside chat with Ethereum’s founder Vitalik Buterin and the CSO of Arbitrum’s Onchain Labs – A.J. Warner.
Other than ARB, the majority of other altcoins are trading relatively flat with PENGU, OP, and HYPE up by 3.5% in the past 24 hours – slightly ahead of the curve.
KAIA, Pi Network (PI), and Mantle (MNT), on the other hand, are the worst performers, down 6.1%, 5.4%, and 5.7%, respectively.
Binance Free $600 (CryptoPotato Exclusive): Use this link to register a new account and receive $600 exclusive welcome offer on Binance (full details).
LIMITED OFFER for CryptoPotato readers at Bybit: Use this link to register and open a $500 FREE position on any coin!
Disclaimer: Information found on CryptoPotato is those of writers quoted. It does not represent the opinions of CryptoPotato on whether to buy, sell, or hold any investments. You are advised to conduct your own research before making any investment decisions. Use provided information at your own risk. See Disclaimer for more information.
Cryptocurrency charts by TradingView.

TL;DR
- ARB spiked to a two-week high following a combination of rumors and positive factors.
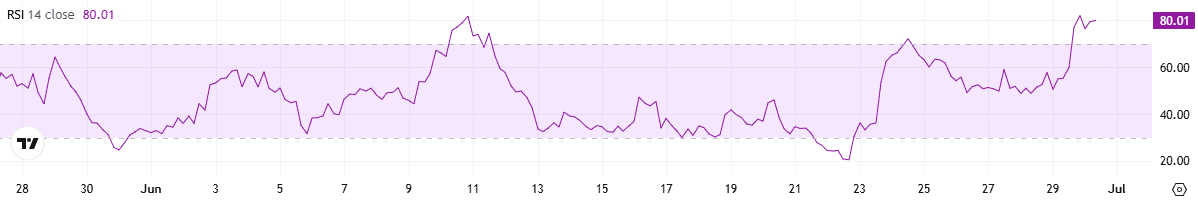
- While some analysts believe it may rally even further in the short term, the RSI’s ratio of over 80 suggests an incoming pullback could be on the horizon.
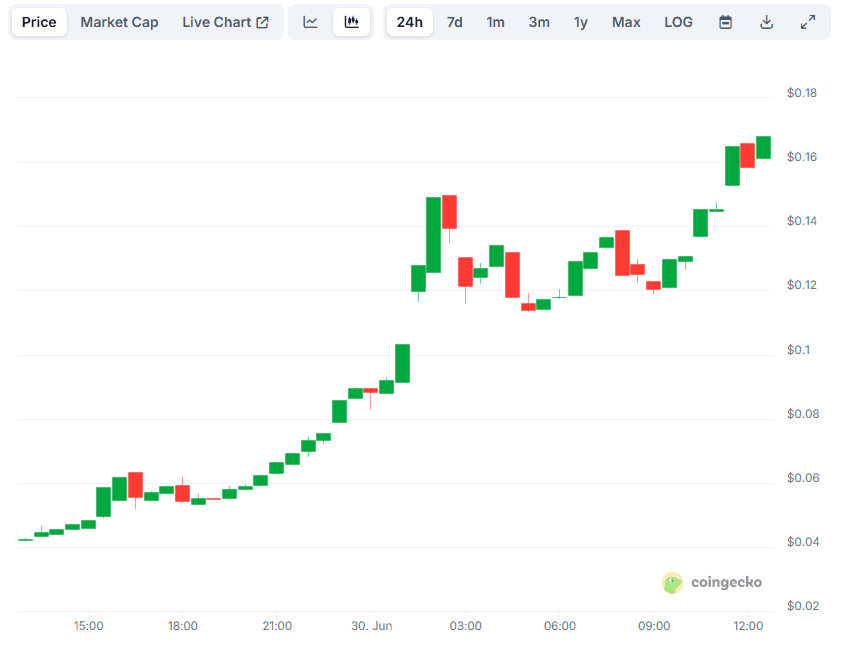
The Top Performer
ARB, the native token of Arbitrum, has been the best-performing cryptocurrency from the top 100 club over the past 24 hours. Its price is up an impressive 20% for that timeframe, reaching $0.38 (per CoinGecko’s data).
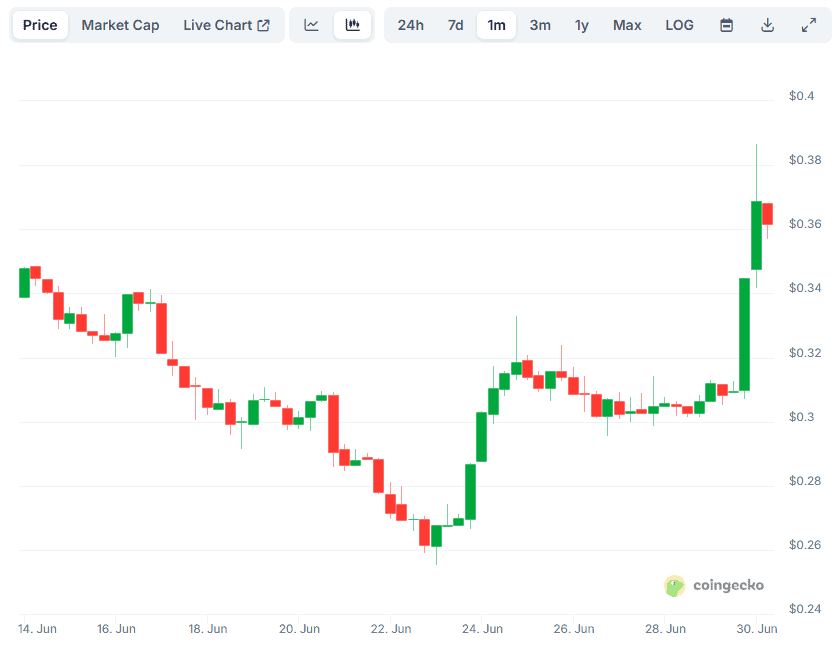
Its market capitalization shot to almost $2 billion, thus flipping Official Trump (TRUMP), Render (RENDER), Filecoin (FIL), Algorand (ALGO), and other well-known altcoins. Currently, ARB is the 60th-largest cryptocurrency.
The most likely reason for the uptrend is the rumor that Robinhood might team up with Arbitrum to build a blockchain platform that enables European investors to trade US stocks. Just a few hours ago, the fintech company revealed it will conduct a “fireside chat” with Ethereum’s founder Vitalik Buterin and A.J. Warner (CSO of Onchain Labs – an entity that stands behind Arbitrum).
Another factor that may have positively impacted ARB’s valuation is the further support coming from Binance. The world’s leading crypto exchange recently announced it will add the trading pair ARB/USDC to its Trading Bots section, although this one is more on the speculative side and not as likely to have fueled any meaningful price change.
More Gains on the Way?
ARB’s surge has garnered attention across the cryptocurrency industry, with several analysts suggesting it may signal the start of a significant bullish trend. One X user envisioned a potential breakout of a certain trendline, which could send the price to $0.50 and beyond.
Crypto TA King thinks “ARB looks amazing” at its current levels, saying they will “take entry” if the valuation drops to the $0.32-$0.34 range.
Despite the prevailing optimism, investors should exercise caution because the token’s Relative Strength Index (RSI) has spiked above 80. This is generally viewed as bearish territory, as it indicates that the price has increased too rapidly in a short period and may be poised for a short-term correction.
Binance Free $600 (CryptoPotato Exclusive): Use this link to register a new account and receive $600 exclusive welcome offer on Binance (full details).
LIMITED OFFER for CryptoPotato readers at Bybit: Use this link to register and open a $500 FREE position on any coin!

 Forex3 years ago
Forex Today: the dollar is gaining strength amid gloomy sentiment at the start of the Fed’s week
- Forex3 years ago
Unbiased review of Pocket Option broker
- Forex3 years ago
Dollar to pound sterling exchange rate today: Pound plummeted to its lowest since 1985
- Forex3 years ago
How is the Australian dollar doing today?
- Cryptocurrency3 years ago
What happened in the crypto market – current events today
- World3 years ago
Why are modern video games an art form?
- Commodities3 years ago
Copper continues to fall in price on expectations of lower demand in China
- Economy3 years ago
Crude oil tankers double in price due to EU anti-Russian sanctions


