Cryptocurrency
Ethereum Price Fell 2% In June But Has These 4 Bullish Signs Going Into July
June was a lackluster month for crypto market gains amid global uncertainty looming over international tariff policy and the future direction of US central bank rates.
US Stocks Outpaced Ethereum In June
For the 30 day window ending Friday, Jun. 27, the S&P 500 Index gained +4.25%.
The push overcame serious resistance from the tariff nail biters and took the broad US stock benchmark to a historic record close Friday.
But after running from $76,200 on 4/8 to $111,600 on 5/22, a +46% gain in a little over a month, Bitcoin’s price took some time to cool down in June. The cryptocurrency charted minor gains, which could be seen as a positive in the face of massive international turmoils and geopolitical shocks.
Meanwhile, Ethereum corrected by 24% before bouncing off the Jun. 22 support to finalize a 2% loss for the 30 days ending Friday, Jun. 30th. So does ETH have a problem that Bitcoin doesn’t?
Not really.
Ethereum is a smaller currency by market cap, about 14% of Bitcoin’s size. Traders still perceive it as a more speculative bet. So it tends to move in the same direction as BTC — by larger percentages.
That means on the way down, losses are frequently greater. But on the way up, gains are often greater too.
For example, during the crypto market’s rally from early April through early June, Bitcoin made a +46% gain. But during the same rally, Ethereum gained +100%, rising from the $1,400 handle to the $2,800 level.
Bitcoin and Ethereum Rainbow Charts
Double rainbow all the way across the sky?
Bitcoin is by and large the biggest leading indicator for the rest of the crypto market’s prices, including Ethereum. It appears to have a long ways to go before topping out this year or next.
Based on popular and authoritative analysts’ price targets for Bitcoin in 2025, it’s pacing to enter July and Q3 at 50% to 66% of its peak price before this cycle is over.
That means it could double or gain by half again its June price levels before the year is over.
Standard Chartered, Bernstein, Galaxy Digital, and Peter Brandt all expect $150,000 to $200,000 for BTC sometime in the next six months.
Bitcoin’s long-term price trend rainbow chart confirms these projections.
Meanwhile, Ethereum’s own long-term trend chart is shaping up to signal a three-peat of a multi-year trend.
If it happens the way it did the last two major market cycles, this Ether prices could be primed to rise by more than Bitcoin’s during the next big monthly rally.
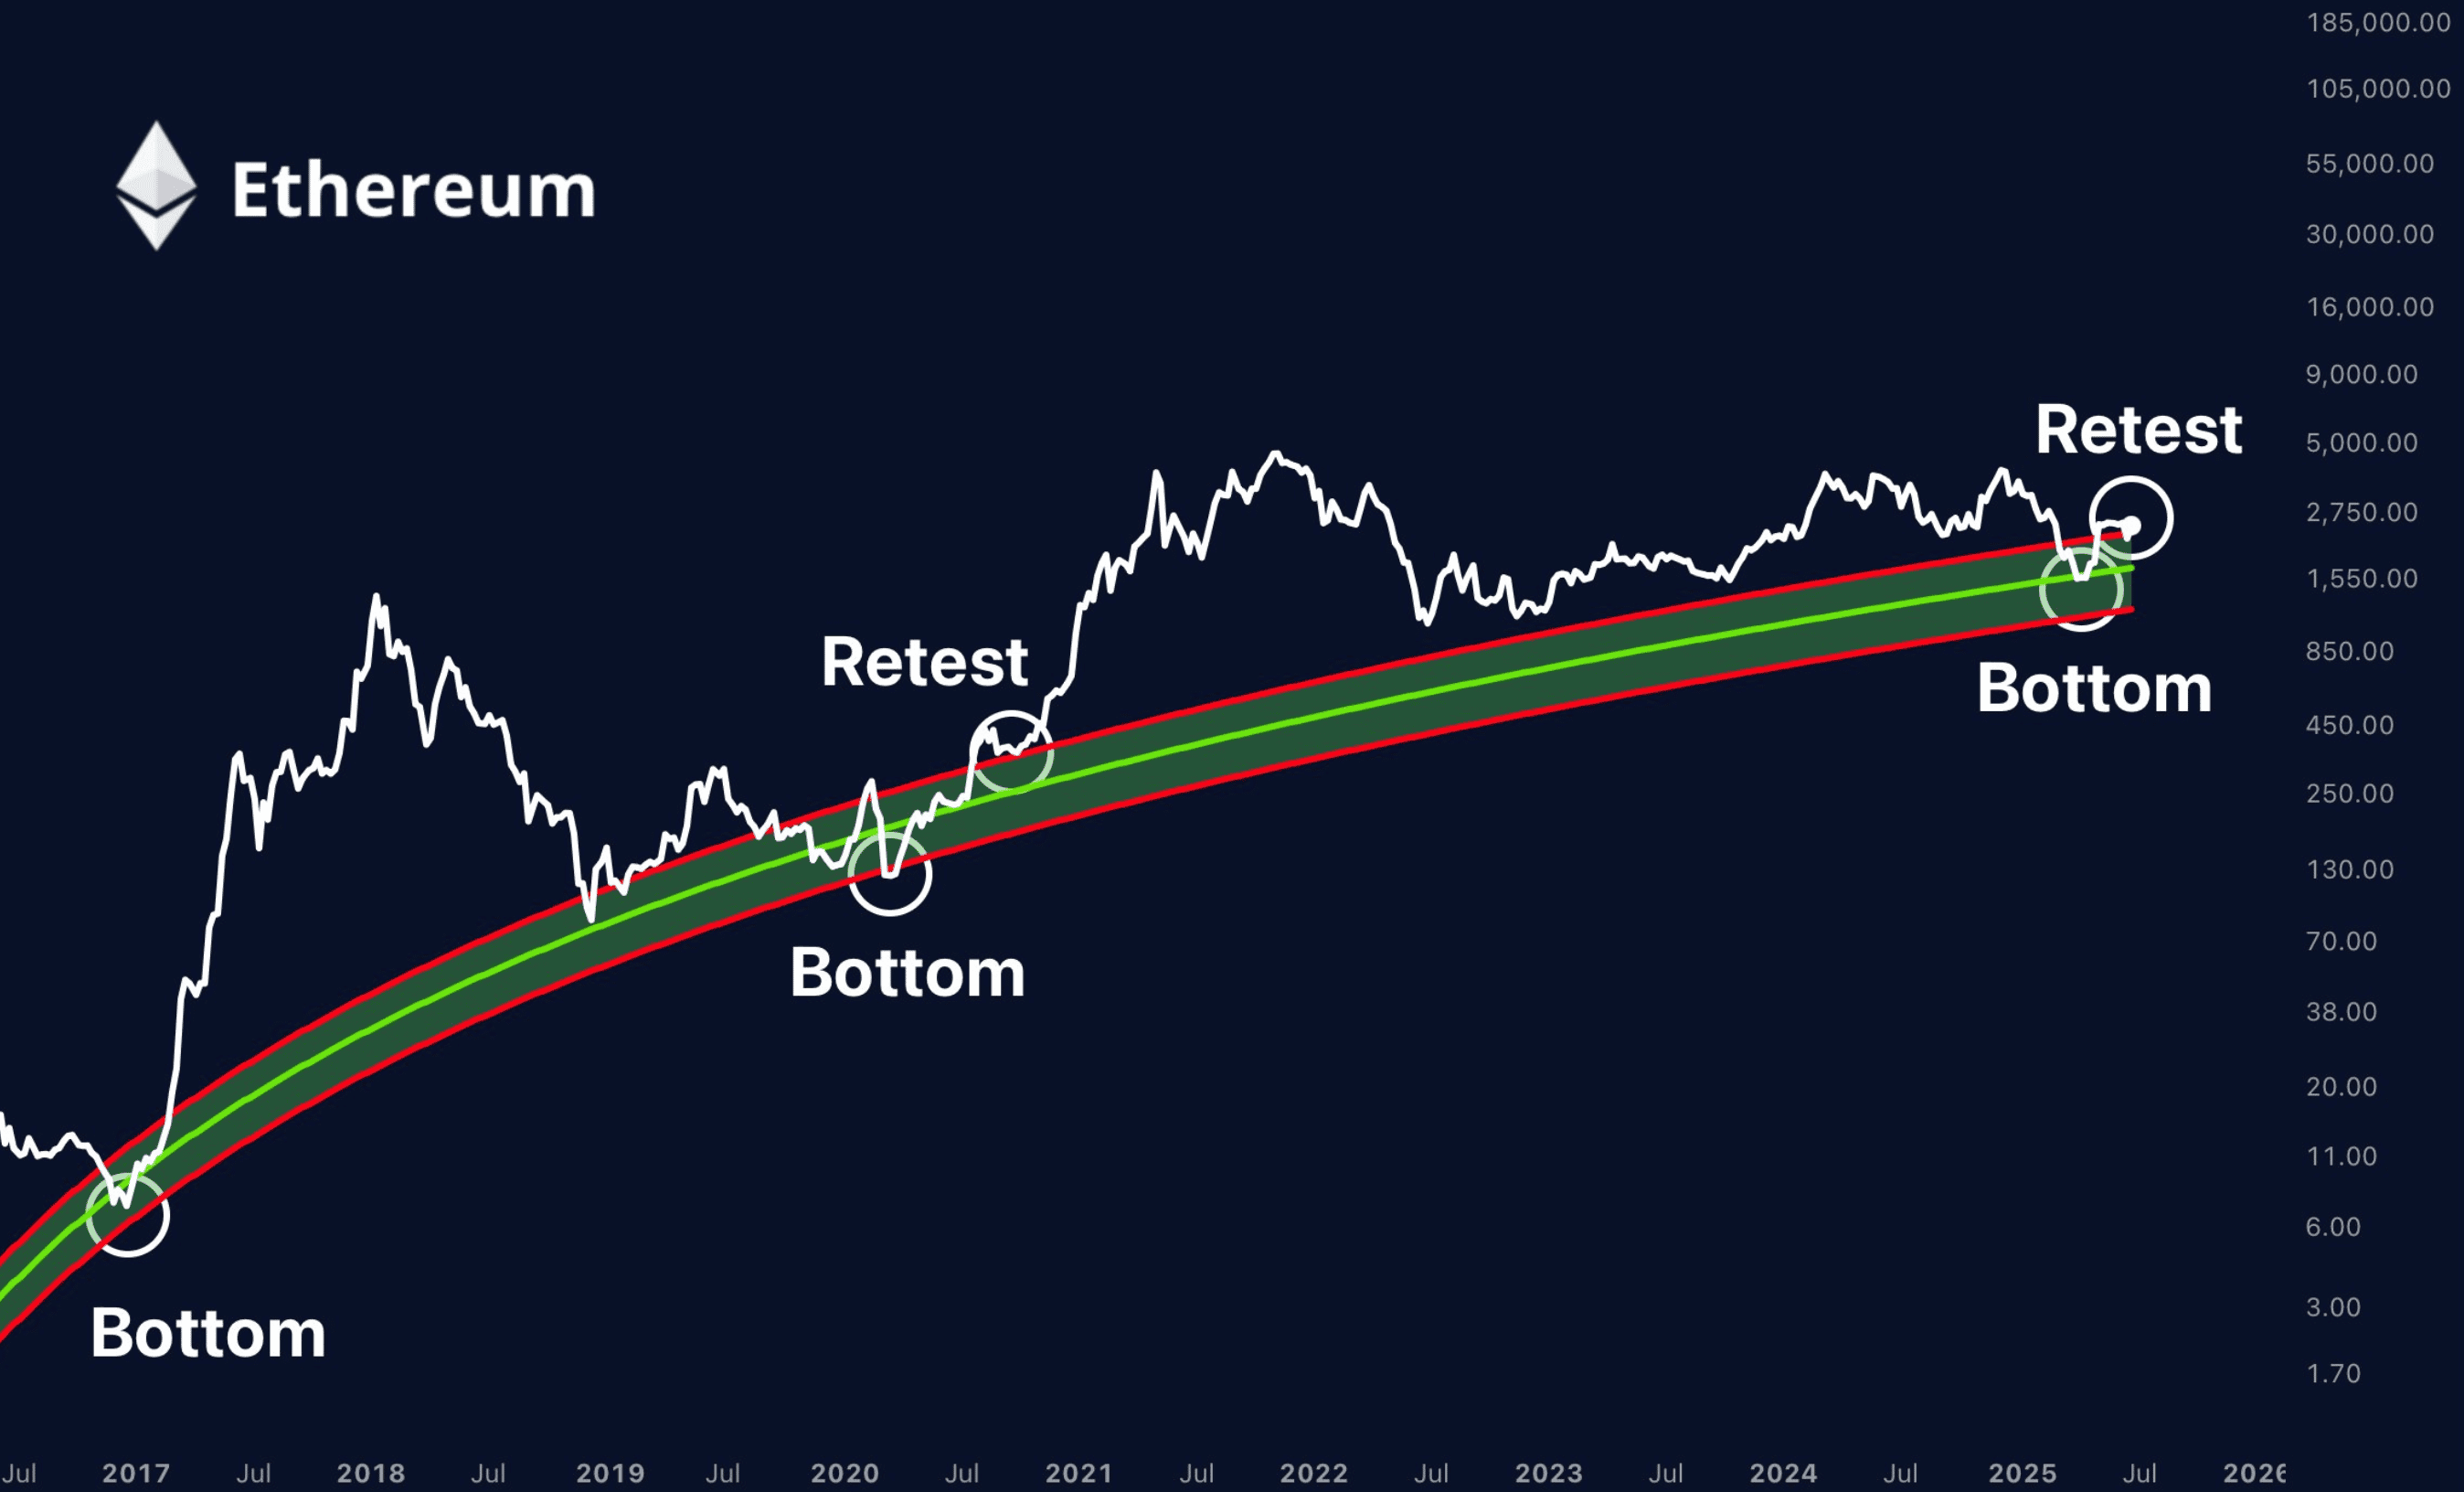
If it turns out to be Bitcoin’s final push for its peak on this cycle as market watchers expect, Ethereum’s gains could signal the start of this cycle’s alt season in meme coins and Layer 2 app tokens.
In addition to the market technical setup for ETH prices in Q3, here are four further bullish signals supporting the leading smart contract platform’s price gains in July.
1. Who Will Win Ethereum L2 Fee Wars?
Ethereum’s price has taken time to absorb the shock of the Dencun upgrade on Mar. 13, 2024.
The upgrade lowers rates for Layer 2 apps to lock in tranches of transaction updates with the base layer chain.
In the 15 months since, developers have deployed a number of new apps with currencies that offer Ethereum services for lower fees.
The base chain’s fee revenue dropped from $30 million annually to $500,000 by Q1 of this year.
That saves users money, but a lot of Ethereum stakers who had their money parked in staking contracts to earn that fee revenue felt inclined to move it somewhere that it could still earn returns on their savings.
This is a massive factor in Ethereum’s sluggish price growth compared to Bitcoin’s over the past year. But it’s not that the latter is falling behind its competitors like Solana and Ripple.
When factoring in the growth of the post-Dencun L2 coins on Ethereum— like Mantle (MNT), POL (POL), Arbitrum (ARB), Optimism (OP), Movement (MOVE), and Starknet (STRK)— the money mostly didn’t leave Ethereum and go to its competitors. It went to another layer, powered by and supporting the base chain.
For that reason, Ethereum may be undervalued by a large number of the cryptocurrency market’s headline readers that don’t understand what happened.
Ethereum Identity Crisis?
Some have referred in the mean time to this awkward stage in Ethereum’s growth as an identity crisis. It’s an open platform and anyone can build on it in any way that the code can handle.
The question for Vitalik Buterin and crypto market investors who show up to value early is:
Will one of the slew of Ethereum scale and fee apps, some new app we haven’t heard of yet, or an upgrade be what implements the best ultra long term, future proof, platform-wide standardizations that define the network’s global advantages?
Find the answer to that question and you’re doing some real work.
2. SharpLink $30M ETH Buy
In another positive development, the corporate treasury race that started for Bitcoin supplies continues to rock the Ethereum markets.
SharpLink Gaming, bought another $30 million worth of ETH just before the Ether price chart threw a small cup and handle pattern. But why does this matter? Well, let’s see what happened to STrategy.
Led by founder and executive chairman Michael Saylor, Tyson’s Corner, Virginia-based Strategy Inc. and Bitcoin have both benefited from the company’s pivot in 2020 to simply pile up as much BTC as it can hold on to forever.
As a result of the cryptocurrency’s increasing popularity with investors since then, MSTR stock rallied 566% in under 11 months from $63 per share on Jan. 5, 2024 to a price peak of $420 on Nov. 22, 2024.
Over that same time, the S&P 500 Index rallied 27% from the 4697 level to 5969.
Every $100 spent on Strategy stock on Jan. 5 last year could be sold for $666 dollars on Nov. 22, paying back buyers $566 for saving their $100 with MSTR shares for a term of 11 months.
That’s like a downpayment on a new car lease with a high credit score.
Meanwhile, $100 spent on an S&P 500 ETF would have returned buyers $27. That’s more like a cheap dinner out for two. All for the same hundred bucks and the same 11 months.
That suggests regulated Wall Street investors wanted on to the Bitcoin bandwagon and found a way in Strategy stocks. Seeing the bullishness of corporate finance, Internet crypto markets were now racing Strategy to accumulate a scarce supply of BTC tokens.
Now, SharpLink is doing it again with ETH. The company’s stocks spiked over 8 days in late May from $3.76 per share to just under $80 a share as Wall Street rewarded the former gaming company for pivoting to accumulating a regulated corporate Ether treasury.
3. $39M ETH Whale Bite
Meanwhile, an Ethereum whale took a $39 million chomp out of the crypto dip on 6/22.
Ethereum’s forward outlook was too good for this whale not to bite at that 24% off discount tag.
Every token is a vote with a daily trading value that fluctuates on a global open market of crypto exchanges. Participants “vote” by locking, unlocking, moving, and swapping currencies, as often as they like, any time they like.
When crypto investors take Ether tokens off a crypto exchange, the remaining supply of ETH tends to attract higher prices at the point of sale. But when they stake ETH for yield, it creates even more support.
4. Bit Digital Drops $34M BTC for ETH
Not to be outdone by SharpLink, publicly traded, New York-based blockchain company Bit Digital, announced on 6/25 it is giving up $34 million worth of BTC tokens to move the proceeds into Ether and develop staking strategies.
They might profit well from determining in advance of the overall market which of the Ethereum scale and fee coins will deliver the most yield and gains together over timespans relevant to their balance sheet and calendar.
Binance Free $600 (CryptoPotato Exclusive): Use this link to register a new account and receive $600 exclusive welcome offer on Binance (full details).
LIMITED OFFER for CryptoPotato readers at Bybit: Use this link to register and open a $500 FREE position on any coin!


TL;DR
- Whales, hackers, and the Ethereum Foundation wallets moved over $500M in ETH through large sales and withdrawals.
- Ethereum transfers rose to 4.6M ETH, nearing the monthly high of 5.2M recorded in July.
- Staking inflows hit 247,900 ETH, the highest in a month, locking more supply from trading.
Large Withdrawals and Whale Activity
Ethereum (ETH) has seen heavy movement from major wallets over the past few days. On-chain data from Lookonchain shows a newly created wallet pulled 17,591 ETH, worth $81.62 million, from Kraken in just two hours.
Over three days, two new wallets withdrew a combined 71,025 ETH, valued at $330 million, from the exchange.
One of these wallets, address 0x2A92, has withdrawn 53,434 ETH, worth $242.34 million, in two days. This includes a recent purchase of 30,069 ETH, valued at $138.46 million, during a market drop.
Major ETH Holders Offload Millions Amid Price Rally
In contrast, several separate entities have been disposing of some ETH holdings. A wallet tied to a hacker address 0x17E0 sold 4,958 ETH for $22.13 million at $4,463, securing a profit of $9.75 million. Earlier this year, the same address sold 12,282 ETH at $1,932 and later bought back part of the amount at higher prices.
A different whale sold 20,600 ETH for $96.55 million over the past two days, generating a profit of more than $26 million after holding the position for nine months.
Meanwhile, an Ethereum Foundation-linked wallet, 0xF39d, sold 6,194 ETH worth $28.36 million in the last three days at an average price of $4,578.
Recent sales from the same wallet included an additional 1,100 ETH and 1,695 ETH for over $12.7 million combined.
The #EthereumFoundation-linked wallet(0xF39d) sold another 1,300 $ETH($5.87M) at $4,518 ~11 hours ago.
Over the past 3 days, this wallet has sold a total of 6,194 $ETH($28.36M) at an average price of $4,578.https://t.co/4hfCWymHVG pic.twitter.com/ErUyEY8SJy
— Lookonchain (@lookonchain) August 15, 2025
Network Activity on the Rise
CryptoQuant data shows Ethereum’s total tokens transferred have been climbing since August 9. After ranging between 1 million and 3 million ETH through late July and early August, transfers have risen to 4.6 million ETH, approaching the monthly high of 5.2 million recorded in mid-July. This increase has occurred alongside a price rally from about $3,400 to $4,600.

Interestingly, staking inflows generally stayed between 20,000 and 80,000 ETH per day over the past month. On August 14, inflows jumped to 247,900 ETH, the highest in the period.
At the time, ETH was trading near $4,600. Large staking deposits reduce the amount of ETH available for immediate trading, as staked coins are locked for a set period.

In the meantime, ETH trades at $4,647 with a 24-hour volume of $68.25 billion, down 2% on the day but up 19% over the week.
Binance Free $600 (CryptoPotato Exclusive): Use this link to register a new account and receive $600 exclusive welcome offer on Binance (full details).
LIMITED OFFER for CryptoPotato readers at Bybit: Use this link to register and open a $500 FREE position on any coin!

TL;DR
- Whales bought two billion DOGE this week, lifting their combined holdings to 27.6 billion coins.
- A single 900M DOGE transfer worth $208M to Binance drew attention to large exchange movements.
- DOGE broke key resistance, with momentum building for a possible push toward the $1 price mark.
Price and Market Moves
Dogecoin (DOGE) traded at $0.23 at press time, slipping 4% over the past day but still showing a 2% gain for the week. Daily turnover came in at about $6.18 billion.
Meanwhile, the broader crypto market saw over $1 billion in liquidations. Hotter-than-expected US Producer Price Index data pushed traders to scale back expectations of a near-term Federal Reserve rate cut. DOGE had roughly 290,500 coins liquidated during the sell-off.
On the two-week chart, analyst Trader Tardigrade notes that DOGE has cleared a downward-sloping resistance line after completing what appears to be a “wave V” in an Elliott Wave sequence. Similar setups in the past, where prolonged declines stayed within falling channels before breaking higher, have been followed by sharp rallies.
$Doge/2-week#Dogecoin is gaining strong momentum to surge above $1 pic.twitter.com/TuSEKr19nv
— Trader Tardigrade (@TATrader_Alan) August 15, 2025
Momentum gauges are also turning up. The Stochastic RSI, which had dropped into oversold territory, is now heading higher. Previous reversals from this zone have coincided with sustained upward moves. The current formation points to a possible run that could carry DOGE past the $1 mark.
Heavy Whale Buying and Large Transfers
As reported by CryptoPotato, blockchain data shows large investors have added two billion DOGE in the past week, spending just under $500 million. That brings their holdings to about 27.6 billion coins, or 18% of the supply. The buying streak has prompted speculation within the community.
Recently, Whale Alert flagged a 900 million DOGE transfer worth about $208 million into Binance. The tracking indicates that it originated from a wallet connected to the exchange, likely as an internal activity. The address involved holds 2.88 billion DOGE, one of the largest balances on the network.
Ali Martinez also reports that transactions above $1 million reached a one-month high, with activity building since early August and peaking as DOGE traded at $0.25.
Whales are back! Dogecoin $DOGE activity at a 1-month high. pic.twitter.com/C83Pv68mCt
— Ali (@ali_charts) August 14, 2025
Sentiment Building
Analyst Gordon described the current setup as “a nice bit of consolidation” before a potential breakout, adding,
“This will be one of the first coins normies FLOCK to & the pump will be MASSIVE.”
With whale accumulation rising, high-value transfers increasing, and a bullish technical pattern in play, DOGE is positioned for a potential push toward $1 if momentum holds.
Binance Free $600 (CryptoPotato Exclusive): Use this link to register a new account and receive $600 exclusive welcome offer on Binance (full details).
LIMITED OFFER for CryptoPotato readers at Bybit: Use this link to register and open a $500 FREE position on any coin!

XRP has recently entered a consolidation phase after a strong rally earlier this summer, with the price action now hovering around key resistance levels on both its USDT and BTC pairs. Yet, while momentum has slowed, the charts still indicate a generally bullish structure, with multiple key support levels remaining firmly in place.
Technical Analysis
By ShayanMarkets
The USDT Pair
On the XRP/USDT daily chart, the price is currently trading near the $3.10 mark, facing a strong resistance zone around $3.40. This follows a breakout above the $2.70 range in July, which has now flipped into a support area.
Both the 100-day and 200-day moving averages are also trending upward and recently formed a bullish crossover around $2.45, reinforcing the medium-term bullish sentiment. If the $3.40 resistance breaks, a push toward the critical $4.00 range becomes likely.
However, the RSI hovering near the neutral 50 level suggests a lack of strong momentum for now, meaning a short-term pullback into the $2.80 support zone is still possible.
This zone will be key for maintaining the bullish structure. Losing it could open the door for a deeper correction toward the 200-day moving average located around the $2.40 mark. Yet, as long as the price stays above the moving averages, the broader trend remains bullish.

The BTC Pair
Looking at the XRP/BTC chart, the pair has recently pulled back after hitting the 3,000 SAT resistance, with the price currently around 2,600 SAT.
This follows a clean breakout above the long-term descending channel and a successful retest of its upper boundary, which coincided with the 200-day moving average and the 2,400 SAT support zone. This confluence remains a key bullish technical factor, as holding above it could attract renewed buying pressure.
That said, RSI levels around 48 show that momentum has cooled after the sharp July rally, meaning XRP may continue ranging between 2,400 SAT and 3,000 SAT in the near term. A decisive close above 3,000 SAT would likely open the path to the 3,400 SAT zone, while losing 2,400 SAT could shift the bias back toward 2,000 SAT support. For now, the structure still favors the bulls as long as higher lows remain intact.

Binance Free $600 (CryptoPotato Exclusive): Use this link to register a new account and receive $600 exclusive welcome offer on Binance (full details).
LIMITED OFFER for CryptoPotato readers at Bybit: Use this link to register and open a $500 FREE position on any coin!
Disclaimer: Information found on CryptoPotato is those of writers quoted. It does not represent the opinions of CryptoPotato on whether to buy, sell, or hold any investments. You are advised to conduct your own research before making any investment decisions. Use provided information at your own risk. See Disclaimer for more information.
Cryptocurrency charts by TradingView.

 Forex4 years ago
Forex Today: the dollar is gaining strength amid gloomy sentiment at the start of the Fed’s week
- Forex3 years ago
Unbiased review of Pocket Option broker
- Forex3 years ago
Dollar to pound sterling exchange rate today: Pound plummeted to its lowest since 1985
- Forex3 years ago
How is the Australian dollar doing today?
- Cryptocurrency4 years ago
What happened in the crypto market – current events today
- World3 years ago
Why are modern video games an art form?
- Commodities3 years ago
Copper continues to fall in price on expectations of lower demand in China
- Economy3 years ago
Crude oil tankers double in price due to EU anti-Russian sanctions


