Cryptocurrency
LUNA Terra collapse forced institutions to withdraw cryptocurrency from exchanges
The LUNA-Terra collapse in the form of the unbundling of the algorithmic TerraUSD (UST) token and the collapse of the Terra blockchain have most prompted institutionalists to withdraw the cryptocurrency from centralized exchanges. This is the conclusion reached by analysts of the U.S. blockchain company Chainalysis.
Why did Terra collapse? According to published data, over 75% of wallets with balances starting from $100,000 withdrew the cryptocurrency from exchanges when UST collapsed. By comparison, the FTX bankruptcy prompted only 68% of large wallets to withdraw cryptocurrency.
Slightly more (69% of large withdrawals) came from the bankruptcy of cryptocurrency lending giant Celsius Network. Large investors are least concerned about volatility. Because of it, about 20% of large investors withdrew cryptocurrency from centralized cryptocurrency exchanges to private wallets. Amid such news, we urge investors to keep an eye on the current rate of Terra Luna Classic.
According to Chainalysis, such cryptocurrency outflows have only intensified with the arrival of big investors, as wealthy depositors are more reactive to incidents in the cryptocurrency market. Investors who have put cryptocurrency into their own wallets are more likely to either hold on to it until better times or use it in decentralized finance (DeFi), analysts found.
Why did Terra collapse? Bankruptcy is not the limit
Earlier, Chainalysis concluded that despite its scale, the bankruptcy of cryptocurrency exchange FTX did not have as many negative consequences for investors as the fall of cryptocurrency lender Celsius Network and hedge fund Three Arrows Caital (3AC). Analysts estimate that the collapse of the blockchain ecosystem Terra, Celsius and 3AC cost investors $53.5 billion. By comparison, they lost about $9 billion due to the bankruptcy of FTX.
To calculate the losses, Chainalysis measured the asset value of each cryptocurrency wallet in the ecosystem at the time of the first purchase. Later, the amount was deducted from the amount of cryptocurrencies that the wallet owners withdrew within the study period. Chainalysis admits that every cryptocurrency withdrawn from a wallet cannot be assumed to have been sold, so the data is superficial.
Earlier, we reported that the SEC has launched a crackdown on cryptocurrency companies.

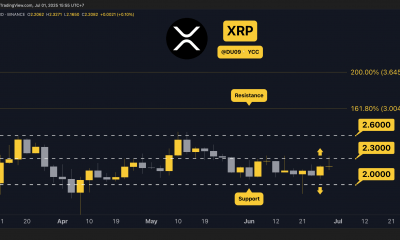

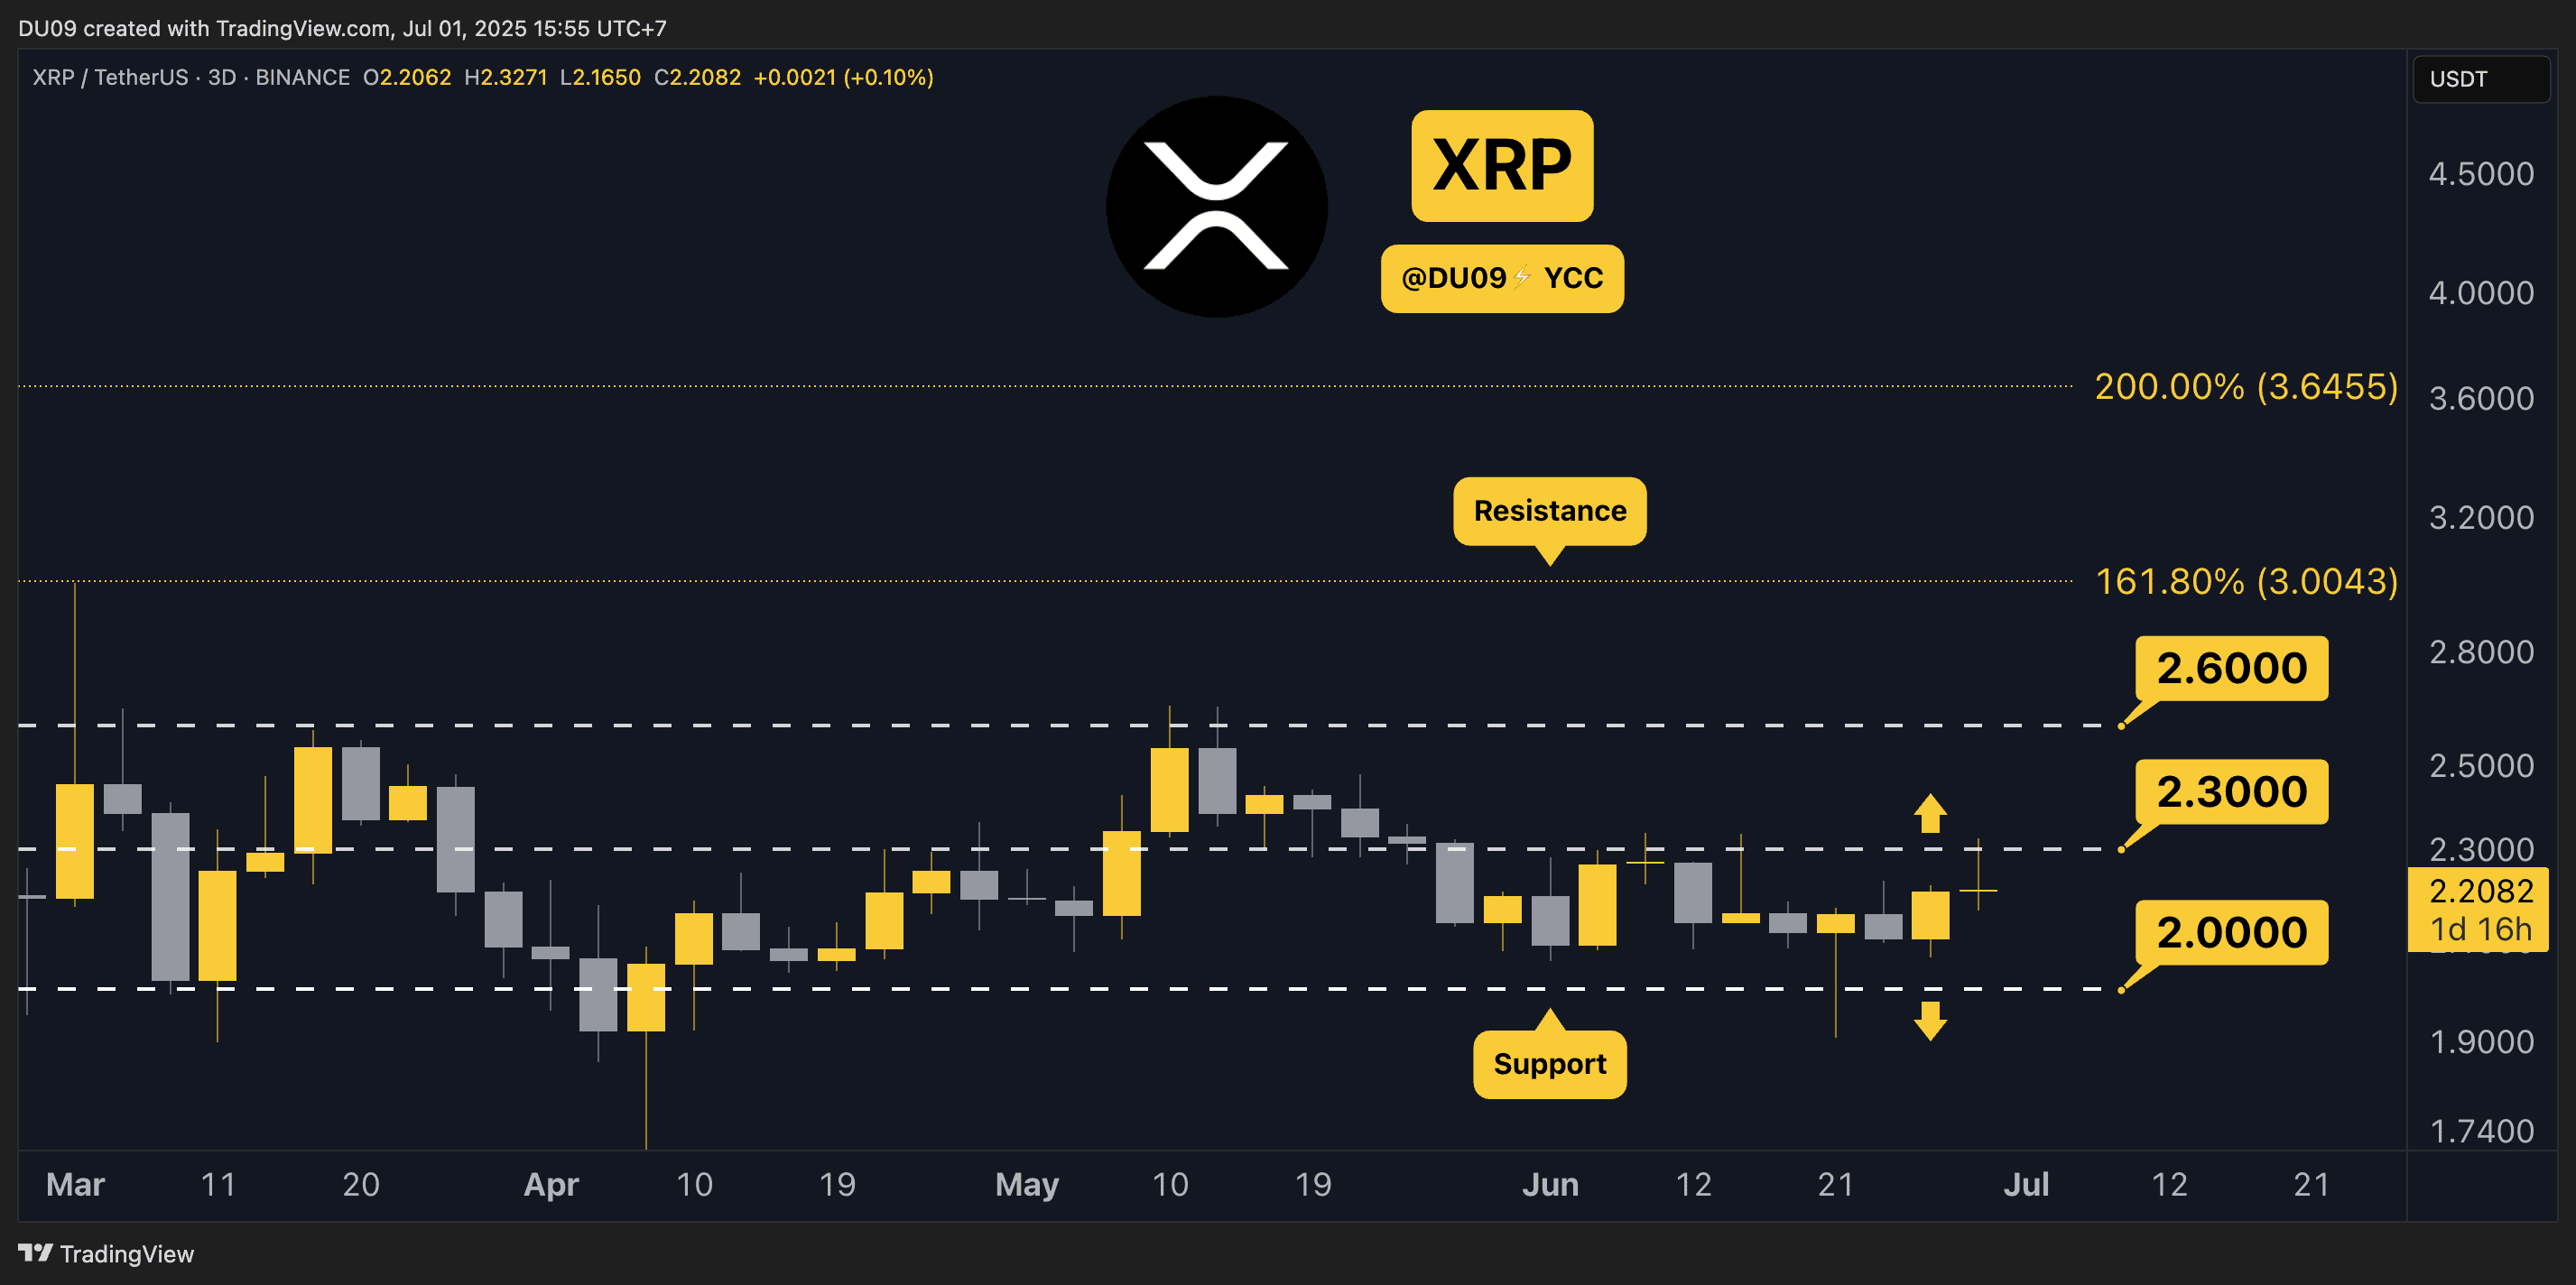
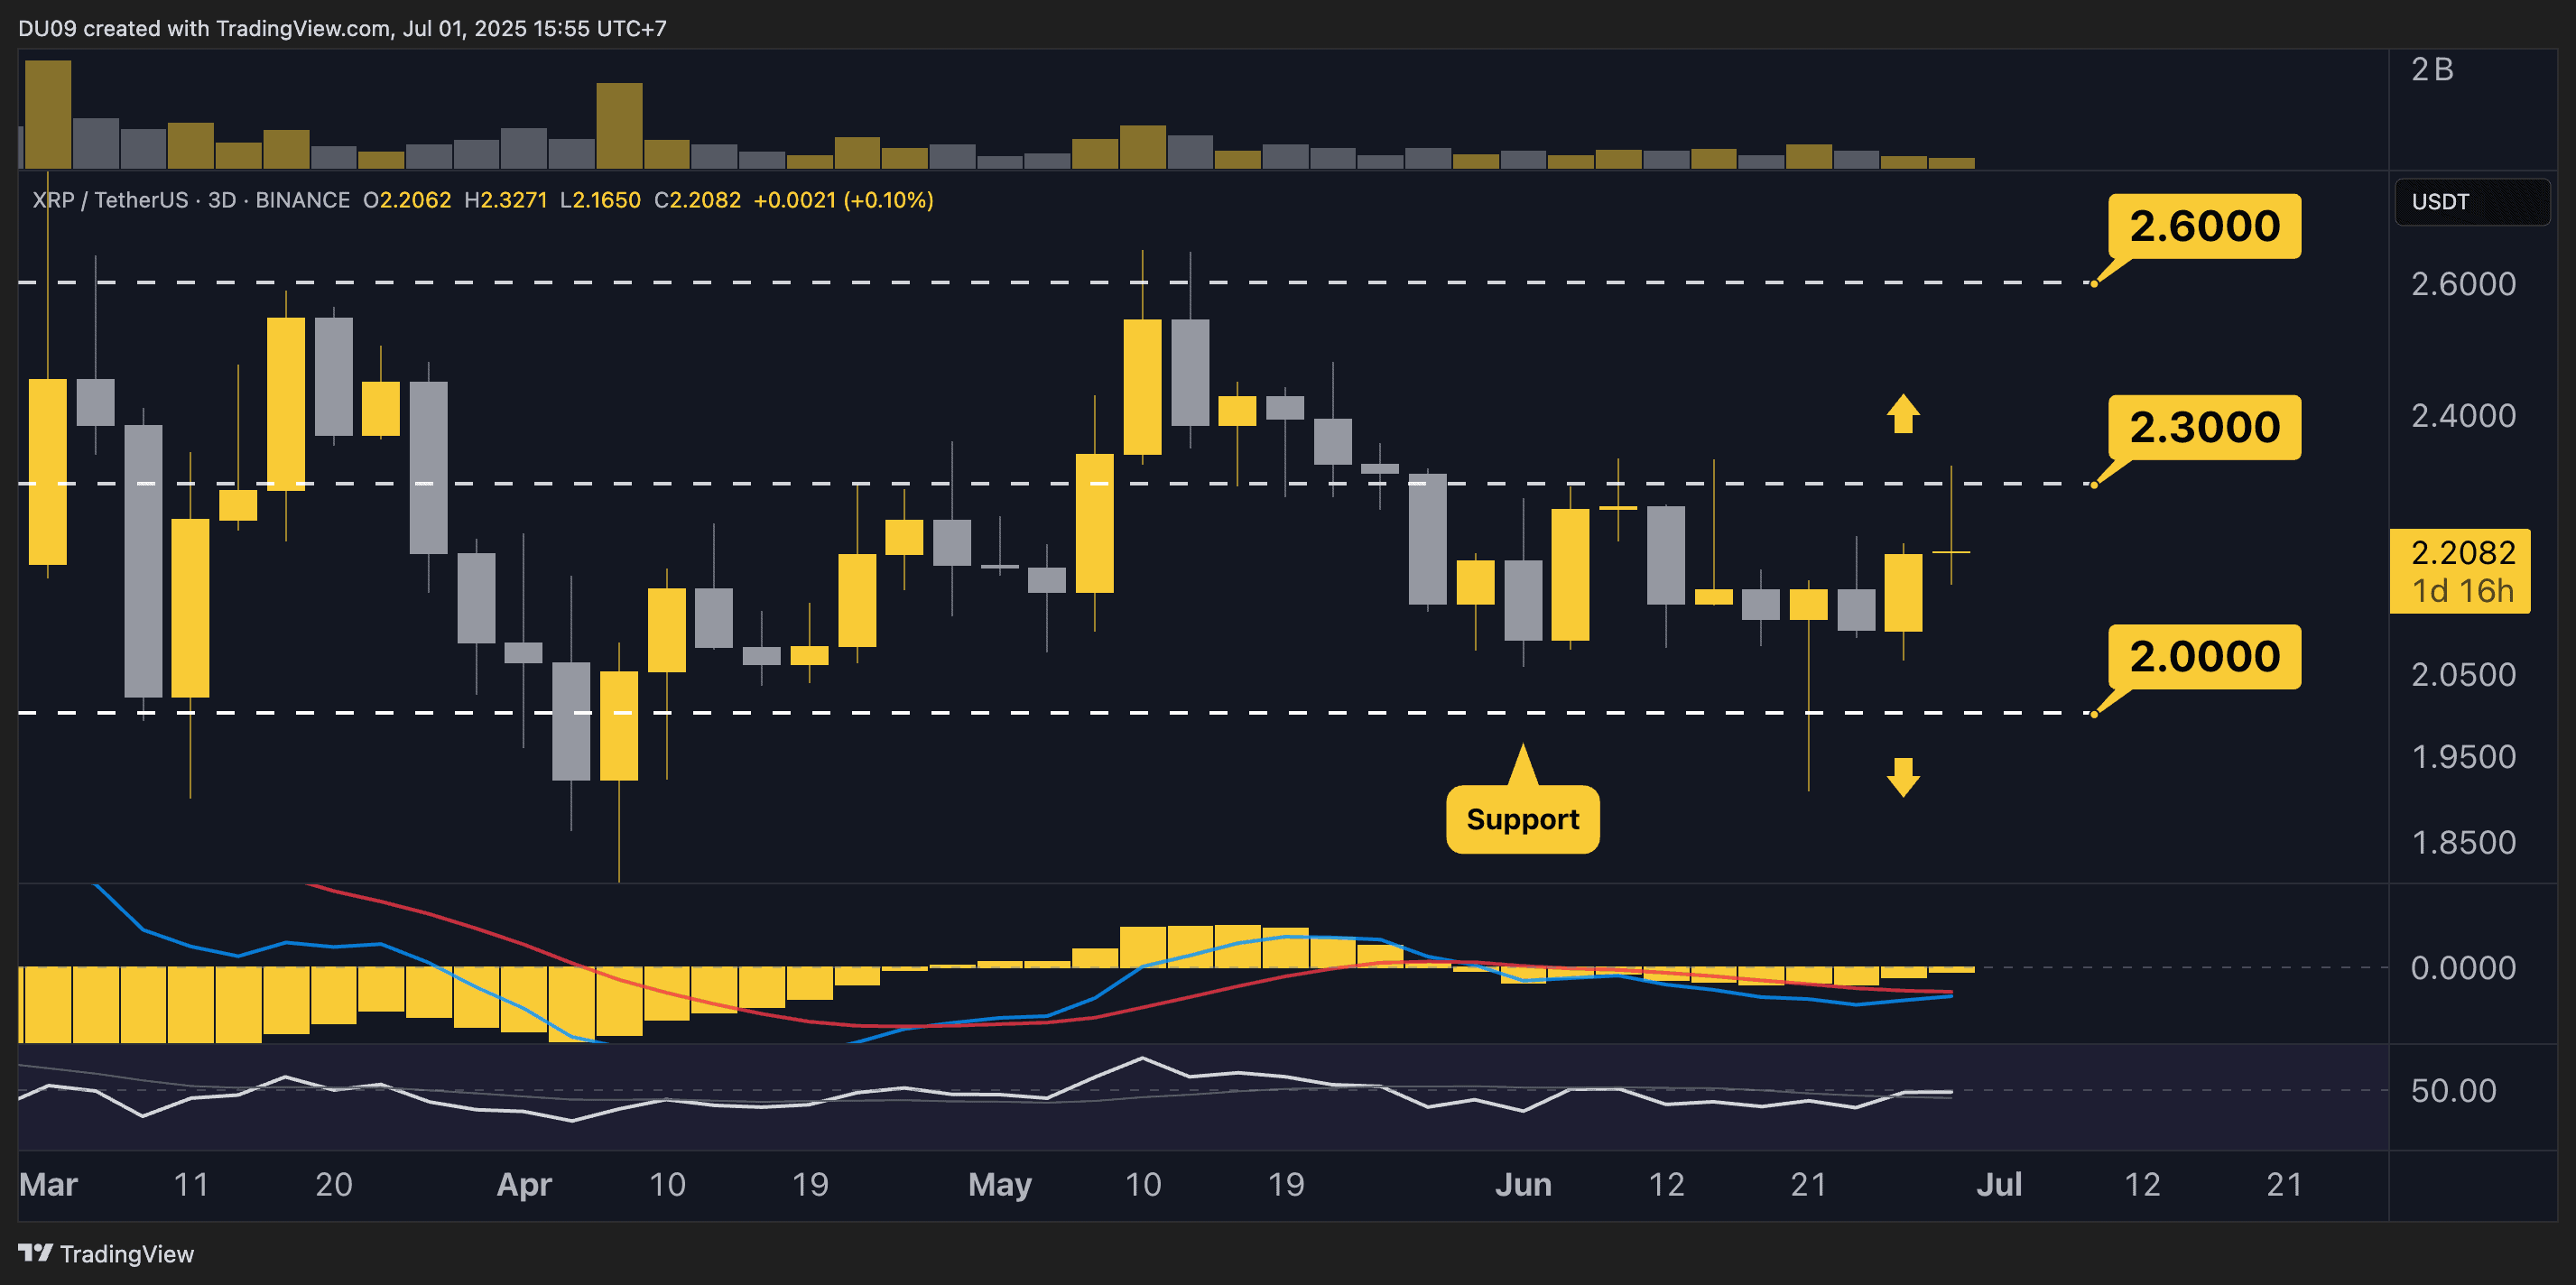
XRP is testing the resistance at $2.3. Will it break?
Key Support levels: $2
Key Resistance levels: $2.3, $2.6, $3
1. Key Resistance Under Pressure
Yesterday, buyers pushed XRP to the key resistance at $2.3, but sellers returned to stop a breakout. At the time of this post, the price is in a pullback. Nevertheless, this is a positive sign that shows buyers are returning. If this bullish momentum intensifies, then $2.3 could fall and be followed by a test of $2.6 next.

2. Optimism Returns
With the price keen on making higher highs, optimism is returning to this cryptocurrency. This can be seen on the volume profile where buyers have dominated in the last few days. A break above $2.3 will likely see the volume spike and allow further price expansion into new highs.
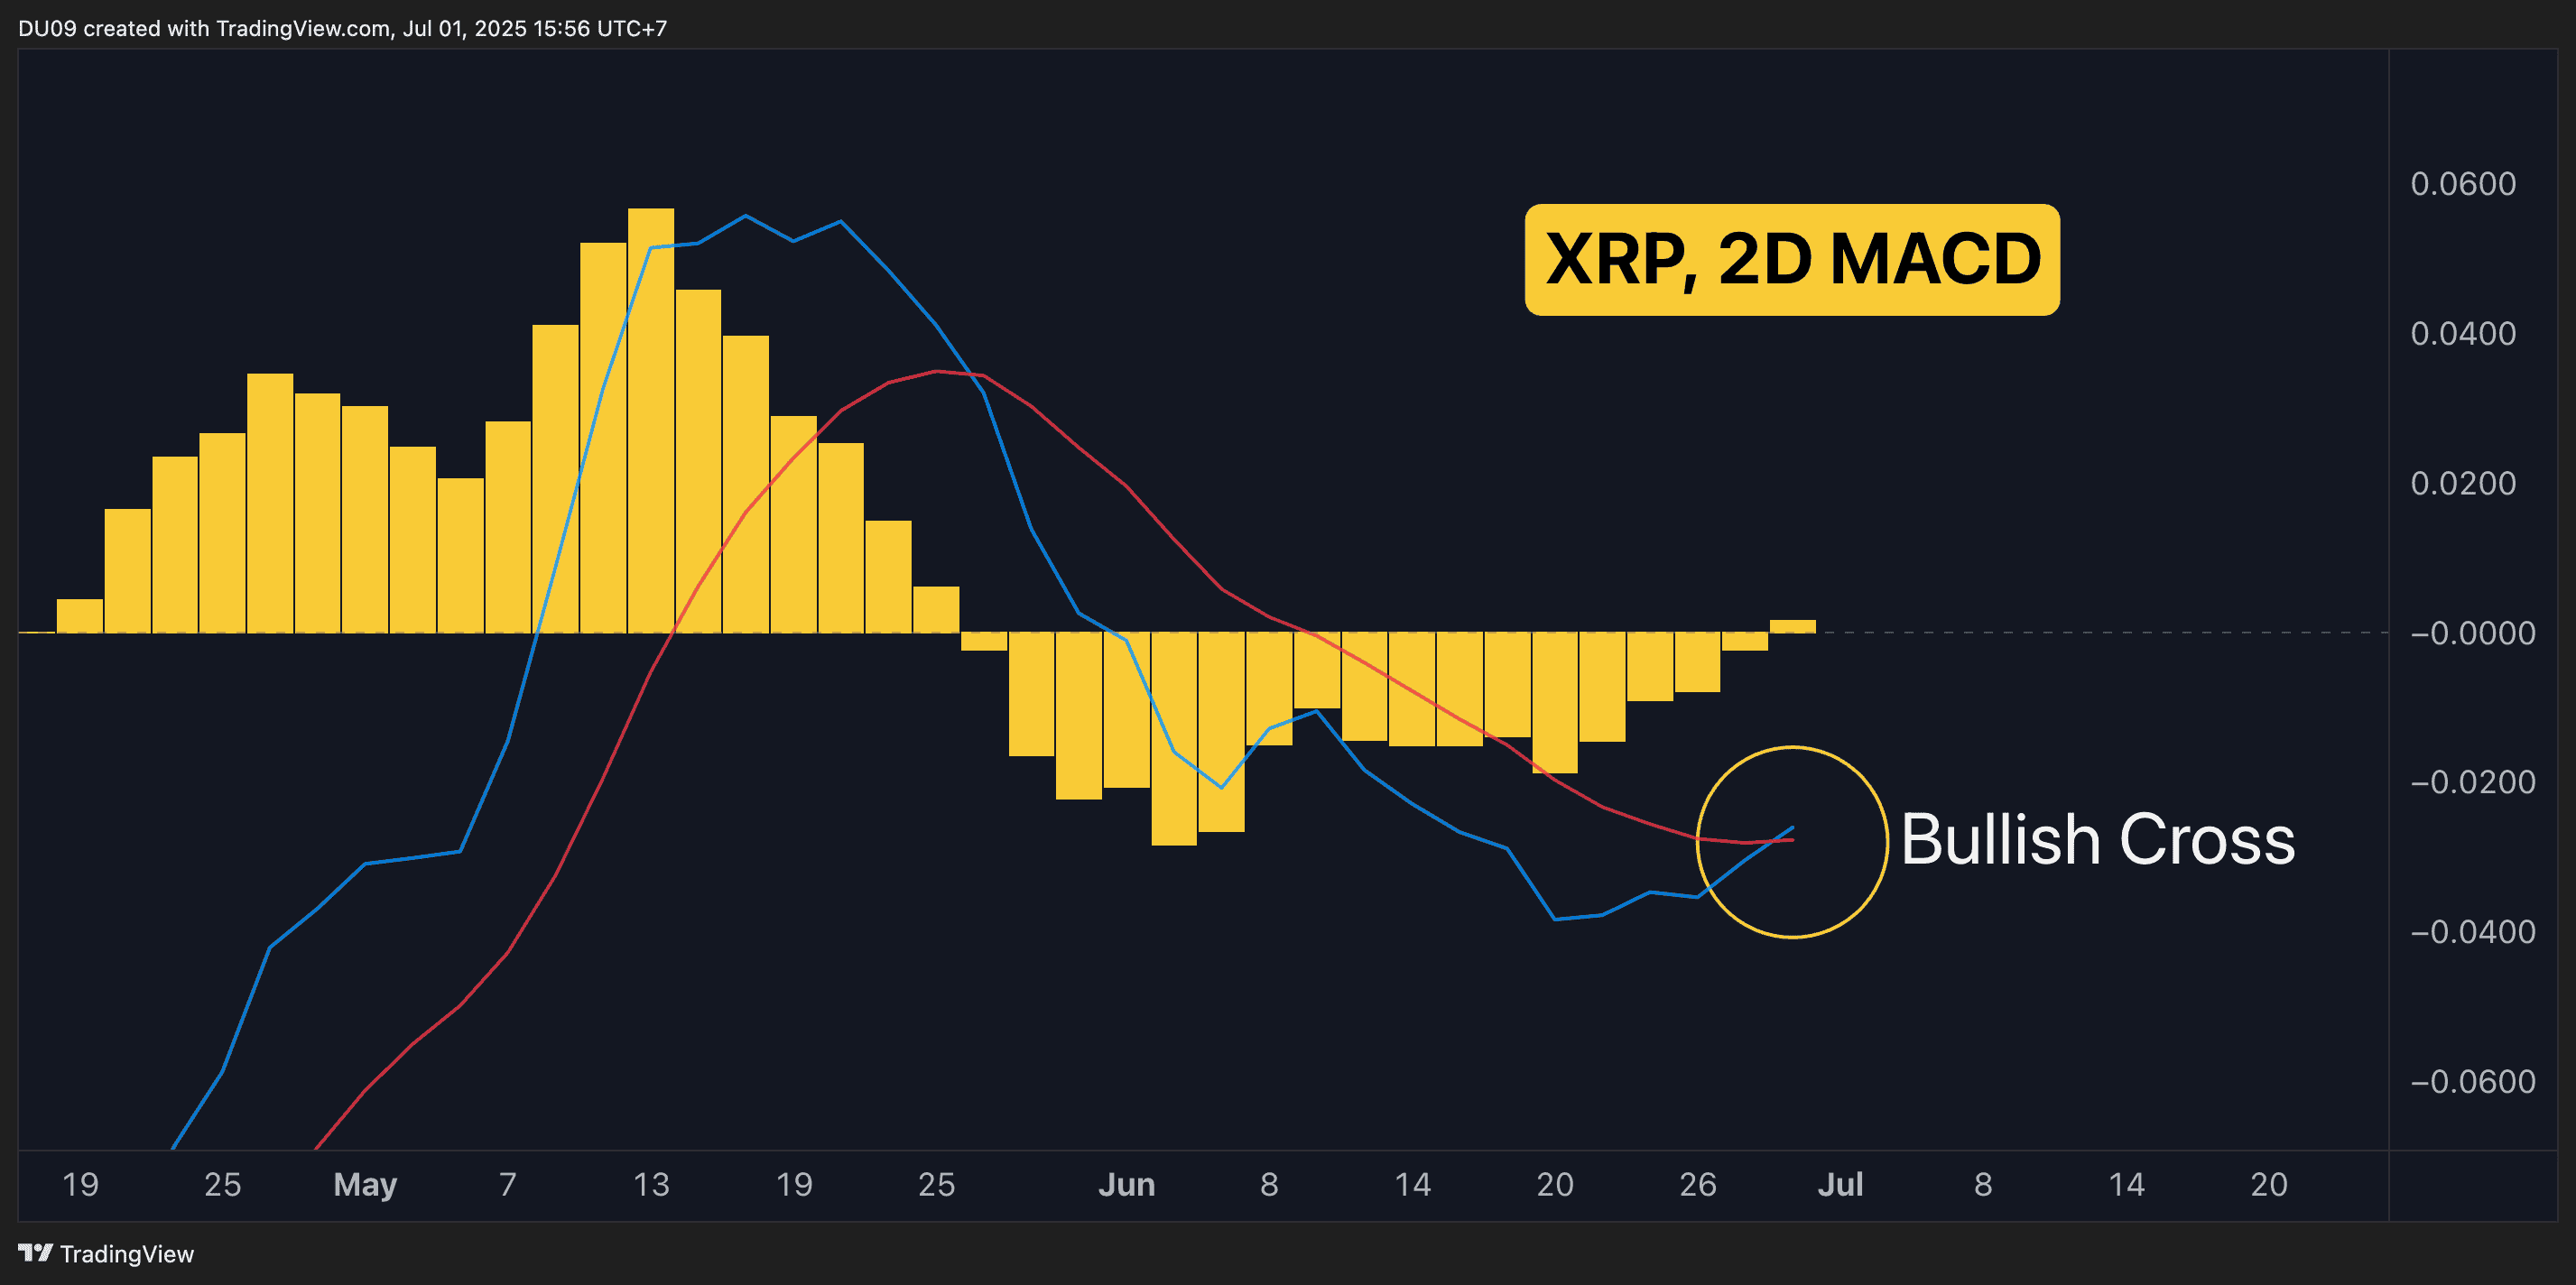
3. MACD Turning Bullish
After the daily MACD turned positive last week, the 2-day MACD has also turned bullish today. This shows that the buy momentum is slowly creeping into higher timeframes which will build confidence in the price action and attract more buyers. With a positive feedback loop in action, XRP has a good shot at $2.6 or even higher in July.
Binance Free $600 (CryptoPotato Exclusive): Use this link to register a new account and receive $600 exclusive welcome offer on Binance (full details).
LIMITED OFFER for CryptoPotato readers at Bybit: Use this link to register and open a $500 FREE position on any coin!
Cryptocurrency
Bitcoin Traders Wait Important Economic Announcements Today, These Altcoins Plummet (Market Watch)

Bitcoin’s price has retraced by a slight 0.9% in the past 24 hours as traders are expecting a few important economic events during today’s session.
Meanwhile, the broader cryptocurrency market is also reflecting the uncertainty as the majority of altcoins are trading in the red with some charting a lot bigger declines than others.
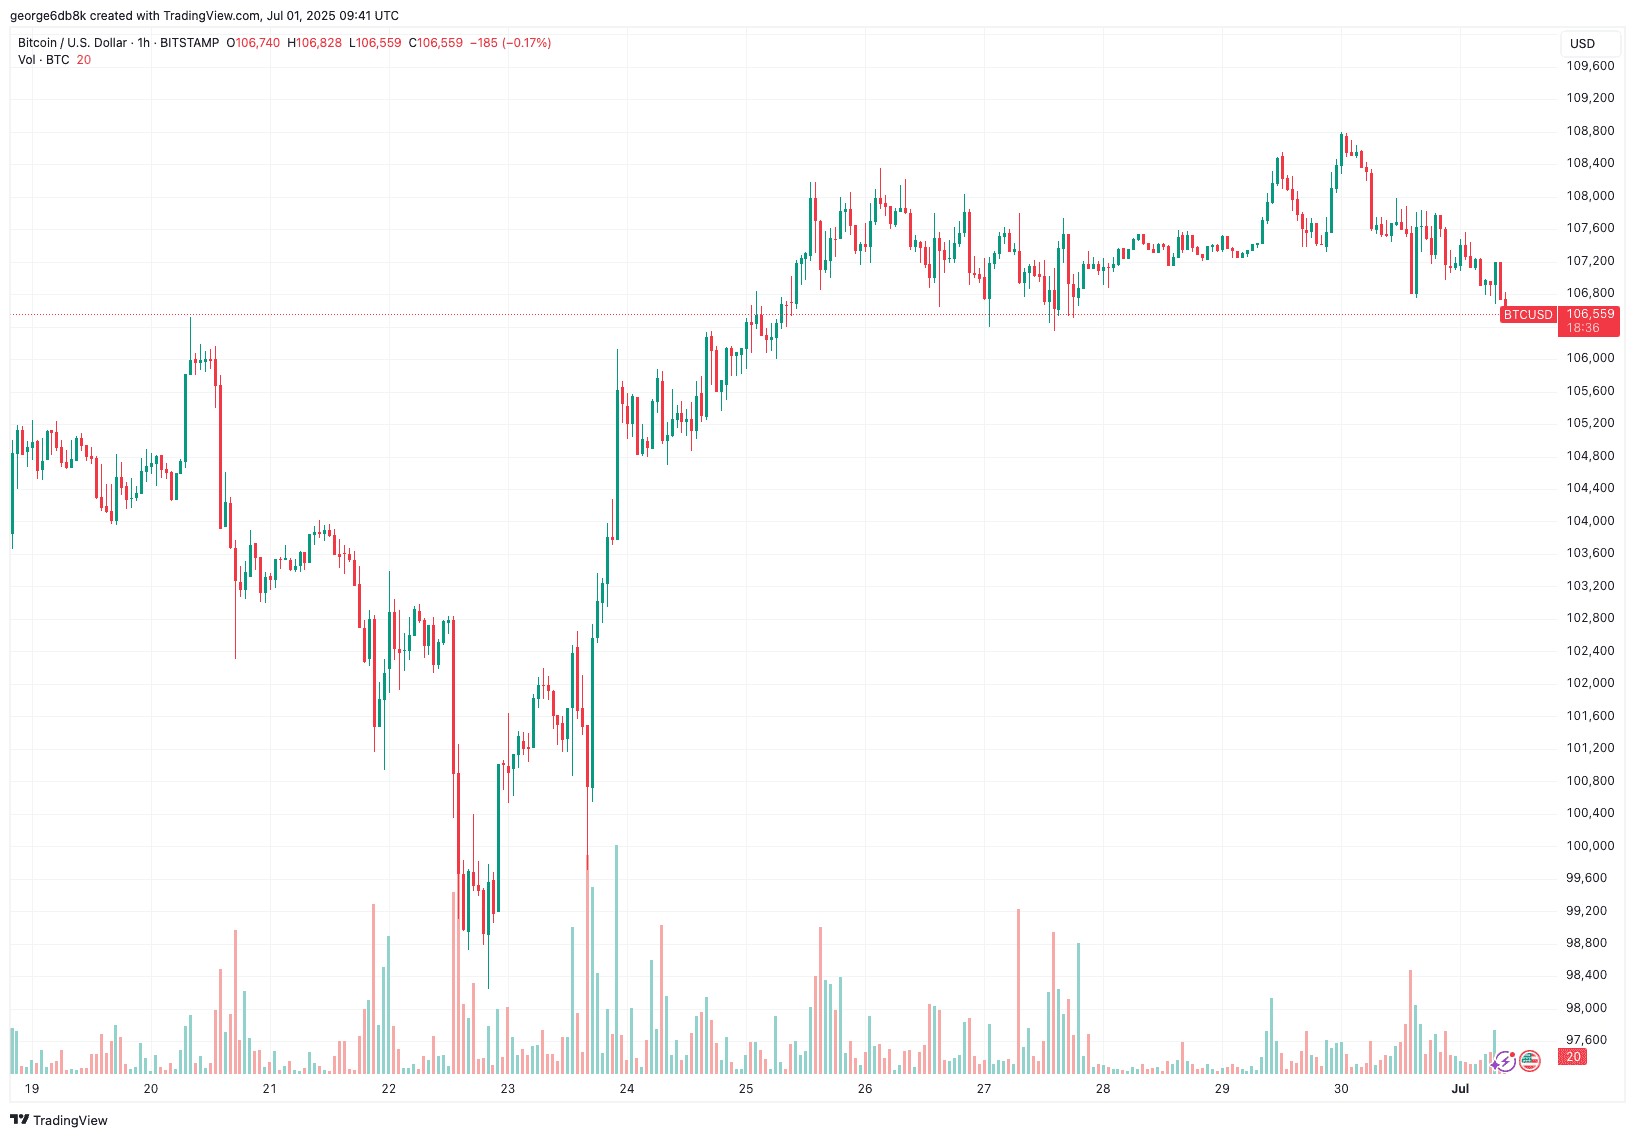
Bitcoin Price Waits for News
The deep involvement of corporate Bitcoin buyers and institutions has surely played a major role in its price increase over the past year but it’s also the reason why the crypto market has been largely correlated to traditional ones.
A few years ago, literally nobody cared about metrics such as CPI, PMI, and whatnot, but now every crypto trader has them on their watchlist.
As such, today is also shaping up to be a volatile experience with a few important economic events on the calendar.
First, Jerome Powell will speak in the afternoon, followed by data for job openings, PMI, and ISM manufacturing – all indicators that shape policymaking, especially when gauging the strenght of the local economy.
That said, Bitocin’s price is down about 1% on the day and is currently trading at around $106,500 after having tested $109,000 yesterday. It’s interesting to see if the bulls have it in them to push bakc towards the upper boundary of the recent trading range or if the bears will send the price back below $105K.
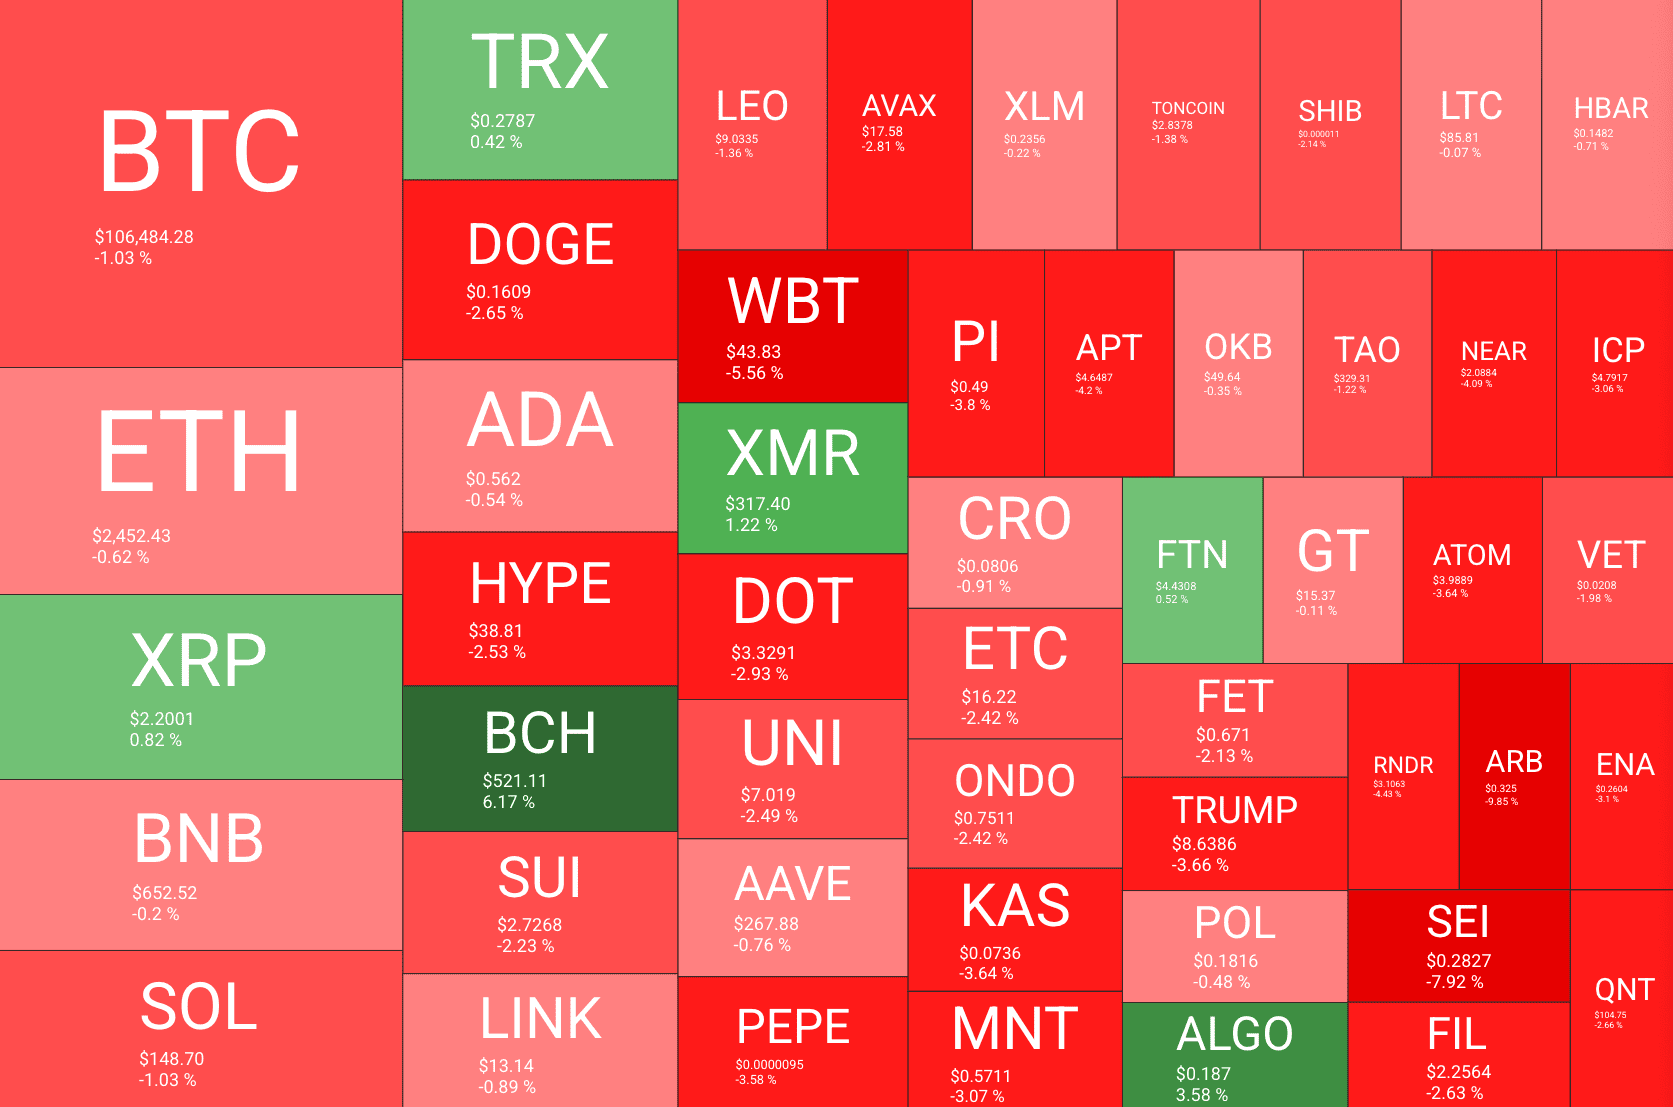
Altcoins in Red, Some More Than Others
As you can clearly see in the heatmap below, the altcoins are also not having a great day. This is, perhaps, to be expected – Bitcoin’s dominance over the market has been rising gradually over the past many months and whenever BTC slips, altcoins crash.
The past 24 hours have hardly been a crash, though, but it’s clear that most of them are charting more considerable declines.
This is especially true for TKX, ARB, SPX6900, SEI, and others, that are down between 8% and 15% on the day.
Believe it or not, Bitcoin Cash (BCH) is today’s best performer, gaining more than 6%. Who would have thought?
Binance Free $600 (CryptoPotato Exclusive): Use this link to register a new account and receive $600 exclusive welcome offer on Binance (full details).
LIMITED OFFER for CryptoPotato readers at Bybit: Use this link to register and open a $500 FREE position on any coin!
Disclaimer: Information found on CryptoPotato is those of writers quoted. It does not represent the opinions of CryptoPotato on whether to buy, sell, or hold any investments. You are advised to conduct your own research before making any investment decisions. Use provided information at your own risk. See Disclaimer for more information.
Cryptocurrency charts by TradingView.
TL;DR
- The expert advises monthly investments in SPY and BTC for long-term success.
- The leading cryptocurrency is up 6% this week and trades near $108,000. Analysts are split – some see a breakout to $130K – $200K if key resistance levels are cleared, while others warn of a possible drop to $100K or even $95K if momentum fades.

‘Trading is the Wrong Path’
Besides its fundamentals and ability to transform the global financial system, Bitcoin (BTC) has proven to be an excellent investment opportunity.
At least, that was the case in the past few years: the asset went through multiple bear and bull markets to eventually cross the $100,000 mark. Currently, it trades at around $108,000 (according to CoinGecko’s data), representing a 75% increase on a yearly scale and a substantial 43,000% jump compared to its valuation a decade ago.
But does the leading cryptocurrency remain a good investment after this major rally over the years, and how much should people allocate to it? That’s a question many people are trying to figure out.
It seems that there isn’t a direct answer, and it all depends on the risk profile of the investors, as well as other important factors. However, one can turn to certain experts who are experienced enough to give guidance.
An example is the veteran trader Peter Brandt, who recently suggested that approximately 95% of people fail when trading. Instead, he advised them to excel in their regular jobs, prioritize their families, and invest in homeownership. Last but not least, Brandt recommended making monthly investments, allocating 80% of the amount to SPY (the ETF that tracks the S&P 500 Index) and 20% to BTC.
Trading is the wrong path for 95% of ppl
Most would be better off becoming excellent at a day job (engineer, plumber, welder, vet, sales)
Live economically
Get married, have kids
Buy a twin home – rent out one of them
Invest monthly – 80% in $SPY and 20% in Bitcoin— Peter Brandt (@PeterLBrandt) June 29, 2025
The Next Potential Targets
Let’s now take a closer look at BTC’s recent performance and explore its chances for a further pump in the short term. The asset has increased in value by approximately 6% over the past week, with numerous analysts predicting a surge to a new all-time high if certain conditions are met.
The X user Cipher X believes “a strong weekly close” above $107,720 could open the door to a further rally to as high as $130,000-$135,000 in Q3 2025.
“Just look at Q4 2024 chart and you’ll see what happened when BTC had its biggest weekly close,” they added.
Merlijn The Trader thinks the final pump for this bull run is coming, envisioning a fresh ATH of around $200,000 towards the end of the year. At the same time, he advised investors to take profits, anticipating a drastic pullback to $95,000 shortly after that.
On the contrary, Ali Martinez argued that the cryptocurrency currently faces a key rejection while the stochastic RSI flashes a death cross on the daily chart. The analyst thinks a plunge to $100,000 is not out of the question unless “we get a sustained close” above $109,000.
Binance Free $600 (CryptoPotato Exclusive): Use this link to register a new account and receive $600 exclusive welcome offer on Binance (full details).
LIMITED OFFER for CryptoPotato readers at Bybit: Use this link to register and open a $500 FREE position on any coin!

 Forex3 years ago
Forex Today: the dollar is gaining strength amid gloomy sentiment at the start of the Fed’s week
- Forex3 years ago
Unbiased review of Pocket Option broker
- Forex3 years ago
Dollar to pound sterling exchange rate today: Pound plummeted to its lowest since 1985
- Forex3 years ago
How is the Australian dollar doing today?
- Cryptocurrency3 years ago
What happened in the crypto market – current events today
- World3 years ago
Why are modern video games an art form?
- Commodities3 years ago
Copper continues to fall in price on expectations of lower demand in China
- Economy3 years ago
Crude oil tankers double in price due to EU anti-Russian sanctions


