Cryptocurrency
Shrimpers are sweeping BTC off the market faster than at the peak of the 2017 bull market
In cryptocurrency slang, shrimpers are holders who have less than 1 BTC in their wallet. Right now, the number of shrimpers in the market is growing as fast as possible. Even at the peak of the historic bull market in late 2017, they weren’t arriving in such numbers.
Shrimp are near the bottom of bitcoin’s joke food chain, just above plankton. The lowest kind of cryptocurrency organisms are holders with less than 0.05 BTC. This is not the only classification of bitcoin holders, but it gives an idea of the size and importance of the various market participants.
Bitcoin shrimp are gaining ground
Previously, the number of small bitcoin addresses is steadily growing despite a deep correction in the market. The number of wallets with balances of over 0.01 BTC and over 0.1 BTC has been steadily increasing since early 2021.
However, this trend accelerated in mid-June 2022. During previous market cycles, such dynamics in the bitcoin network indicated a bull market acceleration. In contrast, during major market corrections, onchain analysis generally indicated a slight increase, stagnation, or even a decrease in the number of addresses with a balance of less than 0.1 BTC.
Well-known analyst in cryptocurrency circles @WClementeIII tweeted a 90-day graph of changes in the number of coins in the hands of small holders (no more than 1 BTC in the wallet). It shows the strong growth of bitcoins in shrimp wallets. The current values have left behind the levels of late 2017, when the market was dominated by bullish sentiment and the BTC exchange rate reached an all-time high of $20,000 at the time.
During that time, BTC managed to plummet to $69,000, fall 70% in price, and return to the landmark level of 2017. Bearish sentiment and extreme fear are in stark contrast to the euphoria and exorbitant greed that reigned over the market in late 2017. And yet the shrimpers are behaving just as they did then. Moreover, they are buying bitcoin even more willingly, believing that now is the right time to do so.
Why shrimp are buying BTC
The classic market axiom is that “retail is never right.” With 2017, it’s clear: Small investors were buying at the peak and big whales were dumping coins. They sold at the best possible time. But the situation is different now. Shrimp accumulates bitcoin in large quantities after it has already lost 70% of its value.
But there is a third possibility: the increase in the number of holders with a balance less than 1 BTC, does not indicate an influx of small private investors. It’s possible that people are simply splitting their investments, opening many wallets with small balances. This was pointed out by another well-known crypto analyst @woonomic. He wrote:
“Keep in mind that such data on the number of holders is extremely unstable and tends to be overly optimistic on short intervals. It takes a couple of years for the statistics to settle down. For example, it is assumed that small transactions are made by new people and then it turns out that they belong to an existing investor who has more than 1 BTC.”
Cryptocurrency podcast host @VentureCoinist, thinks the influx of shrimp is still a sign of an impending downturn.
“I’ll pretend I didn’t see what happened the last time this metric went up this much.”
Finally, another user @fusillifadi, posted data that seems to support Clemente’s assumption of organic shrimp growth. Citing data from cooper.co, he provided a graph of the average daily growth rate of wallets with balances under 1 BTC.
Since the end of 2021, year, we have seen a clear trend of shrimp growth that can only be compared to 2017. Although the last period of 2017 saw a much larger increase, the current numbers are ahead of the trend recorded in 2018-2021.
Shrimp buy bitcoins mostly from miners. In 2017, 49% of bitcoins sold by miners went to wallets with a balance of less than 1 BTC. In 2022, that figure rose to 75%. Other onchain statistics confirm the surrender of miners. Thus, we get the answer to the question of who supplies bitcoins to the shrimpers.


Michael Saylor’s Bitcoin-oriented brainchild has made another massive purchase, accumulating 4,225 BTC for $472.5 million.
Due to the cryptocurrency’s substantial price expansion in the past few years, Strategy now sits at a mindblowing unrealized profit of roughly $30 billion.
This is because the company has spent $42.87 billion to acquire its BTC stash of 601,550 bitcoins bought at an average price of $71,268 per unit. Given BTC’s price as of press time ($121,500), this puts Strategy’s fortune at over $73 billion.
Strategy has acquired 4,225 BTC for ~$472.5 million at ~$111,827 per bitcoin and has achieved BTC Yield of 20.2% YTD 2025. As of 7/13/2025, we hodl 601,550 $BTC acquired for ~$42.87 billion at ~$71,268 per bitcoin. $MSTR $STRK $STRF $STRD https://t.co/cdUkviddqp
— Michael Saylor (@saylor) July 14, 2025
Saylor hinted about this purchase yesterday, indicating that some weeks, “you don’t just HODL.” Recall that the company didn’t announce a new acquisition last week, which was somewhat surprising given its history since the US elections in November last year.
Strategy’s former CEO has also been particularly vocal on X about different BTC purchases from other companies. In the past few days alone, he has reposted the accumulations completed by the likes of Metaplanet, K33, DigitalX Ltd., Sequans, and the Blockchain Group.
The average price of Strategy’s latest purchase means that it was most likely completed in the middle of the previous week when BTC challenged $112,000. The asset has traded well beyond that level ever since Thursday.
Binance Free $600 (CryptoPotato Exclusive): Use this link to register a new account and receive $600 exclusive welcome offer on Binance (full details).
LIMITED OFFER for CryptoPotato readers at Bybit: Use this link to register and open a $500 FREE position on any coin!
Japanese investment firm Metaplanet has expanded its Bitcoin holdings with the purchase of 797 BTC, after spending approximately 13.8 billion yen, which is worth around $93 million.
The company acquired Bitcoin at an average price of around $117,000 per unit.
Aiming for “Escape Velocity”
Following the latest acquisition, Metaplanet currently holds 16,352 BTC, equivalent to approximately $1.64 billion. It maintains its position as the world’s fifth-largest publicly traded corporate BTC holder, according to data shared by BitcoinTreasuries. The accumulation now comes just a week after the Tokyo-listed company purchased 2,205 BTC.
The firm, which shifted from hotel operations to Bitcoin treasury management last year, has been accelerating its accumulation strategy amid rising institutional interest in crypto assets. Metaplanet has set an ambitious target to control over 210,000 BTC by 2027, which is around 1% of the total Bitcoin supply.
Metaplanet had previously revealed its plans to leverage its growing Bitcoin reserves to acquire cash-generating businesses, even potentially including a digital bank in Japan.
Last week, Gerovich told the Financial Times that the company is racing to accumulate as much BTC as possible, while describing it as a “Bitcoin gold rush” to reach “escape velocity” and maintain a lead over competitors. The exec also said that he would never sell the crypto asset.
“We think of it as a Bitcoin gold rush. We need to accumulate as much Bitcoin as we can to get to a point where we have reached escape velocity, and it just makes it very difficult for others to catch up.”
Metaplanet’s Ambitious Bitcoin Plan
In its next phase, Metaplanet aims to use the crypto asset as collateral to access financing, similar to how securities or government bonds are used. The goal will be to deploy these funds to buy profitable businesses aligned with its strategy. While crypto-backed lending remains rare in traditional banking, experiments like Standard Chartered’s pilot with OKX suggest growing institutional interest.
Gerovich ruled out issuing convertible debt to fund growth, preferring options like preferred shares to avoid repayment tied to volatile share prices. The firm said that it envisions digital banking services as a future area of expansion, and aims to deliver superior retail banking options in Japan using its BTC-backed leverage.
Binance Free $600 (CryptoPotato Exclusive): Use this link to register a new account and receive $600 exclusive welcome offer on Binance (full details).
LIMITED OFFER for CryptoPotato readers at Bybit: Use this link to register and open a $500 FREE position on any coin!

Bitcoin has officially entered price discovery once again, trading just below $122,000 at the time of writing. After months of consolidation and multiple failed breakout attempts, the bulls have finally regained full control.
The breakout above the previous all-time high around $112,000 was followed by explosive momentum, and investors are wondering how much further BTC will run.
By ShayanMarkets
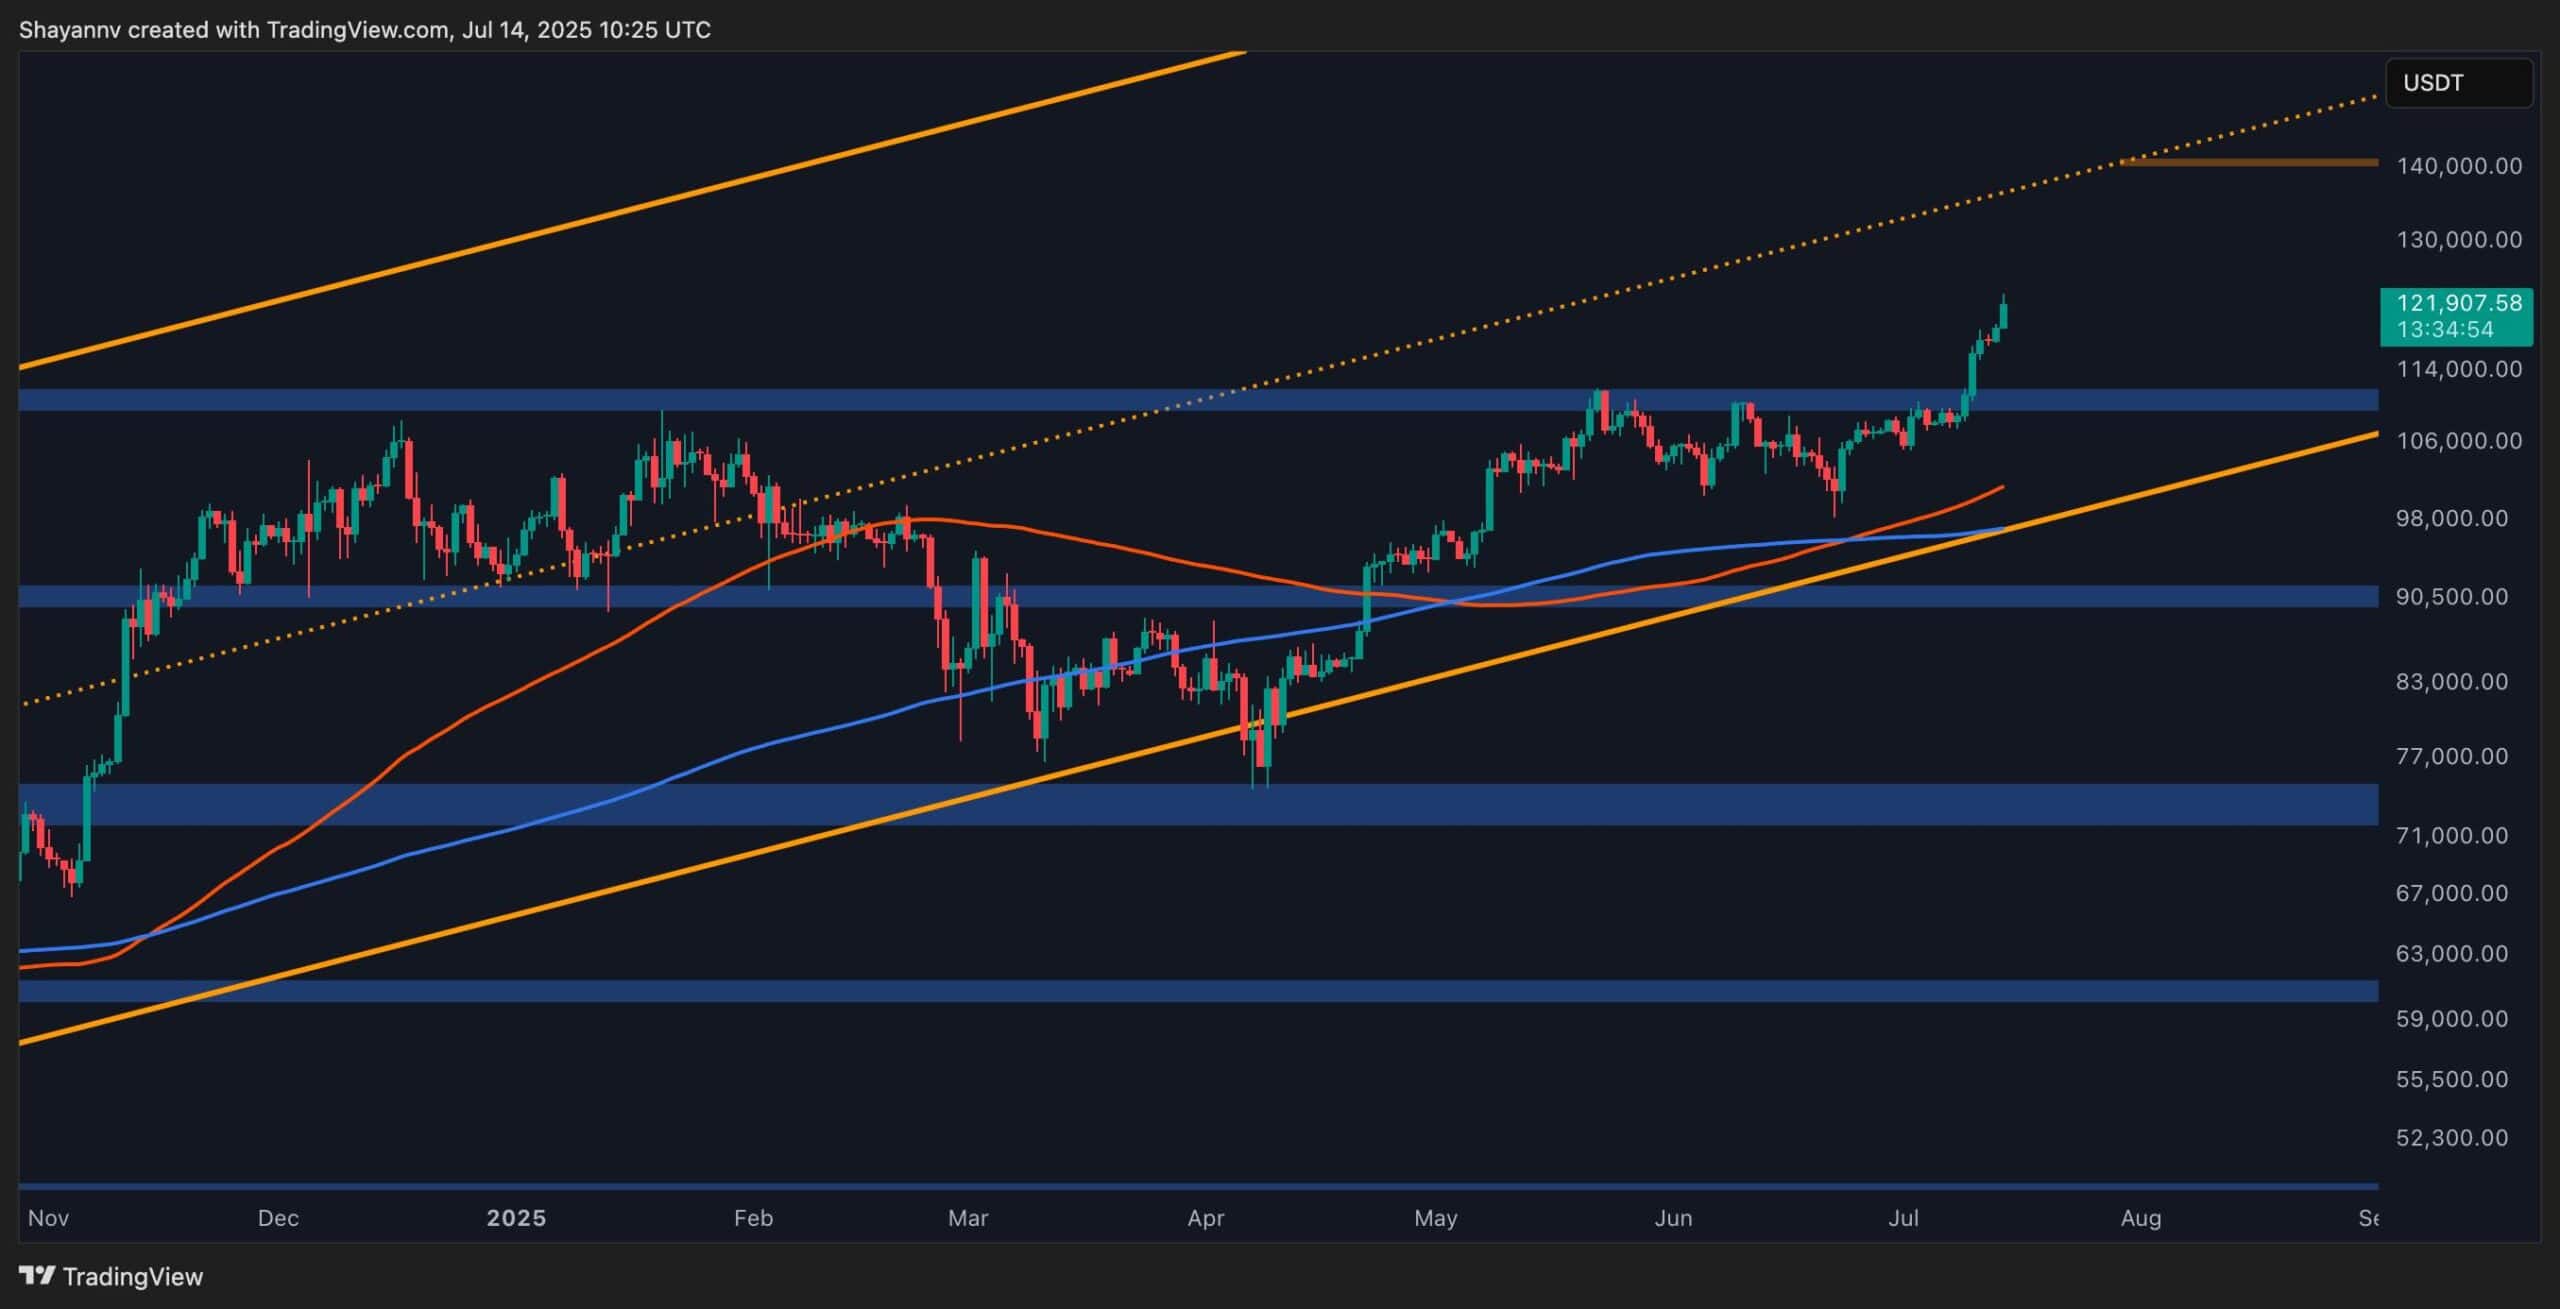
The Daily Chart
The daily chart shows that the asset is still respecting the long-term ascending channel, as it rebounded from its lower boundary and is currently rallying toward the mid-line. The price decisively closed above the $112,000 previous all-time high, a level that acted as a distribution zone for over a month. Following this breakout, BTC printed several bullish continuation candles, pushing all the way up to $122,000.
Yet, a retracement into the $114K–$117K zone is probable to cool the market down. This pullback would not invalidate the bullish structure but instead offer a healthier continuation setup. As long as the price holds above the $114K breakout level, the medium-term structure remains strongly bullish.
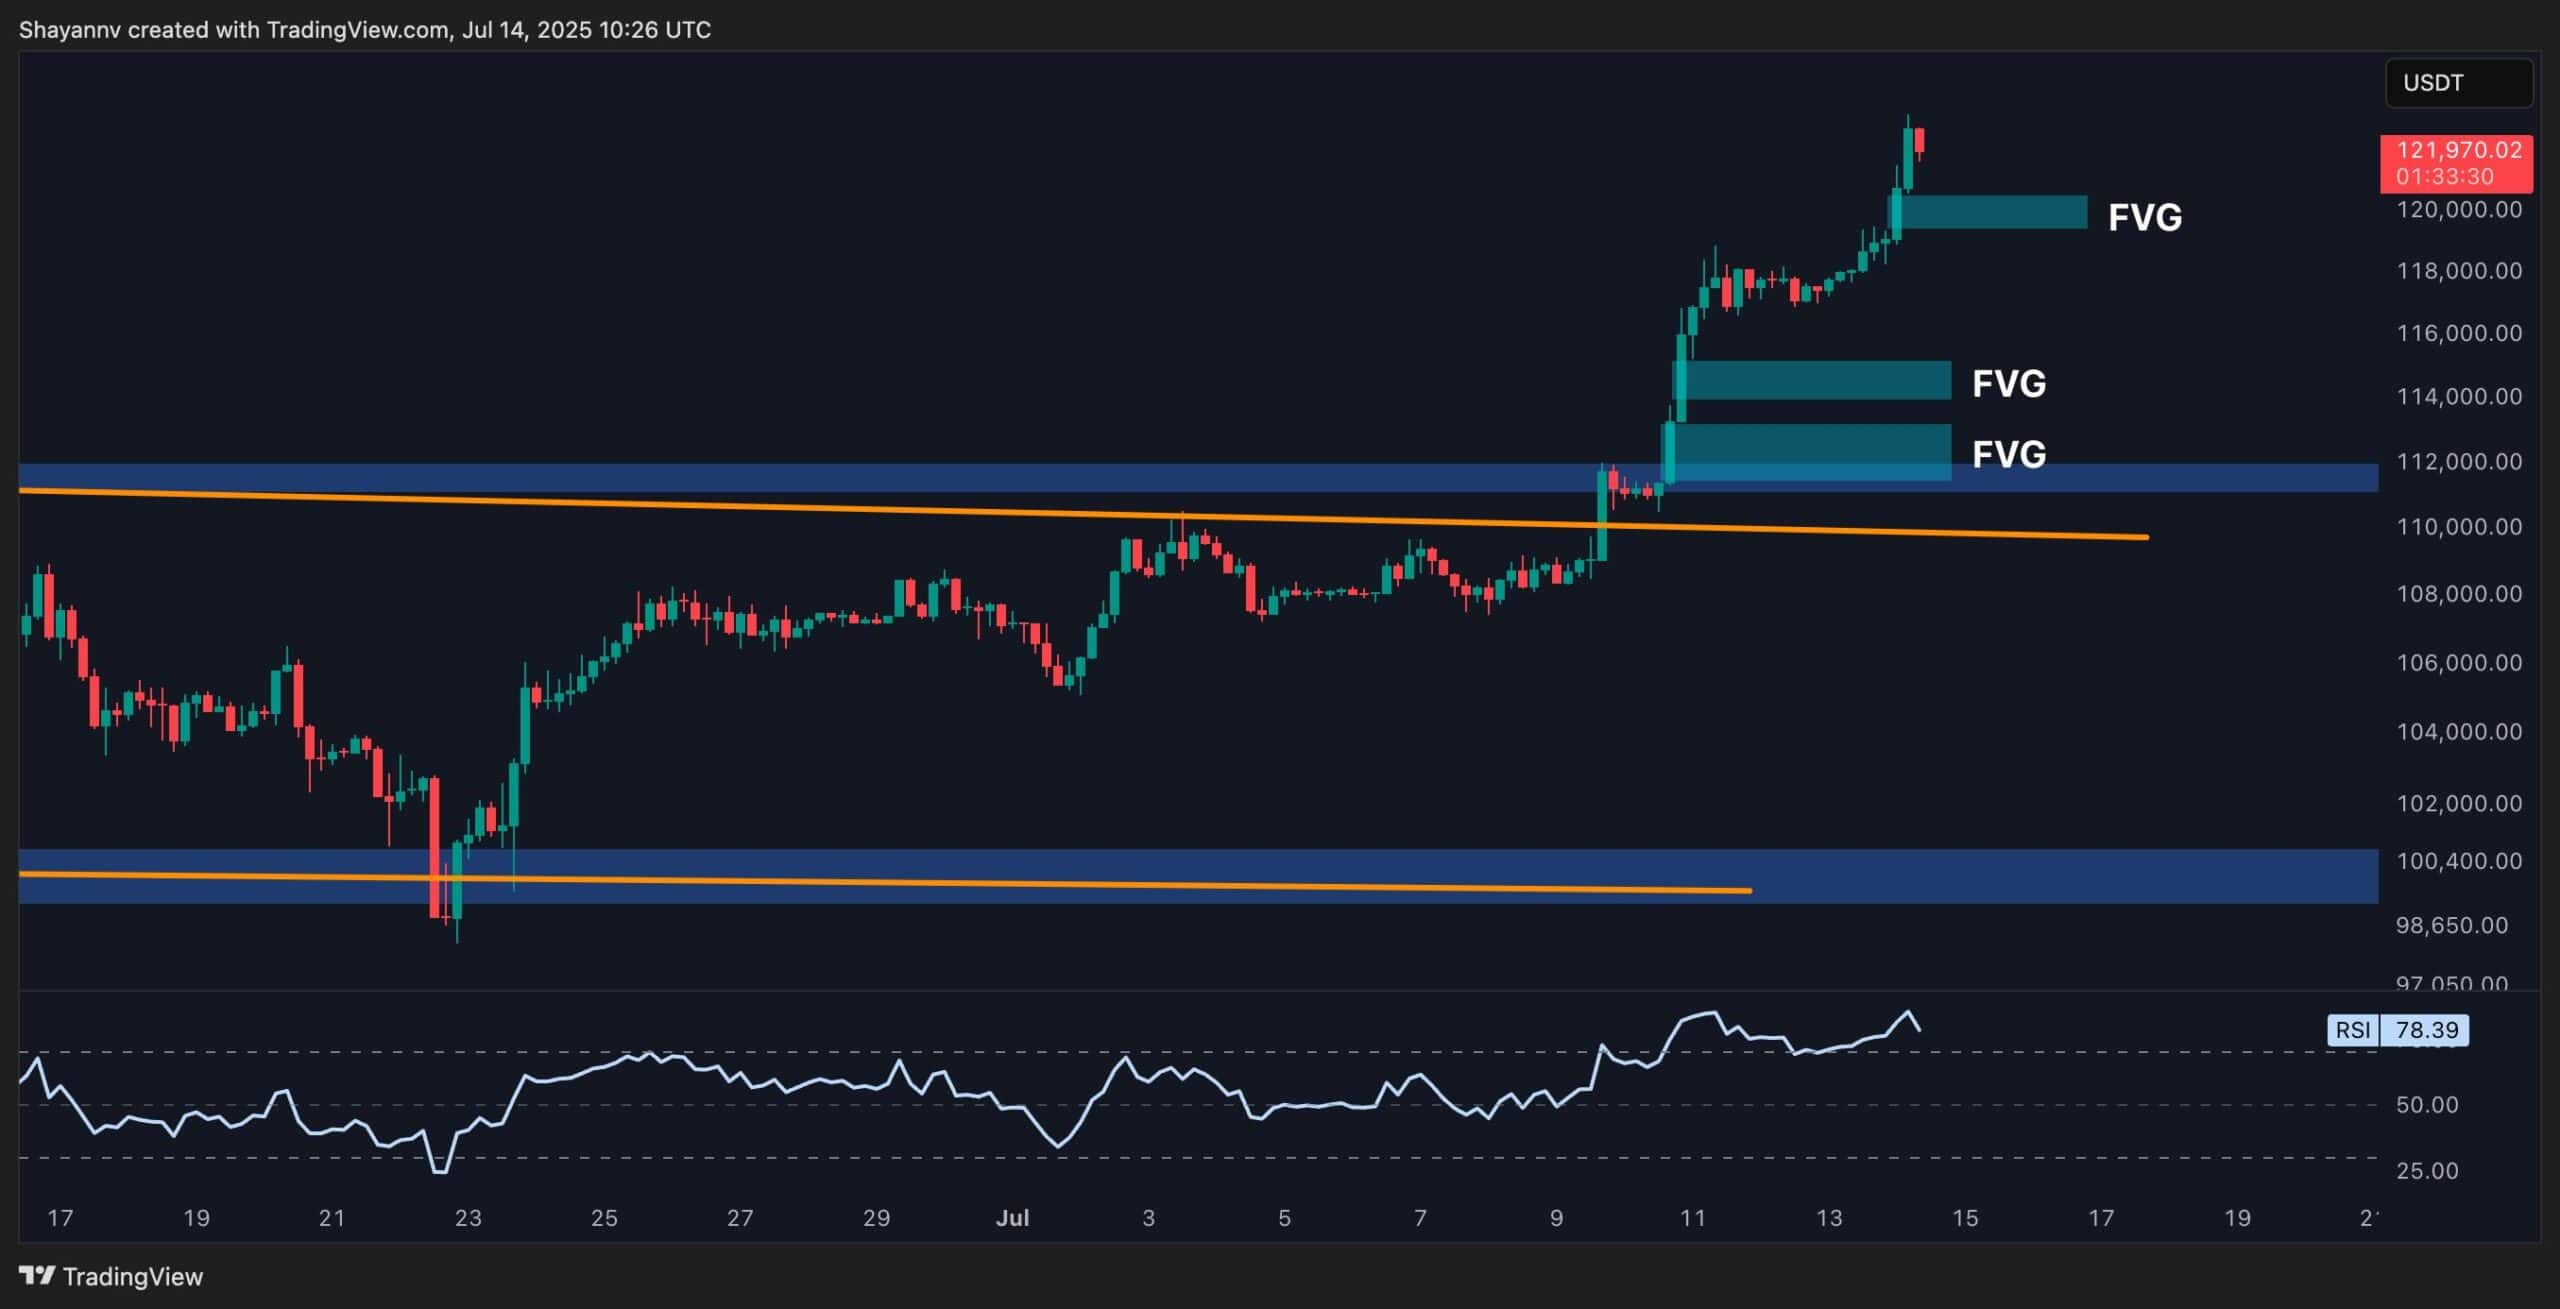
The 4-Hour Chart
The 4H chart shows a clean breakout from the recent range and a near-vertical price expansion, confirming the daily momentum. After breaking above the descending channel, Bitcoin formed a strong impulsive leg. As a result, the RSI is now extremely elevated at 78+, hinting at potential short-term exhaustion.
The 4H chart also highlights the newly formed Fair Value Gaps stacked below the price, which could get revisited in the coming sessions or days. These FVGs can both attract the price and act as potential support. As long as BTC remains above the 114K block, short dips into this region would be considered bullish retests.
Moreover, if the price begins to range around the 121K–122K area, it would allow RSI to cool off and provide fresh momentum for the next breakout, without experiencing much correction.
Sentiment Analysis
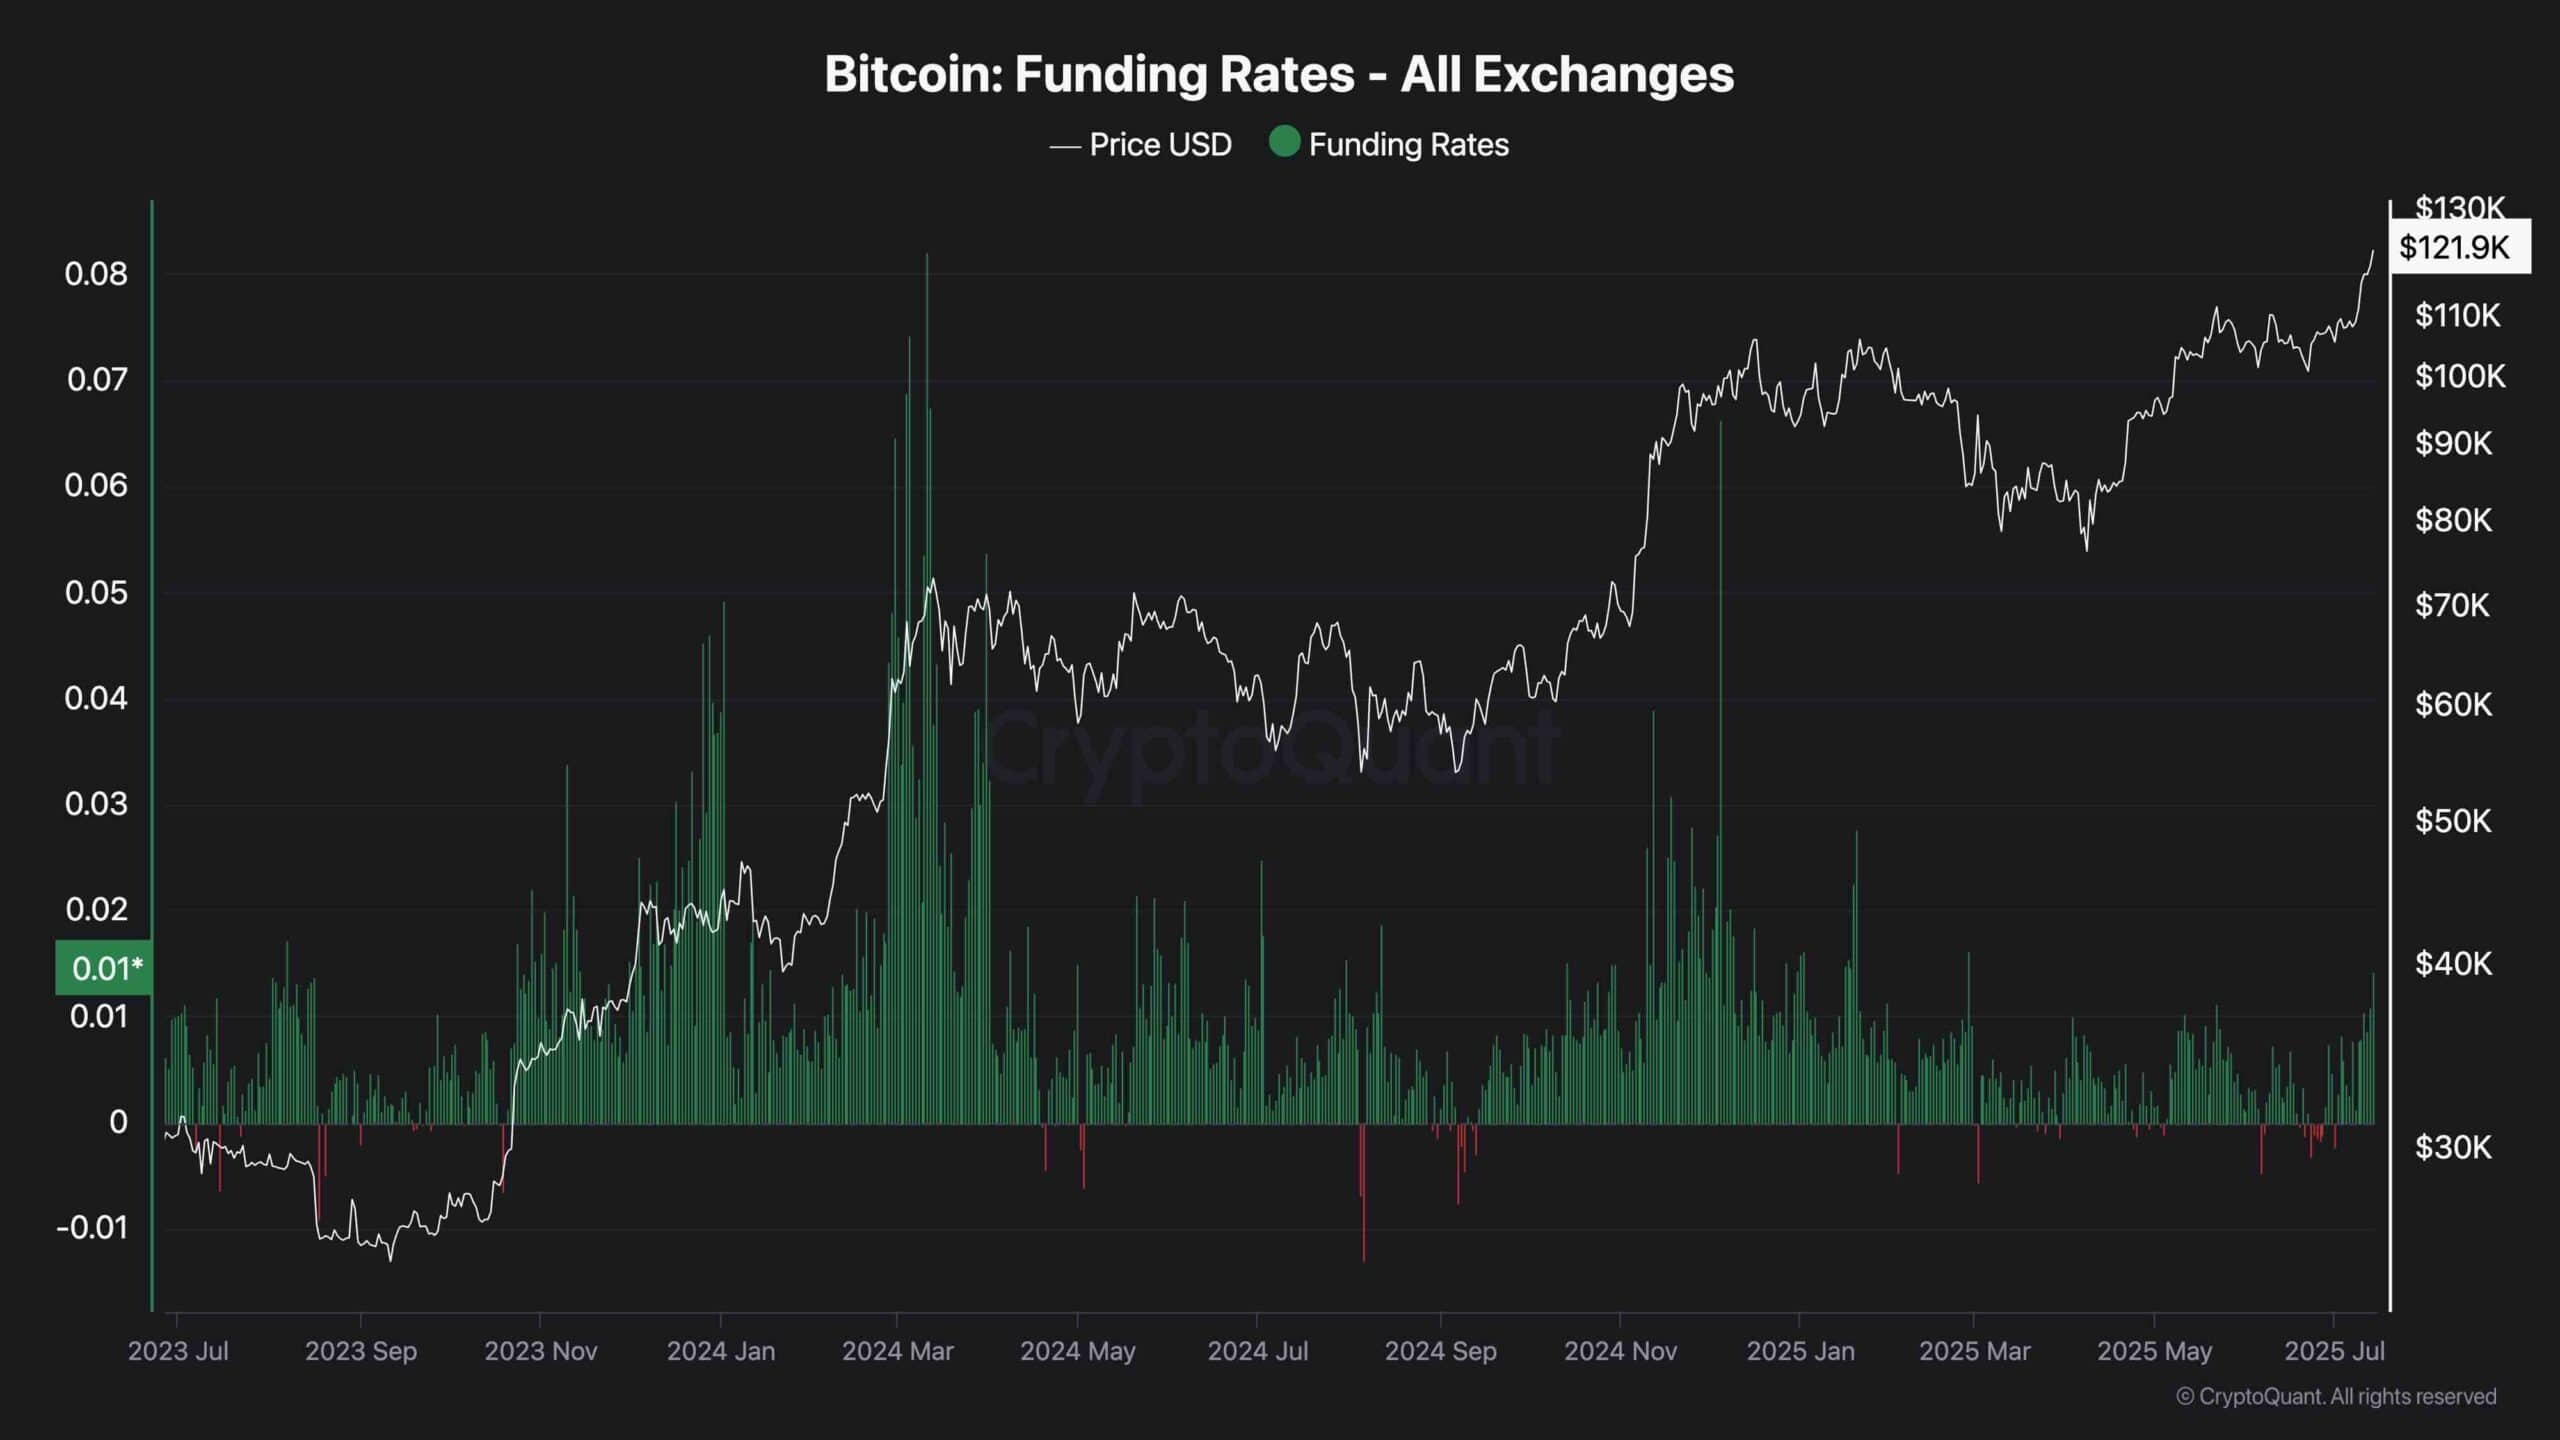
Bitcoin Funding Rates
Funding rates have started to spike again, reflecting the surge in long-side leverage after the breakout. This sharp uptick in funding confirms that traders are aggressively chasing the move. While elevated funding is expected during trend continuations, it also introduces risk: the higher the leverage imbalance, the more vulnerable the market becomes to a flush.
Historically, when funding remains excessively positive while prices stall or consolidate, it often leads to a liquidation-driven pullback. So far, we haven’t seen aggressive spikes like those in Q1 2024, but it’s something to monitor closely.
If the asset fails to push higher while funding stays elevated, a quick shakeout into the 114K zone is possible. Until then, the sentiment remains bullish but slightly overheated, which aligns with current RSI readings and market structure.
Binance Free $600 (CryptoPotato Exclusive): Use this link to register a new account and receive $600 exclusive welcome offer on Binance (full details).
LIMITED OFFER for CryptoPotato readers at Bybit: Use this link to register and open a $500 FREE position on any coin!
Disclaimer: Information found on CryptoPotato is those of writers quoted. It does not represent the opinions of CryptoPotato on whether to buy, sell, or hold any investments. You are advised to conduct your own research before making any investment decisions. Use provided information at your own risk. See Disclaimer for more information.
Cryptocurrency charts by TradingView.

 Forex3 years ago
Forex Today: the dollar is gaining strength amid gloomy sentiment at the start of the Fed’s week
- Forex3 years ago
Unbiased review of Pocket Option broker
- Forex3 years ago
Dollar to pound sterling exchange rate today: Pound plummeted to its lowest since 1985
- Forex3 years ago
How is the Australian dollar doing today?
- Cryptocurrency3 years ago
What happened in the crypto market – current events today
- World3 years ago
Why are modern video games an art form?
- Commodities3 years ago
Copper continues to fall in price on expectations of lower demand in China
- Economy3 years ago
Crude oil tankers double in price due to EU anti-Russian sanctions


