Cryptocurrency
Spot Bitcoin ETF Inflows Equal March Record as BTC Price Heads for $69K
Spot Bitcoin ETFs had some hard times at the end of April and especially on May 1, but the trend has changed now with 10 consecutive days of positive flows.
This comes as BTC’s price went on a rollercoaster propelled by the news surrounding the Ethereum ETFs, but the asset now heads toward $69,000.
The cryptocurrency industry saw a massive milestone in January when the US Securities and Exchange Commission finally greenlighted nearly a dozen spot Bitcoin ETFs after a decade of rejecting or delaying every application.
The effects were immediate as these products started attracting billions of dollars in the first few months. Then came April, though, when the trend changed, and there were numerous days in the red.
May 1 was the most painful in terms of outflows, as the total amount withdrawn on that date was north of $560 million.
The tides turned once again in the following weeks, especially after the favorable data from the US CPI numbers for April. In fact, May 10 was the last date when the largest ETFs saw negative numbers.
The financial products have been on an impressive streak since then, equalling the 10 consecutive day record from March of inflows. May 15 and 21 saw inflows of more than $300 million, while May 24’s numbers exceeded $250 million.
BlackRock’s IBIT leads the pack once again in terms of inflows and has attracted over $16,350 billion. Grayscale is still the leader with $20 billion, according to SoSovalue, but the outflows there suggest that BlackRock will surpass it in the near future.
Overall, the total inflows in all ETFs are close to $13.7 billion. Meanwhile, Ethereum fans also saw some positive developments this week as the US SEC greenlighted eight spot ETH ETFs. However, it’s still uncertain when they will launch.
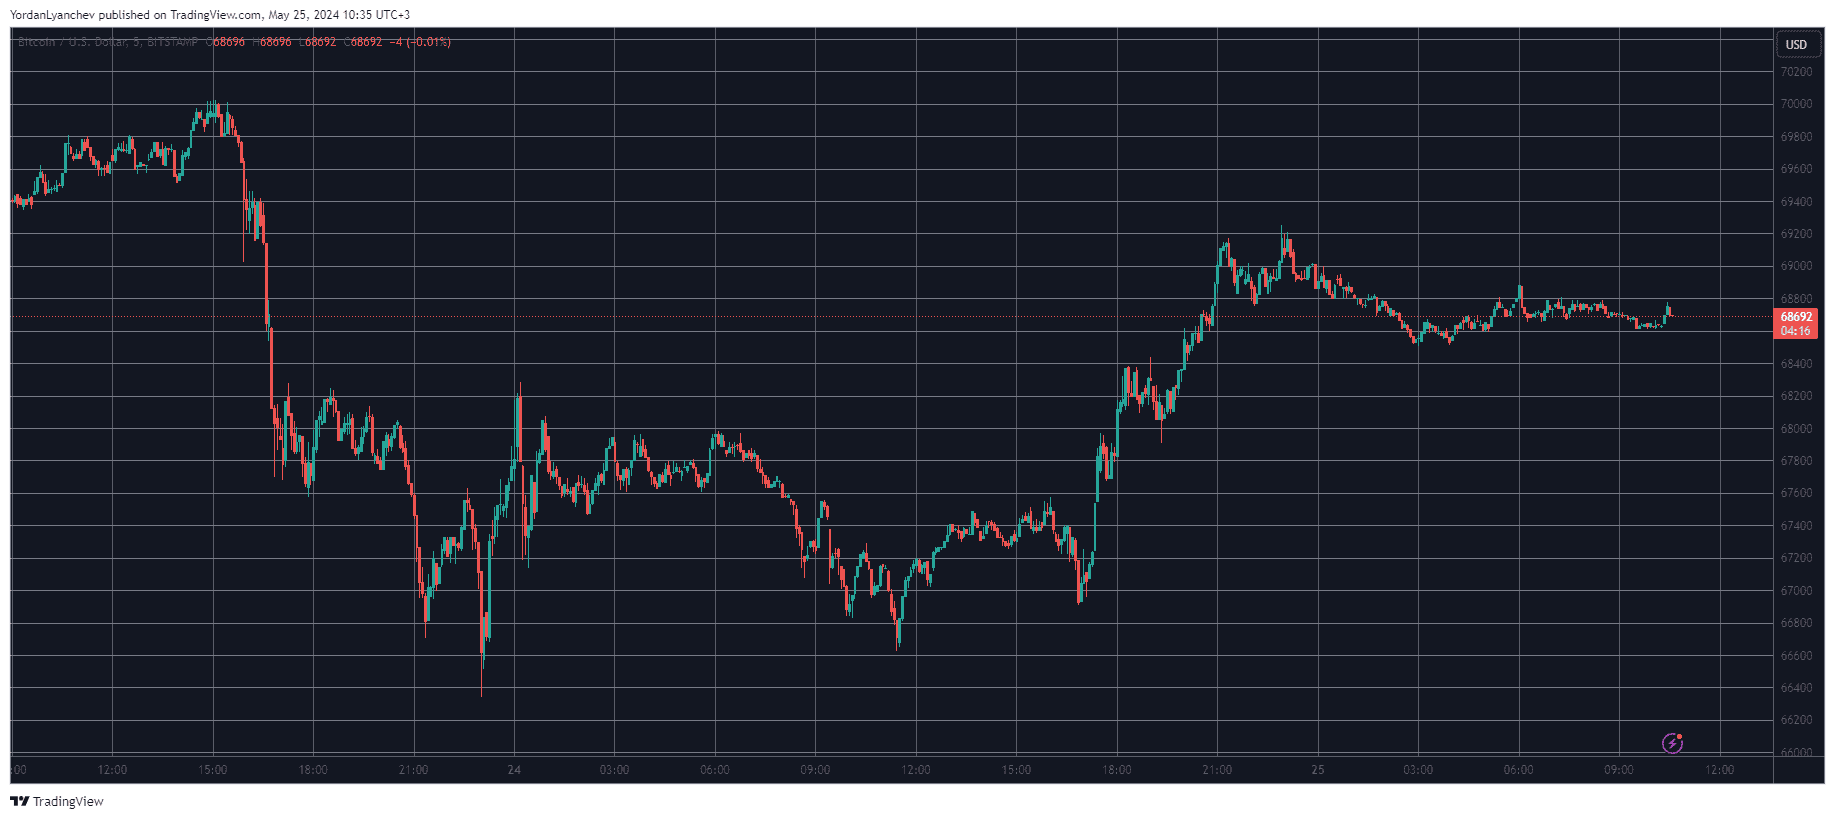
BTC responded with lots of volatility to the Ethereum news, skyrocketing from $67,000 to $72,000 before dumping to under $66,000 this week. The past 24 hours have been more positive, perhaps driven by the impressive inflows, and BTC now stands close to $69,000.
Binance Free $600 (CryptoPotato Exclusive): Use this link to register a new account and receive $600 exclusive welcome offer on Binance (full details).
LIMITED OFFER 2024 at BYDFi Exchange: Up to $2,888 welcome reward, use this link to register and open a 100 USDT-M position for free!


Bankrupt crypto exchange FTX is asking the court to greenlight a plan that could potentially deny billions in creditor repayments to users in 49 countries where crypto faces legal restrictions.
This could disproportionately impact Chinese users, who reportedly represent 82% of the affected claim value.
Navigating Legal Minefields in Restricted Jurisdictions
The FTX proposal, detailed in a July 2 court filing, is seeking authorization to designate 49 countries, including China, Russia, Afghanistan, and Ukraine, as “Potentially Restricted Jurisdictions.”
While claims from these regions will be automatically treated as “disputed,” the FTX Trust will first seek legal opinions for each jurisdiction, and in cases where distribution is deemed legally permissible, payouts will proceed.
However, where legal advice indicates distributing funds would violate local laws, the Trust will issue a formal notice to affected creditors. These users will then have a 45-day window to file a formal objection, including submitting it to a U.S. court.
According to the document, if a jurisdiction is ultimately deemed “restricted” and a claimant remains a resident there when repayments are processed, their funds and any associated interest “shall be immediately forfeited and revert to the FTX Recovery Trust.”
The submission has triggered significant backlash from affected users. While the FTX Recovery Trust is positioning it as a legal compliance issue, others argue it raises serious ethical questions.
“FTX accepted users from China when things were fine,” wrote one X user. “Now denying their claims entirely because of ‘restricted jurisdiction’ feels unfair.”
He described creditors from the beleaguered countries as “victims” who still deserved to be repaid.
Another Chinese claimant, going by the username “Will,” also argued forcefully against the rationale:
“While mainland China does not support cryptocurrency trading, residents… are allowed to hold cryptocurrencies… The claims process uses USD for settlement… they are allowed to hold USD overseas. So why isn’t wire transfer settlement supported?”
Meanwhile, others expressed despair, with one user asking, “Is there anything that could be done? Or they just steal all of the money?” FTX creditor advocate Sunil suggested that selling or transferring the claim to someone in an allowed jurisdiction might be a potential workaround.
Ongoing Repayments
While the controversy rages on, other creditors have been making progress with their payments. As per a July 1 update, those with claims under $50,000 have already received 120% payouts, while larger claimants received 72.5% in May. The remaining 27.5% is expected through distributions extending into 2027.
Meanwhile, the fallout from FTX’s 2022 collapse continues to resolve elsewhere, with most celebrity endorsement lawsuits dismissed, though retired NBA star Shaquille O’Neal settled for $1.8 million.
Binance Free $600 (CryptoPotato Exclusive): Use this link to register a new account and receive $600 exclusive welcome offer on Binance (full details).
LIMITED OFFER for CryptoPotato readers at Bybit: Use this link to register and open a $500 FREE position on any coin!
Cryptocurrency
This Critical Binance Metric Suggests Incoming Surprises for Bitcoin: What You Need to Know
Binance’s net taker volume surged past $100 million just ahead of the latest US Nonfarm Payrolls (NFP) report.
Such a trend points to aggressive buying as traders position for a key macroeconomic catalyst.
Binance Sees Aggressive Buy Orders
In its latest analysis, CryptoQuant revealed thaft this spike reflects large market buy orders on Binance, indicating strong bullish sentiment or speculative bets on continued market momentum.
The US labor market report, released shortly after, showed Nonfarm Payrolls increasing by 147,000 in June. This figure exceeded analysts’ expectations of 110,000-118,000. The unemployment rate also fell to 4.1% from 4.2% in May and was the lowest level since February, according to the Bureau of Labor Statistics.
The stronger-than-expected employment data reduces the chances of near-term rate cuts, ultimately backing the Fed’s plan to maintain higher rates to control inflation. Market-implied probabilities now reveal a 95% chance the Fed will hold rates steady at its July meeting, as it rose from 75% before the jobs report was released.
A resilient jobs market has strengthened the US dollar, as expectations of delayed or reduced interest rate cuts make the currency more attractive relative to others.
Historically, strong NFP data and hawkish Fed expectations have weighed on risk assets, including Bitcoin, as a firmer dollar environment tends to reduce the relative appeal of alternative assets.
The combination of Binance’s aggressive buy-side activity and the strong jobs report could pave the way for potential volatility in crypto markets as traders assess the Fed’s policy outlook and the broader macro environment.
After US jobs data beat forecasts, Bitcoin briefly climbed above $110K before retreating to $108.8K.
July Seasonality Fuel Optimism
As per crypto analyst Daan Crypto Trades’ observation, holding above $108K is critical for the leading crypto asset to avoid a downward spiral. He considers a close near the $110K region a healthy sign.
Meanwhile, Matrixport noted that July has historically been a strong month for Bitcoin, as 7 out of the last 10 Julys have closed positively and have an average return of over 9.1%. Supported by the improving Fed outlook and post-July 4 optimism, the next few weeks could offer a final push higher before another round of consolidation. The Greed & Fear Index is also bottoming out, a signal that often precedes upward momentum in Bitcoin’s price.
Binance Free $600 (CryptoPotato Exclusive): Use this link to register a new account and receive $600 exclusive welcome offer on Binance (full details).
LIMITED OFFER for CryptoPotato readers at Bybit: Use this link to register and open a $500 FREE position on any coin!

Chainlink (LINK) remains locked in a $12-$15 price stalemate, owing to the continued whale accumulation amid retail disengagement.
On-chain data shows sustained negative exchange netflows of around 100,000 LINK per week, which indicates that whale entities are absorbing sell pressure without significant price disruption.
LINK Faces Critical Test
CryptoQuant stated that this trend contrasts with occasional retail-driven spikes, such as March 2025’s 5 million LINK deposit surge. Retail activity has stayed flat, as evidenced by the daily active addresses hovering between 28,000 and 32,000, while transaction counts remain stagnant at around 9,000 per day. Despite increased oracle utility, retail failed to capitalize on a minor activity bump seen in late 2024.
Whale urgency is evident as exchange withdrawals peaked at 3,000 transactions per day in Q4 2024 and remain elevated, thereby steadily draining exchange reserves, which have fallen approximately 40% year-to-date. Neutral leverage metrics are preventing volatility and have allowed systematic accumulation without triggering a breakout above $15.
A resolution to this deadlock will require a spike in retail participation to ignite momentum or a slowdown in whale withdrawals to weaken accumulation. Until a catalyst emerges, LINK’s structure matches Bitcoin’s 2023 consolidation phase before its surge in 2024.
While this accumulation standoff continues on-chain, Chainlink has been expanding its broader ecosystem through partnerships.
Collaborations With Mastercard and Visa
Last month, the decentralized oracle network partnered with Mastercard to allow 3 billion cardholders to purchase crypto directly on-chain using fiat payments. The collaboration utilizes interoperability infrastructure and Mastercard’s global network to remove barriers to crypto access.
Partners like Zerohash, Shift4, Swapper Finance, and XSwap support liquidity, compliance, and fiat-to-crypto conversion, bridging traditional payments with decentralized finance environments.
Chainlink also completed a pilot under the HKMA’s e-HKD+ initiative with Visa, wherein the duo tested cross-border investment transactions using CBDCs and stablecoins. In the trial, ANZ’s AUD-backed stablecoin A$DC was converted into e-HKD and used to invest in a tokenized money market fund.
Chainlink’s CCIP enabled asset transfers between ANZ’s private blockchain and Ethereum’s public testnet, while Visa’s VTAP managed the token lifecycle. The pilot demonstrated instant, compliant investment fund access, which reduced settlement times from days to just seconds, even on weekends.
Binance Free $600 (CryptoPotato Exclusive): Use this link to register a new account and receive $600 exclusive welcome offer on Binance (full details).
LIMITED OFFER for CryptoPotato readers at Bybit: Use this link to register and open a $500 FREE position on any coin!

 Forex3 years ago
Forex Today: the dollar is gaining strength amid gloomy sentiment at the start of the Fed’s week
- Forex3 years ago
Unbiased review of Pocket Option broker
- Forex3 years ago
Dollar to pound sterling exchange rate today: Pound plummeted to its lowest since 1985
- Forex3 years ago
How is the Australian dollar doing today?
- Cryptocurrency3 years ago
What happened in the crypto market – current events today
- World3 years ago
Why are modern video games an art form?
- Commodities3 years ago
Copper continues to fall in price on expectations of lower demand in China
- Economy3 years ago
Crude oil tankers double in price due to EU anti-Russian sanctions


