Cryptocurrency
Top 5 Ripple (XRP) Price Predictions to Watch in May

XRP’s price has been on the move lately. Over the past seven days, it increased by more than 9% and is currently trading at around $2.30.
In this article, we take a closer look at the top 5 XRP price predictions to watch as we approach the month of May. Will the old saying “sell in May and go away” turn out to be true once again?
5 Ripple (XRP) Price Predictions to Watch in May
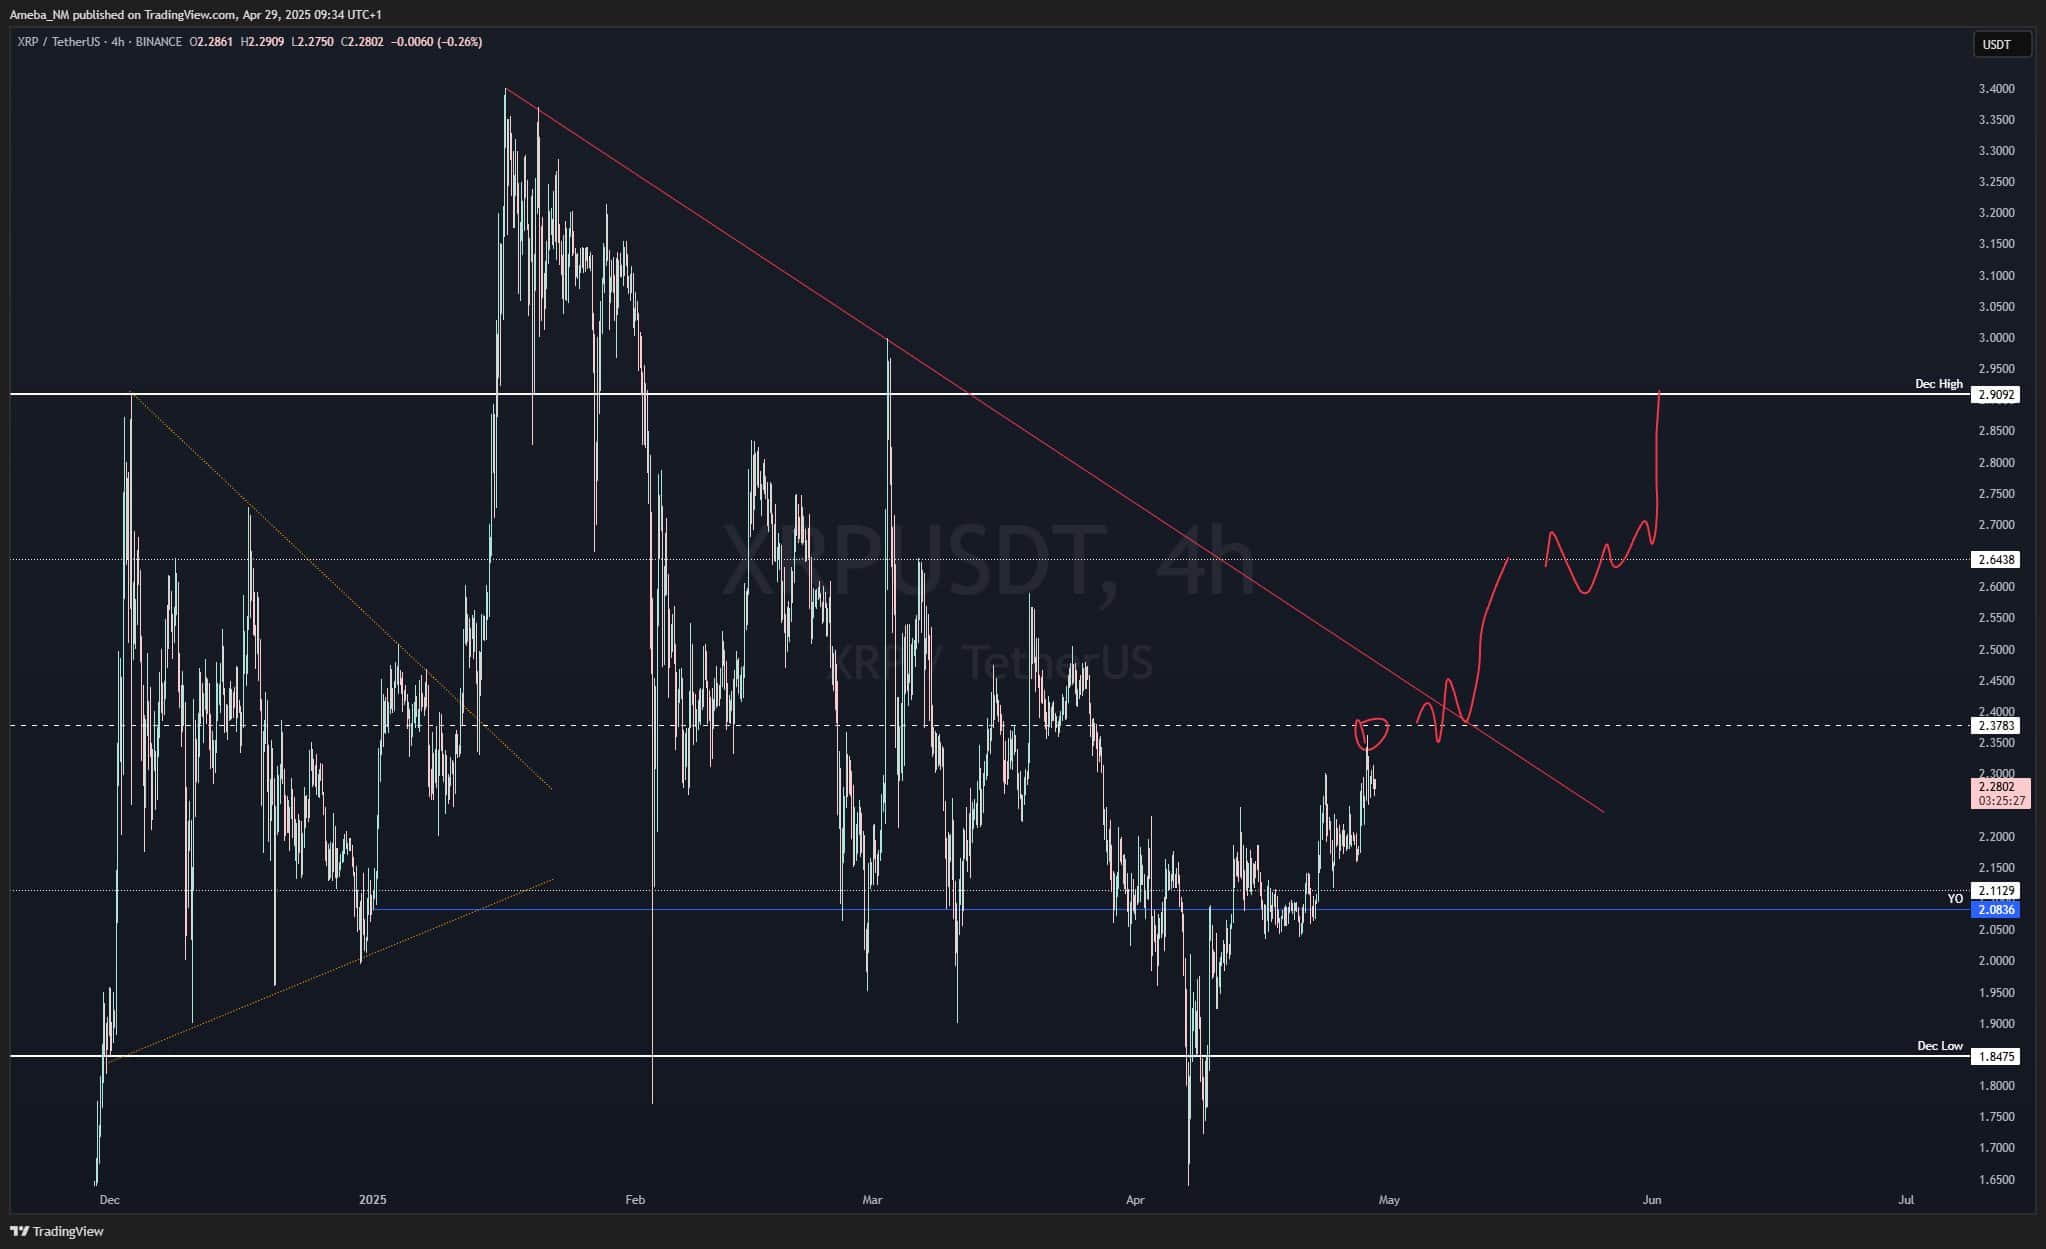
First in line we have an analysis from the popular analyst on X using the monicker Ameba. He took it to social media recently, to reveal that the first target he is looking at is located at around $2.90. This would represent an increase of around 26%.
I wanted to see a tap of [the] mid range, which is what happened over the weekend shortly after [the] weekly open.
The next play wto the upside would be above the mid range for me, on a potential breakout scenario.
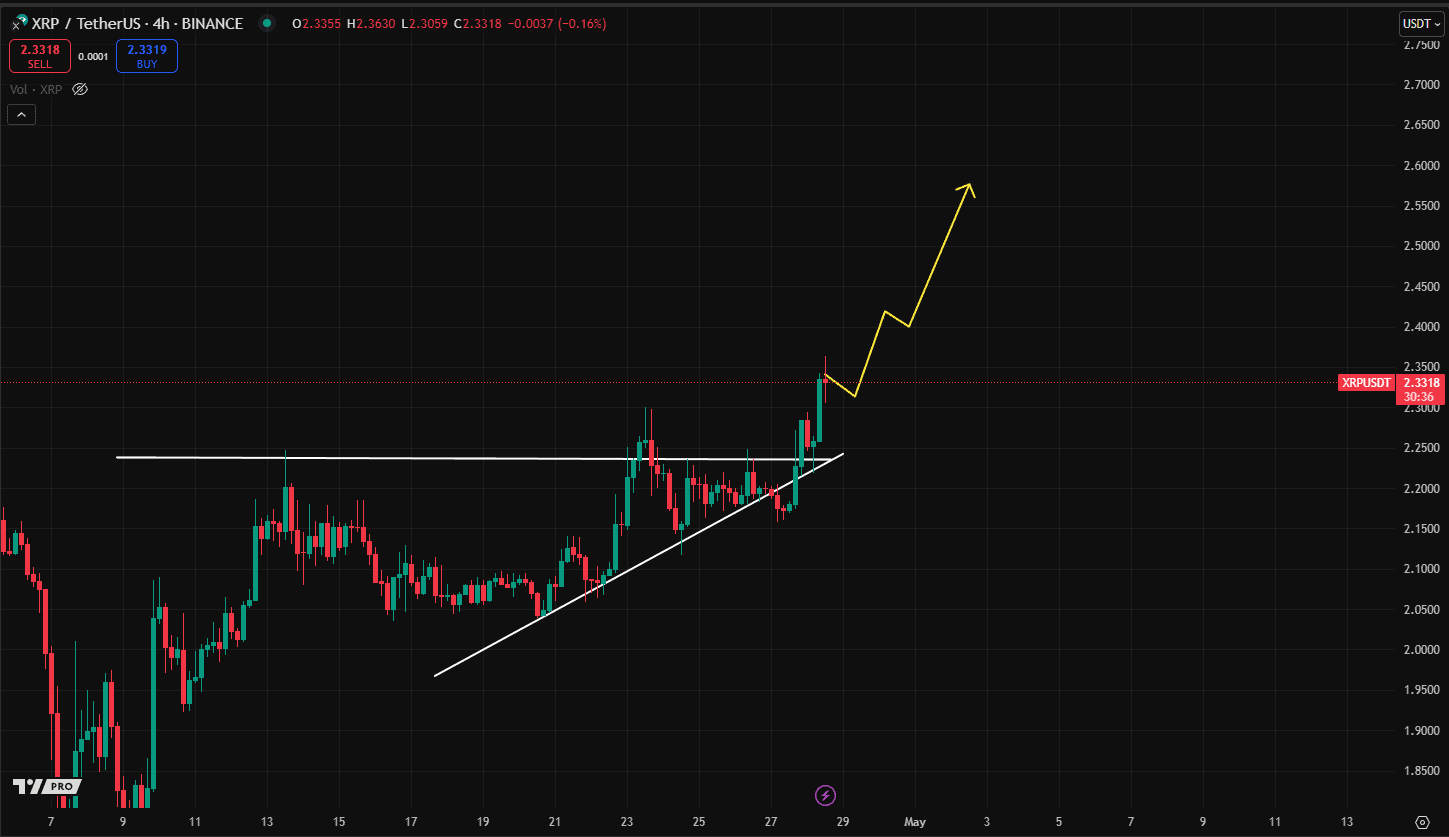
It appears that this particular notion is also supported by another trader. Joe Swanson bases his analysis on an inverse Head & Shoulders pattern which, according to him, has been broken to the upside, confirming a bullish wedge breakout and flipping the key resistance to support, while also forming a higher low.
Momentum [is] building for a storng move up! – He said, attaching a chart with a $3 price prediction in the short term.
Duo Nine, a well-known trading analyst noted in a Ripple price analysis for CryptoPotato that even if the bulls are able to make it to $3, they would have to face a considerable selling pressure. That’s stemming from the fact that this level has been tested twice in the near past. The XRP price got rejected twice there.
Another XRP price prediction comes from Crypto Virtuos, who told his 81,000 followers that the next target to keep an eye on is $2.5. This would represent an increase of around 10% from current prices.
As previously posted, XRP has broken out and is looking strong. Initial target is $2.5. This is the biggest hurdle on the way right now. Start of the week looks good.
More Shocking XRP Price Predicitons
While the above three seem more conservative to the opportunistic traders, here are some wild and borderline unrealistic Ripple price predictions. Some of the following are not predicted to happen in May but are worth watching nonetheless, especially if the fundamentals behind them start yielding merit.
First in line, we have Oscar Ramos. He cited an analysis by Bitwise, outlining that when XRP ETFs are approved in the US, the asset’s price will go parabolic. His target is around $29 by 2030.
Next in line is another popular XRP price commentator on X called Brett, who said XRP could reach between $33 and $50 by 2027, citing Sistine Research. This would materialize a rally between 1500% and 2500%.
And lastly, the most outrageous prediction for XRP’s valuation. John Squire, a social media influencer with around 500,000 followers said that it’s possible for the cryptocurrency to reach $100. Of course, to sound the side of objectivity, this would put XRP’s total market cap at around $6 trillion, which is twice as large as the entire crytpocurrency market right now.
Why is the XRP Price Up This Week?
Price predictions aside, it’s worth noting that there are some fundamental developments behind XRP’s recent price movements. The most evident one is that ProShares received the SEC’s approval to launch three separate XRP ETFs. Namely, these are the Ultra XRP ETF (2x leverage), Short XRP ETF, and Ultra Short XRP ETF (-2x leverage).
As the names suggest, these are not spot XRP ETFs – they are based on derivative products and do not require ownership of the underlying asset.
Although this is not what the community expected, the positive impact on the market seems clear as many investors take it as a positive signal coming from the country’s financial watchdog.
Binance Free $600 (CryptoPotato Exclusive): Use this link to register a new account and receive $600 exclusive welcome offer on Binance (full details).
LIMITED OFFER for CryptoPotato readers at Bybit: Use this link to register and open a $500 FREE position on any coin!


TL;DR
- Whales, hackers, and the Ethereum Foundation wallets moved over $500M in ETH through large sales and withdrawals.
- Ethereum transfers rose to 4.6M ETH, nearing the monthly high of 5.2M recorded in July.
- Staking inflows hit 247,900 ETH, the highest in a month, locking more supply from trading.
Large Withdrawals and Whale Activity
Ethereum (ETH) has seen heavy movement from major wallets over the past few days. On-chain data from Lookonchain shows a newly created wallet pulled 17,591 ETH, worth $81.62 million, from Kraken in just two hours.
Over three days, two new wallets withdrew a combined 71,025 ETH, valued at $330 million, from the exchange.
One of these wallets, address 0x2A92, has withdrawn 53,434 ETH, worth $242.34 million, in two days. This includes a recent purchase of 30,069 ETH, valued at $138.46 million, during a market drop.
Major ETH Holders Offload Millions Amid Price Rally
In contrast, several separate entities have been disposing of some ETH holdings. A wallet tied to a hacker address 0x17E0 sold 4,958 ETH for $22.13 million at $4,463, securing a profit of $9.75 million. Earlier this year, the same address sold 12,282 ETH at $1,932 and later bought back part of the amount at higher prices.
A different whale sold 20,600 ETH for $96.55 million over the past two days, generating a profit of more than $26 million after holding the position for nine months.
Meanwhile, an Ethereum Foundation-linked wallet, 0xF39d, sold 6,194 ETH worth $28.36 million in the last three days at an average price of $4,578.
Recent sales from the same wallet included an additional 1,100 ETH and 1,695 ETH for over $12.7 million combined.
The #EthereumFoundation-linked wallet(0xF39d) sold another 1,300 $ETH($5.87M) at $4,518 ~11 hours ago.
Over the past 3 days, this wallet has sold a total of 6,194 $ETH($28.36M) at an average price of $4,578.https://t.co/4hfCWymHVG pic.twitter.com/ErUyEY8SJy
— Lookonchain (@lookonchain) August 15, 2025
Network Activity on the Rise
CryptoQuant data shows Ethereum’s total tokens transferred have been climbing since August 9. After ranging between 1 million and 3 million ETH through late July and early August, transfers have risen to 4.6 million ETH, approaching the monthly high of 5.2 million recorded in mid-July. This increase has occurred alongside a price rally from about $3,400 to $4,600.

Interestingly, staking inflows generally stayed between 20,000 and 80,000 ETH per day over the past month. On August 14, inflows jumped to 247,900 ETH, the highest in the period.
At the time, ETH was trading near $4,600. Large staking deposits reduce the amount of ETH available for immediate trading, as staked coins are locked for a set period.

In the meantime, ETH trades at $4,647 with a 24-hour volume of $68.25 billion, down 2% on the day but up 19% over the week.
Binance Free $600 (CryptoPotato Exclusive): Use this link to register a new account and receive $600 exclusive welcome offer on Binance (full details).
LIMITED OFFER for CryptoPotato readers at Bybit: Use this link to register and open a $500 FREE position on any coin!

TL;DR
- Whales bought two billion DOGE this week, lifting their combined holdings to 27.6 billion coins.
- A single 900M DOGE transfer worth $208M to Binance drew attention to large exchange movements.
- DOGE broke key resistance, with momentum building for a possible push toward the $1 price mark.
Price and Market Moves
Dogecoin (DOGE) traded at $0.23 at press time, slipping 4% over the past day but still showing a 2% gain for the week. Daily turnover came in at about $6.18 billion.
Meanwhile, the broader crypto market saw over $1 billion in liquidations. Hotter-than-expected US Producer Price Index data pushed traders to scale back expectations of a near-term Federal Reserve rate cut. DOGE had roughly 290,500 coins liquidated during the sell-off.
On the two-week chart, analyst Trader Tardigrade notes that DOGE has cleared a downward-sloping resistance line after completing what appears to be a “wave V” in an Elliott Wave sequence. Similar setups in the past, where prolonged declines stayed within falling channels before breaking higher, have been followed by sharp rallies.
$Doge/2-week#Dogecoin is gaining strong momentum to surge above $1 pic.twitter.com/TuSEKr19nv
— Trader Tardigrade (@TATrader_Alan) August 15, 2025
Momentum gauges are also turning up. The Stochastic RSI, which had dropped into oversold territory, is now heading higher. Previous reversals from this zone have coincided with sustained upward moves. The current formation points to a possible run that could carry DOGE past the $1 mark.
Heavy Whale Buying and Large Transfers
As reported by CryptoPotato, blockchain data shows large investors have added two billion DOGE in the past week, spending just under $500 million. That brings their holdings to about 27.6 billion coins, or 18% of the supply. The buying streak has prompted speculation within the community.
Recently, Whale Alert flagged a 900 million DOGE transfer worth about $208 million into Binance. The tracking indicates that it originated from a wallet connected to the exchange, likely as an internal activity. The address involved holds 2.88 billion DOGE, one of the largest balances on the network.
Ali Martinez also reports that transactions above $1 million reached a one-month high, with activity building since early August and peaking as DOGE traded at $0.25.
Whales are back! Dogecoin $DOGE activity at a 1-month high. pic.twitter.com/C83Pv68mCt
— Ali (@ali_charts) August 14, 2025
Sentiment Building
Analyst Gordon described the current setup as “a nice bit of consolidation” before a potential breakout, adding,
“This will be one of the first coins normies FLOCK to & the pump will be MASSIVE.”
With whale accumulation rising, high-value transfers increasing, and a bullish technical pattern in play, DOGE is positioned for a potential push toward $1 if momentum holds.
Binance Free $600 (CryptoPotato Exclusive): Use this link to register a new account and receive $600 exclusive welcome offer on Binance (full details).
LIMITED OFFER for CryptoPotato readers at Bybit: Use this link to register and open a $500 FREE position on any coin!

XRP has recently entered a consolidation phase after a strong rally earlier this summer, with the price action now hovering around key resistance levels on both its USDT and BTC pairs. Yet, while momentum has slowed, the charts still indicate a generally bullish structure, with multiple key support levels remaining firmly in place.
Technical Analysis
By ShayanMarkets
The USDT Pair
On the XRP/USDT daily chart, the price is currently trading near the $3.10 mark, facing a strong resistance zone around $3.40. This follows a breakout above the $2.70 range in July, which has now flipped into a support area.
Both the 100-day and 200-day moving averages are also trending upward and recently formed a bullish crossover around $2.45, reinforcing the medium-term bullish sentiment. If the $3.40 resistance breaks, a push toward the critical $4.00 range becomes likely.
However, the RSI hovering near the neutral 50 level suggests a lack of strong momentum for now, meaning a short-term pullback into the $2.80 support zone is still possible.
This zone will be key for maintaining the bullish structure. Losing it could open the door for a deeper correction toward the 200-day moving average located around the $2.40 mark. Yet, as long as the price stays above the moving averages, the broader trend remains bullish.

The BTC Pair
Looking at the XRP/BTC chart, the pair has recently pulled back after hitting the 3,000 SAT resistance, with the price currently around 2,600 SAT.
This follows a clean breakout above the long-term descending channel and a successful retest of its upper boundary, which coincided with the 200-day moving average and the 2,400 SAT support zone. This confluence remains a key bullish technical factor, as holding above it could attract renewed buying pressure.
That said, RSI levels around 48 show that momentum has cooled after the sharp July rally, meaning XRP may continue ranging between 2,400 SAT and 3,000 SAT in the near term. A decisive close above 3,000 SAT would likely open the path to the 3,400 SAT zone, while losing 2,400 SAT could shift the bias back toward 2,000 SAT support. For now, the structure still favors the bulls as long as higher lows remain intact.

Binance Free $600 (CryptoPotato Exclusive): Use this link to register a new account and receive $600 exclusive welcome offer on Binance (full details).
LIMITED OFFER for CryptoPotato readers at Bybit: Use this link to register and open a $500 FREE position on any coin!
Disclaimer: Information found on CryptoPotato is those of writers quoted. It does not represent the opinions of CryptoPotato on whether to buy, sell, or hold any investments. You are advised to conduct your own research before making any investment decisions. Use provided information at your own risk. See Disclaimer for more information.
Cryptocurrency charts by TradingView.

 Forex3 years ago
Forex Today: the dollar is gaining strength amid gloomy sentiment at the start of the Fed’s week
- Forex3 years ago
Unbiased review of Pocket Option broker
- Forex3 years ago
Dollar to pound sterling exchange rate today: Pound plummeted to its lowest since 1985
- Forex3 years ago
How is the Australian dollar doing today?
- Cryptocurrency3 years ago
What happened in the crypto market – current events today
- World3 years ago
Why are modern video games an art form?
- Commodities3 years ago
Copper continues to fall in price on expectations of lower demand in China
- Economy3 years ago
Crude oil tankers double in price due to EU anti-Russian sanctions


