Cryptocurrency
Trader Used PORK Token to Turn 5 ETH into $3.3 Million in 3 Days: Data
A trader has reportedly turned an initial investment of five Ethereum (ETH) into an impressive $3.3 million by strategically buying and selling the PORK token.
The massive gain was accomplished through a well-timed investment in the recently launched PepeFork (PORK) cryptocurrency, according to analysts by Lookonchain.
Trader Invests 5 ETH in PORK
The trader initially invested 5 ETH, valued at $12,000, in PORK, purchasing 9.5 trillion tokens shortly after the commencement of trading for the crypto. Subsequently, the trader sold 6.3 trillion coins back into ETH, resulting in a net gain of 329 ETH tokens valued at $765,000.
In just 3 days, this trader made $3.3M on $PORK with only 5 $ETH($12K)!😱
This trader spotted $PORK 7 minutes after it opened trading and spent 5 $ETH($12K) to buy 9.5T $PORK.
Then he sold 6.3T $PORK for 329 $ETH($765K), realizing a profit of 324 $ETH($753K).
This trader… pic.twitter.com/IGYS6U0SPU
— Lookonchain (@lookonchain) February 2, 2024
After the transaction, the trader retained 3.2 trillion PORK, which was estimated to be worth around $2.55 million. Some followers of Lookonchain speculated that the success of these trades might be attributed to insider information.
PepeFork (PORK) is a meme coin inspired by the PEPE meme token cryptocurrency project, which proved profitable for many investors in 2023. Described as a fork of PEPE by its developers, PORK is traded on platforms like Uniswap and MEXC.
The meme coin experienced a remarkable surge of over 450% in less than two days on Wednesday, placing it above Baby Dogecoin as the ninth largest meme coin in the crypto space, with a market capitalization of $200 million shortly after its debut.
Dexscreener data reveals that PORK has a total supply of 420 trillion, with the top 10 holders controlling over 15% of that amount.
Notably, all these addresses were less than two days old when they received PORK tokens, and they each held $30 to $200 in ETH, potentially for gas fees and on-chain swaps.
Profiting Off Memecoins
Buying meme coins at the start of their trading and then selling for profits is a popular strategy among many participants in the crypto community despite the associated high risks and potentially high rewards.
A recent example involves a trader who noticed that tech billionaire Elon Musk had changed his Twitter profile to “(CTO) Chief Troll Officer.” In response to this, the trader withdrew 4.313 ETH, valued at around $10,113, from Binance and invested it in purchasing 19.37 trillion TROLL tokens for 4.3 ETH.
Subsequently, the trader sold 9.37 trillion TROLL tokens for 5.318 ETH, equivalent to approximately $12,467, thereby recovering the initial investment. As of now, the trader holds 10 trillion TROLL tokens, estimated to be worth about $1.03 million.
Binance Free $100 (Exclusive): Use this link to register and receive $100 free and 10% off fees on Binance Futures first month (terms).


TL;DR
- XRP jumps 80% from April lows as whales move over $200 million in large transactions.
- ETF volume surges 5x above normal as traders await ProShares’ XRP futures fund launch.
- XRP nears $3 as traders speculate on $4 breakout amid revived momentum and whale activity.
XRP Hits Five-Month High After 80% Climb
XRP has surged nearly 80% from its April lows and shot up to almost $3 for the first time in several months. The token has increased by 8% in the last 24 hours and 25% weekly, making it one of the strongest assets in the market this week.
Interestingly, the rally also marks a Bitcoin (BTC) breakout to a new record of $118,800, assisting in pushing up wider crypto prices. XRP has gained renewed momentum after months of muted movement, drawing fresh interest from both retail and institutional traders.
Whale Transfers Fuel Speculation
On-chain data shows several large XRP movements over the past 24 hours. Whale Alert flagged a 33 million XRP transfer (worth about $90 million) from Upbit to an unknown wallet. Another 40 million XRP, valued at over $100 million, moved between unidentified addresses, as CryptoPotato reported.
In a separate transfer, 25.49 million XRP were sent from a private wallet to Coinbase. The cause behind such transactions is not clear, but these movements are likely to precede or follow price action. The timing has added to ongoing market speculation around the asset’s next move.
XRP ETF Volume Spikes Ahead of Key Deadlines
Trading activity has also picked up in XRP-linked exchange-traded products. Bloomberg’s Eric Balchunas noted a sharp increase in volume.
“The XRP ETFs seeing surge in volume today, like 4-5x the norm,” he posted.
The 2x leveraged XRP fund ($XXRP) rose 27% on the day and 55% this week, with volume hitting $120 million.
The XRP ETFs seeing surge in volume today, like 4-5x the norm, especially the 2x one $XXRP, which is up 27% today, 55% this week with $120m in volume.. Teucrium rewarded for getting out early.. ht @Todd_Sohn pic.twitter.com/Bk8hsNFhW1
— Eric Balchunas (@EricBalchunas) July 11, 2025
As reported, ProShares plans to launch three futures XRP ETFs on July 14. These include Ultra XRP, UltraShort XRP, and Short XRP funds. The launches depend on whether the SEC allows them to proceed without objection before deadlines later this month.
Traders continue to watch the charts closely. Edoardo Farina, a crypto educator, said,
“It wouldn’t be surprising if market participants woke up to see XRP trading above $4.”
XRP has remained below its all-time high for over seven years, but current momentum has revived market expectations for a breakout.
Binance Free $600 (CryptoPotato Exclusive): Use this link to register a new account and receive $600 exclusive welcome offer on Binance (full details).
LIMITED OFFER for CryptoPotato readers at Bybit: Use this link to register and open a $500 FREE position on any coin!
Bitcoin has decisively broken above its previous all-time high of $111K, triggering a powerful bullish rally toward the key $120K psychological resistance.
However, as BTC approaches the $120K zone, profit-taking and distribution pressure may rise, increasing the likelihood of a short-term corrective pullback.
Technical Analysis
By ShayanMarkets
The Daily Chart
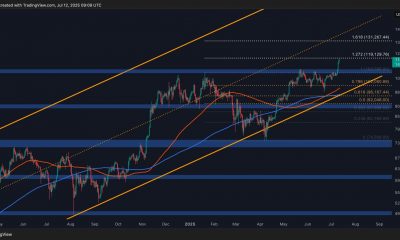
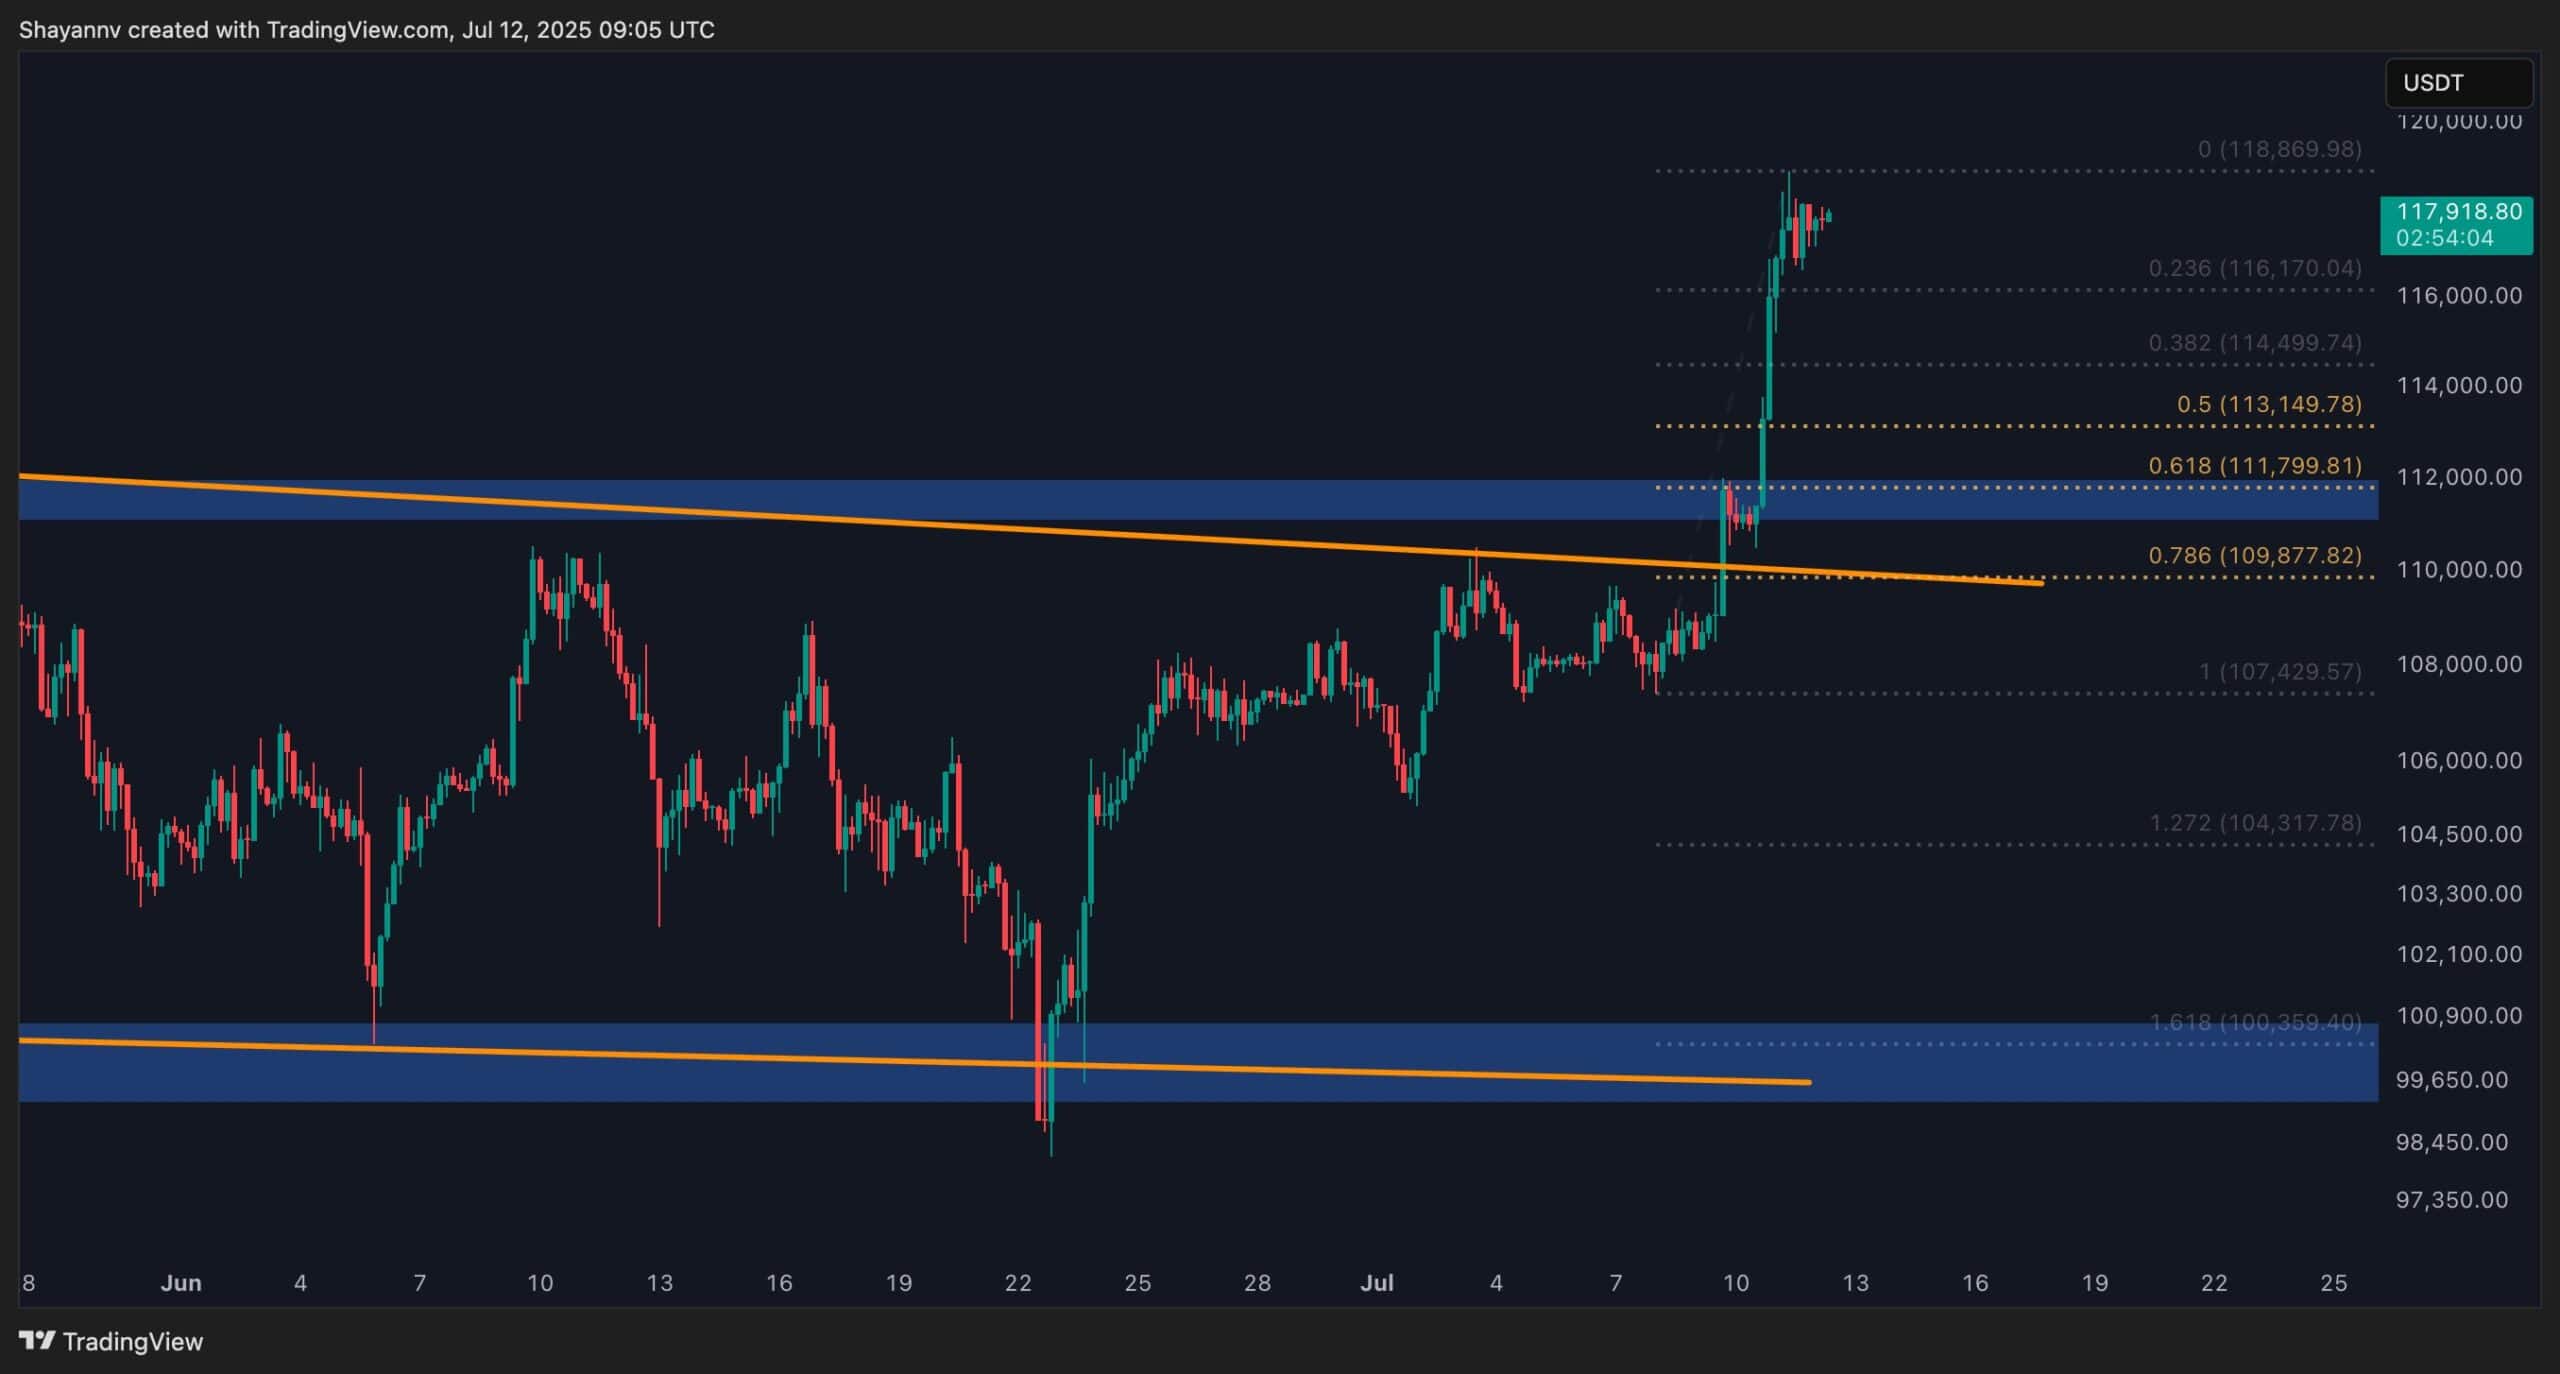
After a prolonged consolidation phase, Bitcoin has decisively broken above its previous all-time high of $111K. This breakout was backed by a notable surge in buying activity, triggering a short-squeeze that accelerated the bullish momentum. As a result, Bitcoin rapidly climbed toward the psychologically significant $120K resistance level.
While this move signals strong market confidence, the $120K region is a probable zone for profit-taking and distribution, which could temporarily slow down the rally. A short-term corrective phase is therefore expected, likely pulling the price back toward the $111K region to retest the breakout level. Based on the Fibonacci retracement tool, key resistance levels ahead are located at $120K and $131K.

The 4-Hour Chart
On the lower timeframe, Bitcoin printed a powerful bullish candle, decisively breaking above both the descending wedge pattern and the previous ATH at $111K. Following a minor pullback to retest the breakout zone, the price resumed its upward surge, reaching the $120K mark.
Such impulsive rallies are often followed by short-term corrections, as traders begin to realize profits. A healthy retracement would likely target the 0.5 ($113K) to 0.618 ($111K) Fibonacci levels, a key zone where the market may stabilize and build momentum for the next leg up.
On-chain Analysis
By ShayanMarkets
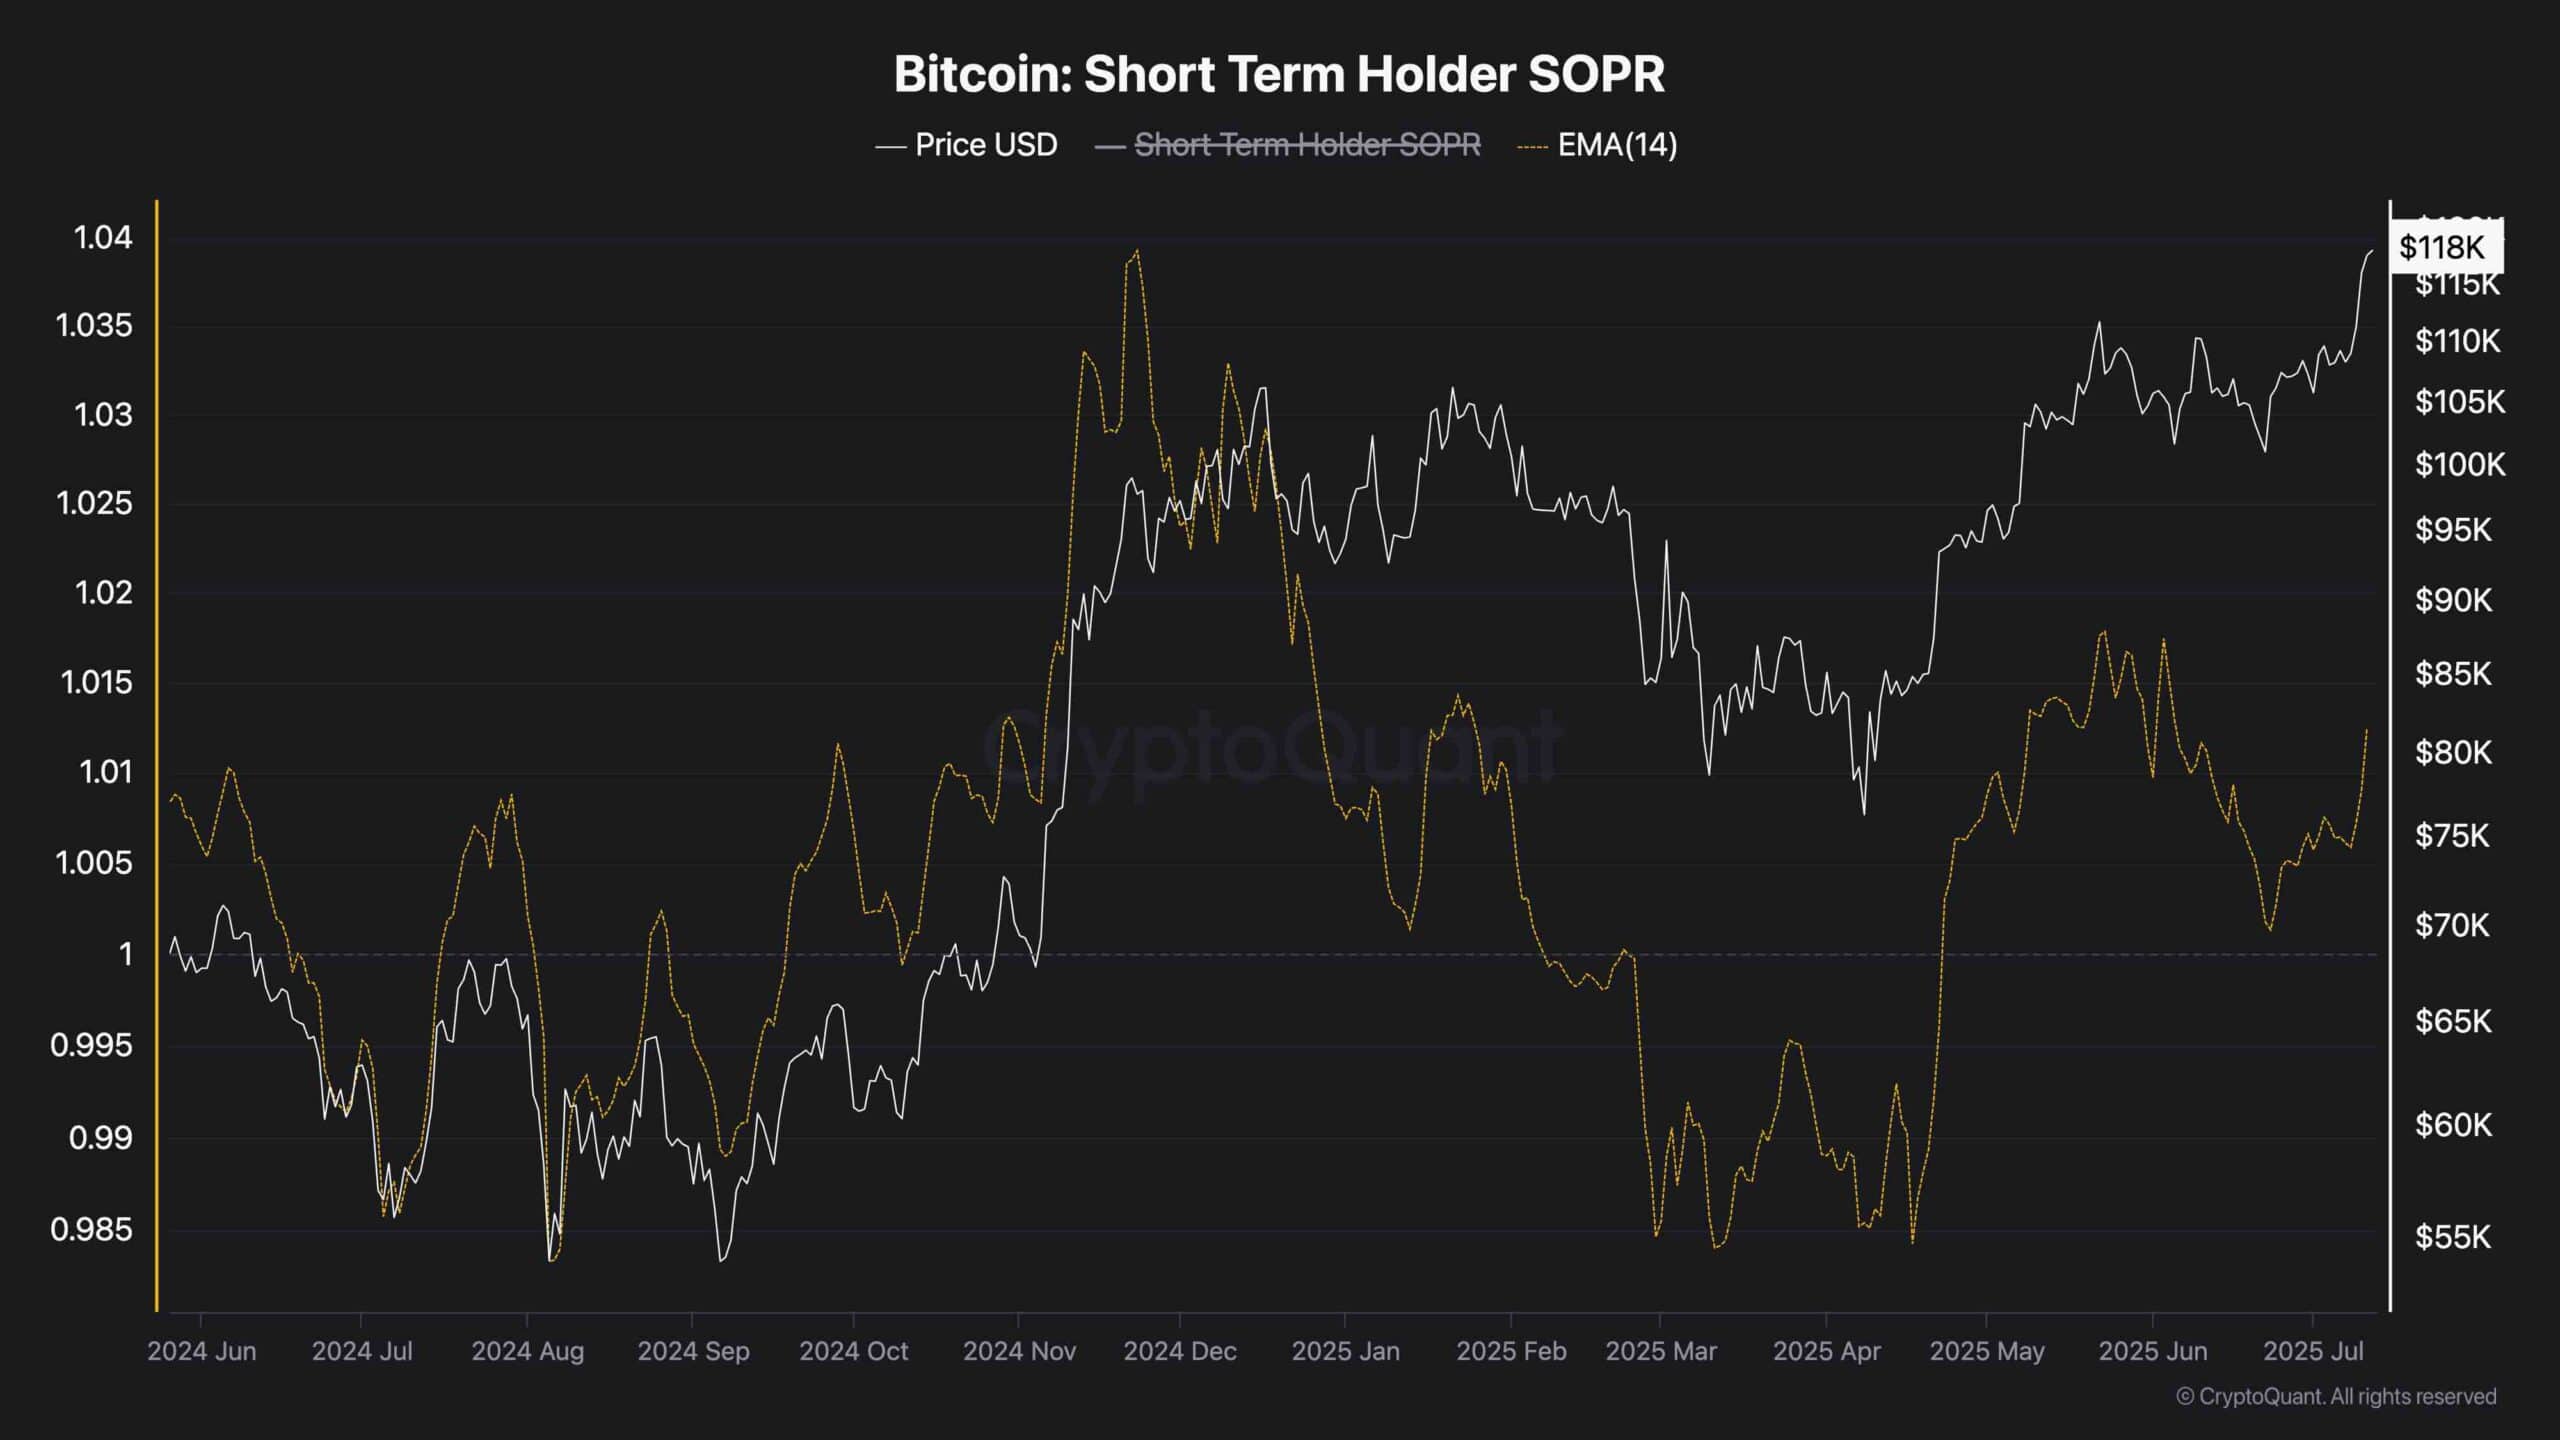
As Bitcoin trades at all-time highs near $120K, an intriguing insight emerges from the Short-Term Holder SOPR metric. This indicator, which measures realized profits from investors who’ve held BTC for less than 155 days, remains notably muted, especially when compared to November 2024, when Bitcoin first reached $111K.
Despite the recent surge, short-term holders aren’t cashing out aggressively, indicating that profit-taking is still relatively limited. Historically, the end of a bullish cycle is often accompanied by elevated SOPR values due to massive profit realization. But for now, the data suggests the market isn’t overheated, and the current rally could still have room to grow if new demand enters.
Binance Free $600 (CryptoPotato Exclusive): Use this link to register a new account and receive $600 exclusive welcome offer on Binance (full details).
LIMITED OFFER for CryptoPotato readers at Bybit: Use this link to register and open a $500 FREE position on any coin!
Disclaimer: Information found on CryptoPotato is those of writers quoted. It does not represent the opinions of CryptoPotato on whether to buy, sell, or hold any investments. You are advised to conduct your own research before making any investment decisions. Use provided information at your own risk. See Disclaimer for more information.
Cryptocurrency charts by TradingView.

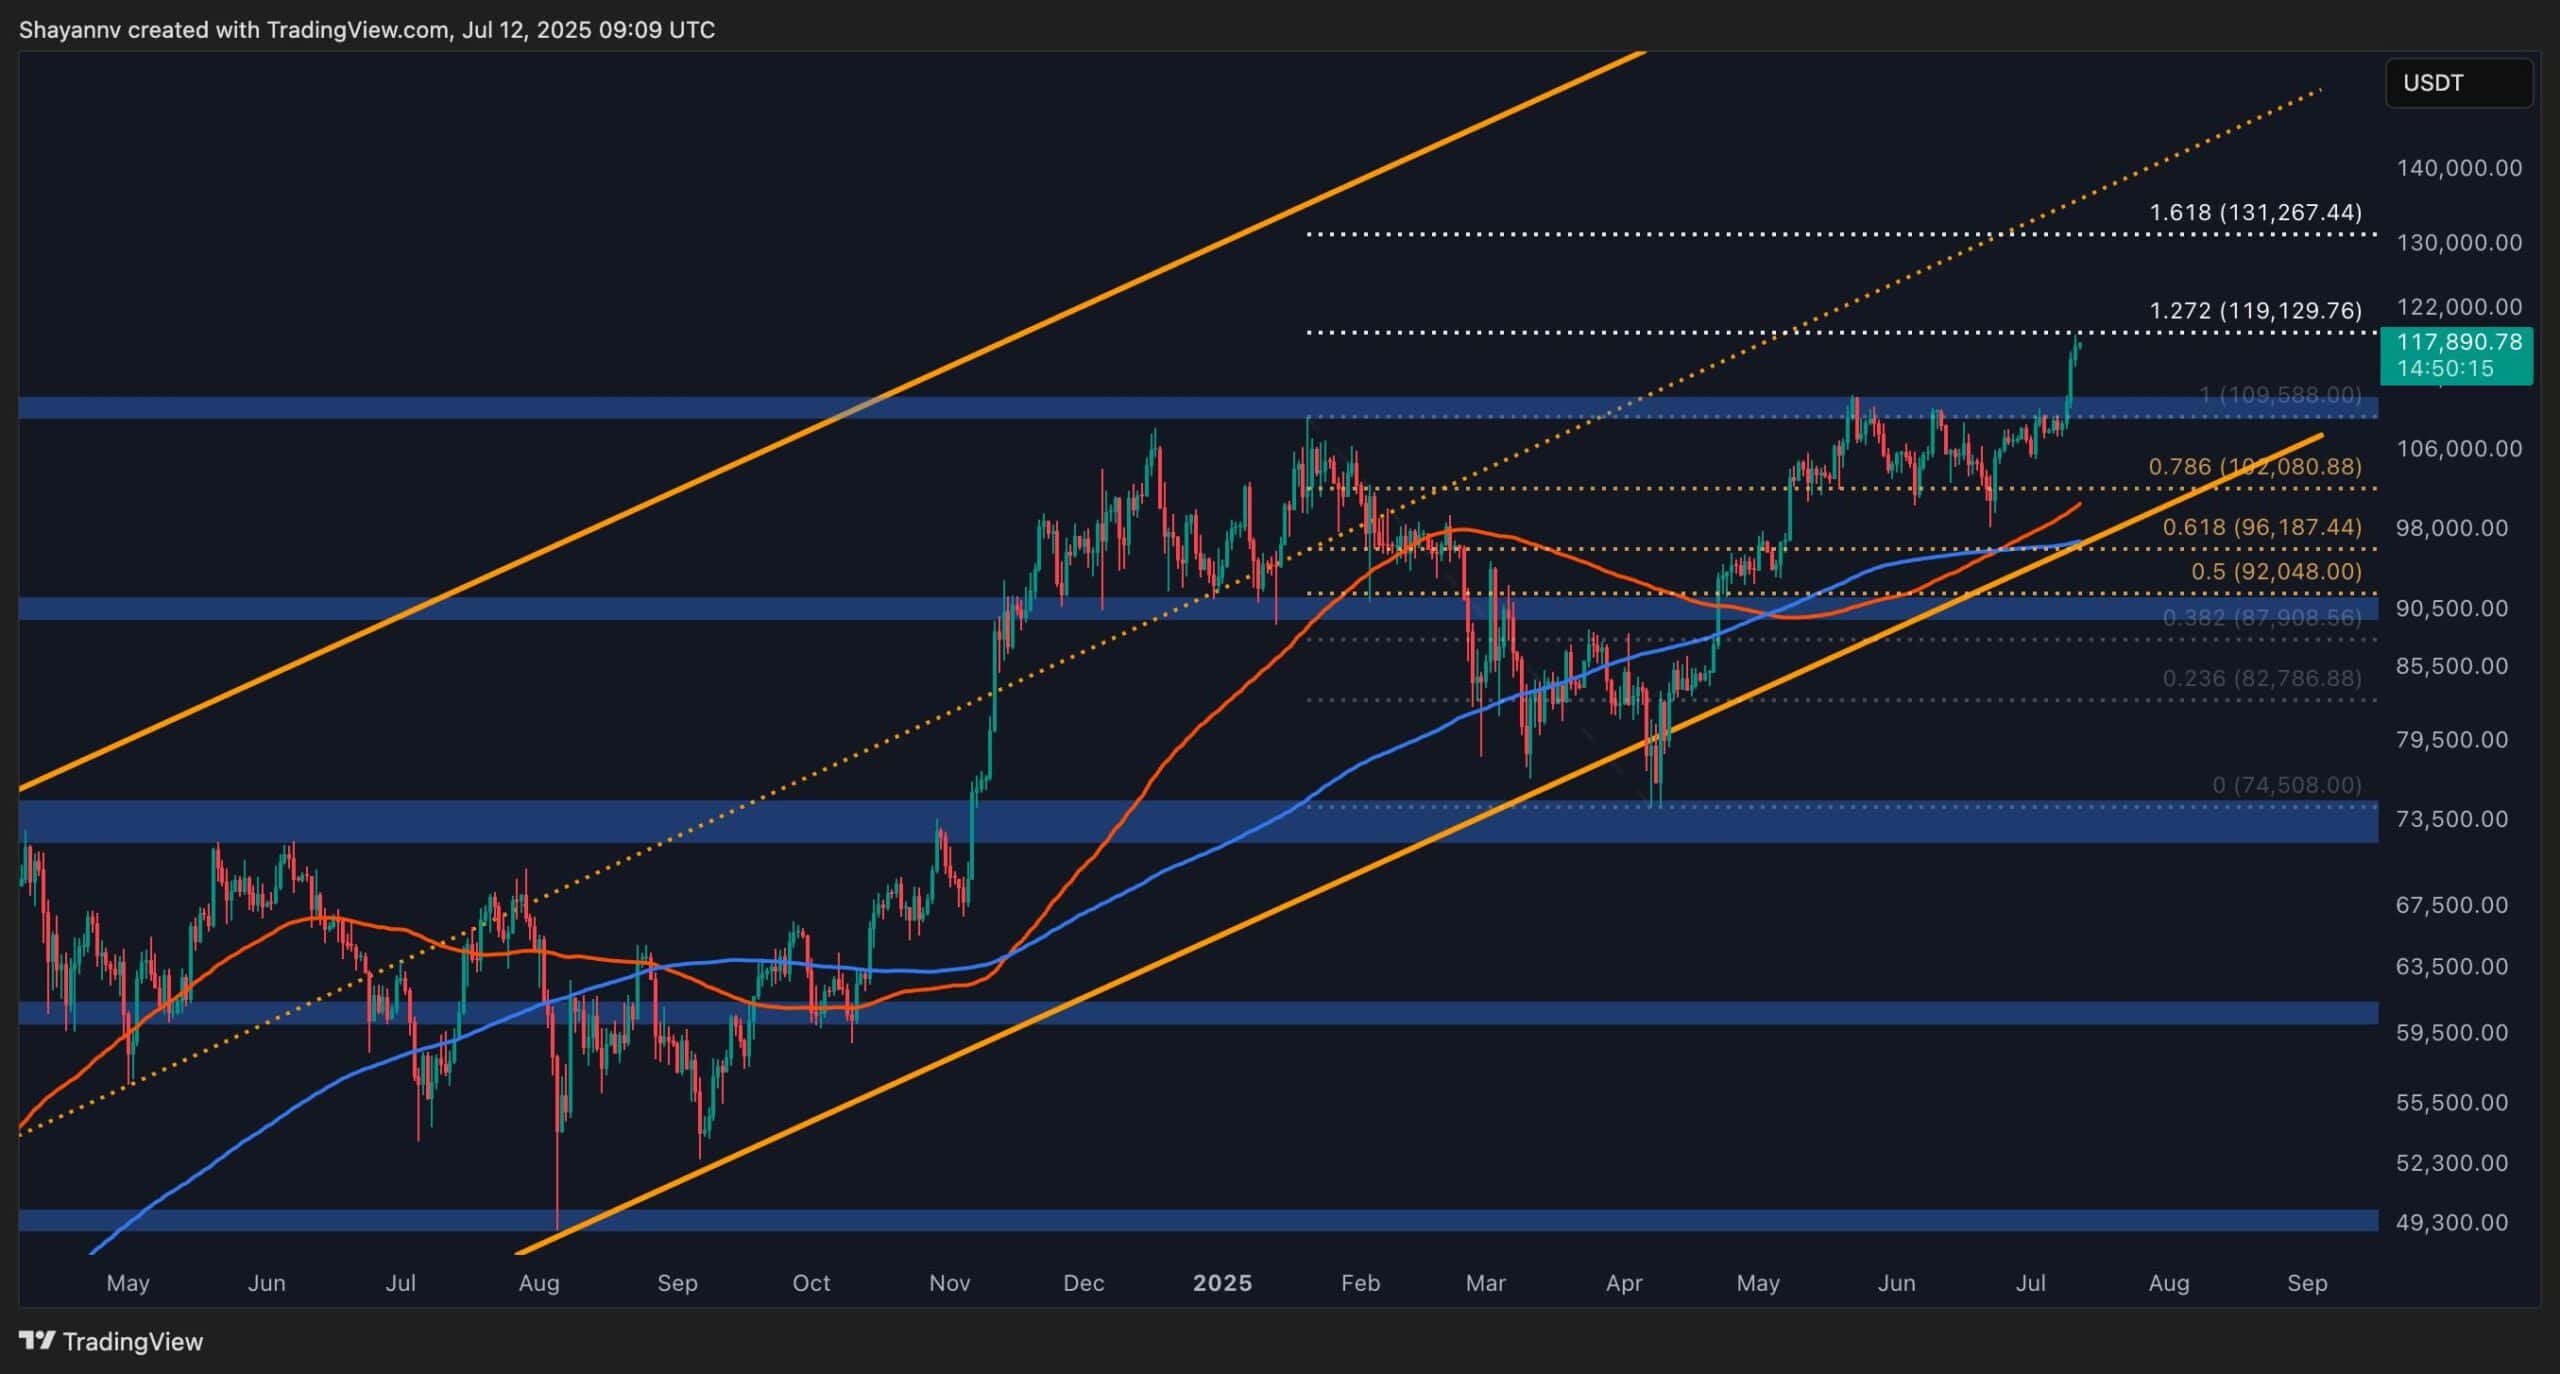
Binance led global BTC spot volume in the first half of 2025. CryptoQuant’s latest analysis revealed that the crypto exchange commanded more than 37% market share, which is equivalent to over $3.44 trillion in traded volume.
This significant lead evidenced Binance’s position as the primary hub for Bitcoin liquidity and major flow activity, as volume spikes and large trades often appear there first.
Competitors Lag Behind
Other prominent platforms such as Bybit, Crypto.com, Coinbase, and OKX collectively accounted for around 29% of total spot volume during the same period. Together, they formed the next tier of liquidity centers despite the wide gap with Binance.
Meanwhile, crypto exchanges such as Upbit, Bitget, and HuobiPro each hovered around the 5% mark. While they did maintain relevance in the global market, but had comparatively lower influence, as noted by CryptoQuant.
On the other hand, Kraken, KuCoin, and Gate.io, among other long-tail exchanges, each contributed less than 3% of total BTC spot volume and largely served niche or regional markets.
“Bottom line: If you’re looking for deep liquidity or want to track major BTC flow activity, Binance is still the primary exchange (by far).”
Beyond its spot volume share, Binance also dominates in whale activity.
Bitcoin Whales Won’t Leave Binance
In fact, CryptoQuant found that Binance has been leading in cumulative whale transaction flows across centralized exchanges. The exchange recorded a whopping 31.36 million BTC in whale inflows and 30.82 million BTC in outflows. This reflected not the total BTC supply but the sheer velocity and frequency of whale-sized movements (≥1000 BTC/day) over its operational lifespan.
Spread across 2,869 active days of whale inflows, Binance has facilitated over 53.2 million whale transactions. It has dwarfed competitors with 10 times Kraken’s activity and five times that of HTX. This massive two-way flow indicates Binance’s role not merely as a custody hub but as a trusted venue for large-scale, active trading, market-making, and arbitrage operations, confirming its depth and infrastructure as reliable for whales.
For context, HTX Global follows with 24.1 million BTC in inflows across 6.8 million whale transactions, while Kraken recorded 23.7 million BTC in inflows with 765,000 whale transactions. Other notable platforms include Bitstamp, Bitfinex, Gemini, OKX, and Poloniex, but none match Binance’s scale.
Binance Free $600 (CryptoPotato Exclusive): Use this link to register a new account and receive $600 exclusive welcome offer on Binance (full details).
LIMITED OFFER for CryptoPotato readers at Bybit: Use this link to register and open a $500 FREE position on any coin!

 Forex3 years ago
Forex Today: the dollar is gaining strength amid gloomy sentiment at the start of the Fed’s week
- Forex3 years ago
Unbiased review of Pocket Option broker
- Forex3 years ago
Dollar to pound sterling exchange rate today: Pound plummeted to its lowest since 1985
- Forex3 years ago
How is the Australian dollar doing today?
- Cryptocurrency3 years ago
What happened in the crypto market – current events today
- World3 years ago
Why are modern video games an art form?
- Commodities3 years ago
Copper continues to fall in price on expectations of lower demand in China
- Economy3 years ago
Crude oil tankers double in price due to EU anti-Russian sanctions


