Stock Markets
Forex golden cross indicator formed in the market
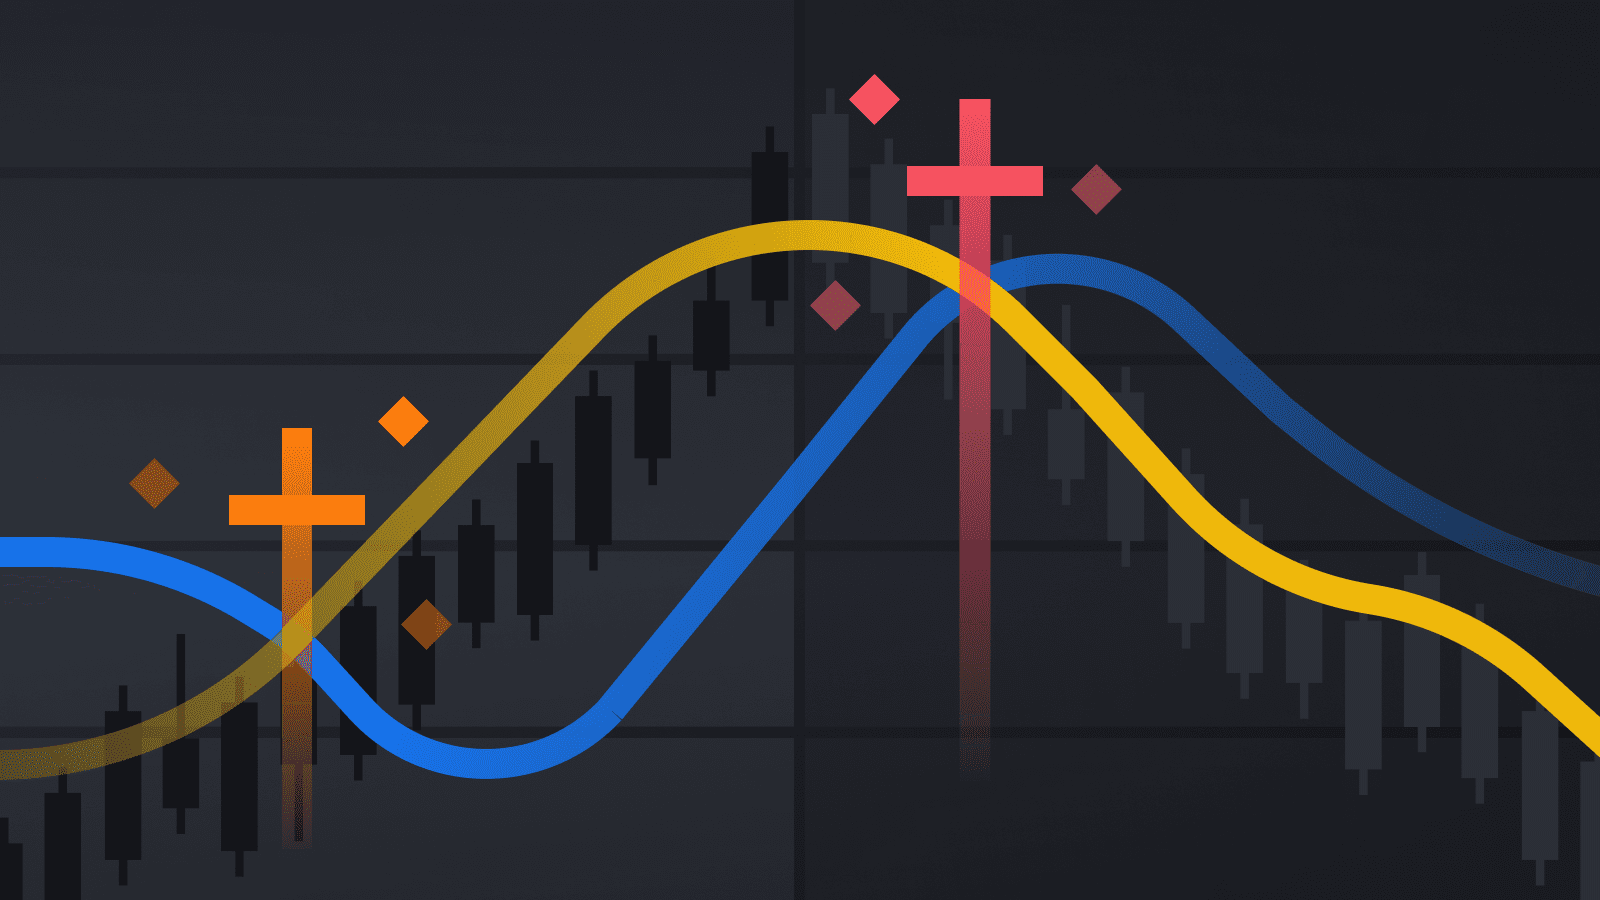
The Dow Jones Industrial Average showed a technical signal to buy on Tuesday, otherwise known as the forex golden cross indicator, which occurs when the 50-day moving average moves above the 200-day moving average, suggesting further growth of the index, strengthening its uptrend, writes Business Insider.
What indicator shows the golden cross? The golden cross pattern is the intersection of short-term and long-term moving averages from bottom to top. A moving average is a line on a chart displaying the average price of an asset over an n-period of time. Read more about Moving Average in our article 5 Key Indicators for Technical Analysis.
Usually a 50-day MA is used as a short-term average and a 200-day MA as a long-term average.
This technical indicator can help securities traders by signaling a strengthening uptrend, and likely a continued rally with rising stock prices.
Earlier, we reported that China asked banks for help to stabilize the Chinese bond market.


 Forex3 years ago
Forex Today: the dollar is gaining strength amid gloomy sentiment at the start of the Fed’s week
- Forex3 years ago
Unbiased review of Pocket Option broker
- Forex3 years ago
Dollar to pound sterling exchange rate today: Pound plummeted to its lowest since 1985
- Forex3 years ago
How is the Australian dollar doing today?
- Cryptocurrency3 years ago
What happened in the crypto market – current events today
- World3 years ago
Why are modern video games an art form?
- Commodities3 years ago
Copper continues to fall in price on expectations of lower demand in China
- Economy3 years ago
Crude oil tankers double in price due to EU anti-Russian sanctions


