Commodities
Energy & precious metals – weekly review and outlook

© Reuters.
Investing.com — It’s OPEC+ week ahead and we can expect the drone on how much higher crude prices can go to continue all week.
After a near 30% gain in the third quarter, it’s not surprising that the greed side of the market wants more.
The enablers of that on the production side of OPEC+ – Saudi Arabia and Russia – are, however, facing some challenges in growing the rally.
Already, India’s imports of Saudi oil in September are set to come in at below 500,000 barrels per day – the lowest monthly level in almost a decade – as global crude benchmark Brent peaked at nearly $98 from a March low of just above $70.
Also, the Saudis might have to ease production cuts in October – instead of adding to them – due to contractual obligations. Crude shipments from Saudi ports likely rose between 300,000 and 400,000 barrels per day last month from August – despite their so-called “lollypop cut” of one million barrels per day – and the trend might continue, OilPrice.com noted in a roundup of market intelligence gathered from various sources.
The Saudis have also been quite restrained in adding to the Official Selling Price, or OSP, of their crude despite Brent’s runaway rally, that market roundup showed. Saudi Arabia’s medium sour crude grades were hiked by $0.10 per barrel each, moving Arab Light to a $3.60 per barrel premium vs Oman/Dubai. The only Saudi crude grade that saw a notable increase in October was Arab Super Light, a very rare condensate-like grade that sees 1-2 cargoes per month, which rose by $0.50 per barrel.
“In an environment like this, Saudi Arabia’s national oil company Saudi Aramco (TADAWUL:) was expected to hike Asian prices by a solid margin,” the OilPrice roundup said. “Surprisingly, the anticipated OSP increase did not happen.”
“Overall, the lack of pricing ambition reflected wider worries about the health of Chinese demand into the remaining months of 2023, as well as significantly lower Indian nominations lately.”
To Moscow’s benefit, India has begun buying Russian urals crude at around $80 per barrel – markedly higher than the $60 price cap set by the G7, but still lower than the flat price of Brent.
But Russia, which has committed to the Saudi production squeeze plan by announcing a 300,000-barrel per day cut of its own, is also under pressure to keep up with deliveries promised to customers.
Moscow recently eased its separate ban on fuel exports introduced to stabilize the domestic market. Analysts do not expect those restrictions to stay for long because they may hit refinery runs and impact relations with customers.
Turkey, Brazil, Morocco, Tunisia and Saudi Arabia were among the main destinations for Russian diesel this year, JPMorgan said in a note.
“(A) protracted export ban would negatively impact the relationship with the new customers that Russian oil companies have so painstakingly built over the last year and a half,” according to JPMorgan.
Even so, Russia has not discussed a possible crude oil supply increase to compensate for Moscow’s fuel exports ban with OPEC+, the Kremlin has said.
That communication might be made directly when the Russians and Saudis hold talks at the Oct. 4 meeting of the Organization of the Petroleum Exporting Countries.
After having psyched the trade into believing their production cuts could go on indefinitely and against market reality, it would be important for neither side not to publicly admit anything to the contrary and work instead in keeping up the narrative they have created.
Oil: Market Settlements and Activity
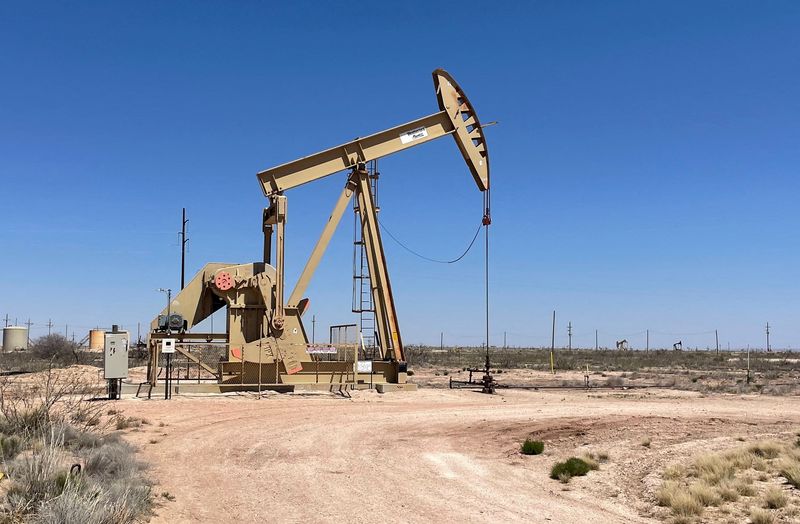
Crude prices fell on the last trading day of September on growing uneasiness over how the world might cope in the coming months with exploding energy costs, even as the U.S. economy and inflation appeared to have escaped the worst of such impact right away. Those long oil also won big on the month and quarter, helped largely by chokes on Saudi and Russian supply.
New York-traded West Texas Intermediate, or , crude for delivery in November did a final trade of $90.77 per barrel on Friday after officially settling the season at $90.79, down 92 cents, or 1%, on the day.
While WTI fell on the day, it rose 0.8% on the week, resuming its rally from the end of August after a one-week hiatus last week. For the month, the U.S. crude benchmark rose 8.5%, making September its best since July’s gain of nearly 16%.
The July-September period, where WTI rose 26.5%, also marked the best quarter for the U.S. benchmark since the first three months of 2022. Then WTI traded as high as $130 a barrel as Russia’s invasion of Ukraine opened the way for Western sanctions on Moscow that began the long-running disruption in global commodity flows. Now, WTI is approaching triple-digit pricing again, reaching a 13-month high of $95.03 on Sept. 28.
London-traded for the most-active December contract did a final trade at $92.09, after officially settling at $92.20 a barrel, down 90 cents, or 1%, on the day. The global crude benchmark rose 0.3% on the week, 6.8% on the month and 23% for the quarter. The global crude benchmark reached a 13-month high of $95.35 on Sept. 28.
“After an amazing week, month and quarter, oil was ready for some profit-taking,” said Ed Moya, analyst at online trading platform OANDA. “Energy traders quickly realized this wasn’t the time for oil to rally above the $100 a barrel level, so they are cautiously locking in some profits.”
Oil prices have gained between $25 and $30 from May lows of beneath $64 for WTI and $72 for Brent. The rally was largely in response to cumulative production squeezes of at least 1.3 million barrels per day by Saudi Arabia and Russia. The two say they are trying to “balance” the market – though the reality is they are creating a supply deficit so great versus stagnant demand that prices would have no choice but to rise.
The two prime movers of OPEC+ – an alliance that bands the 13-member Saudi-led Organization of the Petroleum Exporting Countries with 10 independent oil producers steered by Russia – have also benefited from tacit collusion on output from U.S. oil producers.
While antitrust laws forbid U.S. energy companies from participating in OPEC-like schemes that are against the spirit of free-market competition, American oil firms, lured by the Saudi bent in getting a barrel back to above $100, have restrained production too whenever possible in the name of returning cash to shareholders.
Demand for U.S. crude has, meanwhile, exploded internationally as it begins to fill some pockets underserved by the Saudi-Russian squeeze. That has led to a plunge in inventory levels at the Cushing, Oklahoma hub that serves as a central delivery and storage point for U.S. crude. This is especially so with the pick up in shipments of a new U.S. crude grade called WTI Midland – which is comparable to the viscosity of the heavier Arab and Russian oils versus the typically light-grade that’s WTI.
OANDA’s Moya isn’t the only one who thinks the oil rally will have to cool with the global economy.
Reuters’ market analyst John Kemp says oil traders have placed so many bullish bets on crude prices that the trade has become overcrowded and was due for a correction. The ratio of bullish to bearish bets on oil and fuels had risen to almost 8:1, he said. According to Kemp, this is a sign that oil prices may start reversing their gains before too long.
Other analysts, however, anticipate even higher prices, with those at JP Morgan saying Brent could reach $150 per barrel.
But Wall Street’s forecasters are often too caught up in chasing a market one way that they ignore counteracting forces. And one of the bigger risks to the oil rally remains the Federal Reserve and its higher-for-longer regime for U.S. interest rates.
Fed Chair Powell told a news conference last week that energy-driven inflation was one of the central bank’s bigger concerns.
The Fed has raised interest rates 11 times between March 2022 and July 2023, adding a total of 5.25 percentage points to a prior base rate of just 0.25%. It could add another quarter point in November or December and more likely in 2024.
Oil: WTI Technical Outlook
WTI could be poised to go below $90 this week if some of the bearishness from the just-ended week stays, though jawboning by OPEC and market mania to buy every dip was likely to send the U.S. crude benchmark back towards recent highs, said Sunil Kumar Dixit, chief technical strategist at SKCharting.com.
“Concerns about higher interest rates ahead caused WTI a pullback of about $4 from 13-month highs to close the week with indecision, but fairly bullish on month/quarter,” noted Dixit.
“Going further, immediate support shifts to the 5-week EMA, or Exponential Moving Average, dynamically positioned at $89.50,’ he said. “A break below this support is likely to initiate a short-term correctional wave targeting 100 week SMA $86 which has turned into horizontal support.”
On the higher side, $96.10 remains as active resistance, Dixit added.
Gold: Market Settlements and Activity
Gold prices fell for a second quarter in a row after losses that began in August and held through September, underscored by the current week’s drop – the worst in more than two years.
Gold’s most-active futures contract on New York’s Comex, , did a final trade of $1,864.60 an ounce on Friday, after officially settling at $1,866.10, down $12.50, or 0.7% on the day. The benchmark for U.S. gold futures was down 4% for the week, its biggest weekly decline since a near 6% plunge during the week to June 11, 2021.
For the third quarter, the drop in Comex gold was around 3%, after declines of 2% in August and 5% in September that offset July’s gain of 4%. In the second quarter, gold futures fell almost 4%.
The , more closely watched by some traders than futures, settled at $1,848.73, versus the prior session’s settlement of $1,864.56. A week ago, spot gold settled at $1,924.99. At the close of June, it was at $1,919.57.
More significantly, gold gave up in September its hold on the key bullish level of $1,900 an ounce that the yellow metal had held since mid-August. That came after some investors found the dollar – the archrival to gold – a better safe haven as U.S. economic growth remained relatively superior to the rest of the world.
Gross domestic product in the United States grew 2.1% year-on-year in the second quarter, after 2.2% in the first. GDP is projected to expand 2.1% for all of 2023. The euro area economy, in contrast, is projected to grow just 0.7% this year.
Bond yields, dollar seen pressuring gold further despite retreat
But more than all these, gold was negatively impacted by a selloff in U.S. bonds that sent the dollar flying as investors chased yields.
Bond yields, benchmarked to the return on the note, hovered at just under 4.58 on Friday after reaching a 16-year high of nearly 4.69 on Thursday.
Gold is getting crushed here despite some calm in the bond market as investors pile back into equities. Real yields are not backing away anytime soon and that still has gold on the ropes.
The remained stubbornly at around 106 – adding to the weight on gold – after a 10-month high of 106.84 on Wednesday.
The dollar held up despite the latest inflation data that raised hopes that the Federal Reserve might extend its hold on interest rates at its November policy meeting. The Personal Consumption Expenditure (PCE) Index, a price gauge closely followed by the Fed, rose 0.4% last month, just below Wall Street expectations for a 0.5% rise.
Gold: Price Outlook
Dixit of SKCharting noted that last week’s loss in gold was one of the biggest in months, with futures losing $80 from $1,927 to settle at $1,846, as the dollar hit a 10-month high of 106.84.
“The reaction to the bullish dollar has been strong enough to push gold through major support levels that include the 50-week EMA of $1,899 and the 100-week SMA, or Simple Moving Average, of $1855, which aligns with the monthly Middle Bollinger Band,” said Dixit.
He said the daily time frame price action indicates gold has approached oversold conditions and the next major support was seen at the 200-week SMA of $1,812.
“A bounce back towards the support-turned-resistance zone is likely to start towards $1,855, above which sits the $1,885 and $1,900 resistance levels,” Dixit added.
Natural gas: Market Settlements and Activity
finished the last trading day of September down while posting weekly, monthly and even quarterly gains as the price of America’s favorite fuel for indoor heating and cooling neared the key psychological bullish $3 mark.
The most active November gas contract on the New York Mercantile Exchange’s Henry Hub did a final trade of $2.930 per mmBtu, or million metric British thermal units, after officially settling the session at $2.929 — down 1.6 cents, or 0.5% on the day.
For the week though, November gas rose 11%. For the month, it was up 5.8% while for the third quarter, it gained 4.7%.
“Window dressing by commodity funds and other entities with mandated monthly or quarterly reports and/or rebalance schedules may have played a role in the earlier selloff, as today is the final traded session with any meaningful liquidity prior to the beginning of Q4,” analysts at Gelber & Associates, a Houston-based energy trading advisory, said in a note to their clients.
“Also significant is [the] price’s proximity to the $3.00 level of resistance,” Gelber’s analysts said. “Prices reaching such significant levels can drive those with much longer-term price sensitivities to hedge, such as producers.”
This month’s breakout to near $3 pricing marks the third attempt by gas bulls to get the market to that pivotal point since its fall from a high of $4.40 in January. For most of the year, the most-active gas contract on the Henry Hub has been stuck at mid-$2 levels, hampered by benign weather that neither needed too much cooling or heating.
Record daily production, often crossing 100 billion cubic feet, or bcf, per day has been another problem.
A huge stockpile overhang had also depressed the market. As of the end of last week, U.S. gas in storage stood at 3.359 trillion cubic feet, up 13.4 from a year ago and 6% higher than the five-year average.
With fall season now having begun in the United States, forecasts of cooler weather in the coming weeks could lead to higher heating demand and change in the dynamics of gas storage and pricing, analysts say.
Natural gas: Price Outlook
Since mid-June, gas futures on Henry Hub have maintained stability above the Middle Bollinger Band, settling the current week on a strong bullish note, noted Dixit.
“Next on the higher side, we have $3.18 and $3.24 as key resistance, followed by the 50-week EMA $3.35 as a short-term challenge,” said Dixit. “Effective support is seen at the Weekly Middle Bollinger Band of $2.59. which has kept the positivity intact.”
But he also noted that the November contract had a runaway gap at $2.78 that was due for filling at some point and this could push it back towards support levels.
Disclaimer: Barani Krishnan does not hold positions in the commodities and securities he writes about.


 Forex4 years ago
Forex Today: the dollar is gaining strength amid gloomy sentiment at the start of the Fed’s week
- Forex3 years ago
Unbiased review of Pocket Option broker
- Forex3 years ago
Dollar to pound sterling exchange rate today: Pound plummeted to its lowest since 1985
- Forex4 years ago
How is the Australian dollar doing today?
- Cryptocurrency4 years ago
What happened in the crypto market – current events today
- World3 years ago
Why are modern video games an art form?
- Commodities3 years ago
Copper continues to fall in price on expectations of lower demand in China
- Economy3 years ago
Crude oil tankers double in price due to EU anti-Russian sanctions


