Cryptocurrency
ETH vs. ADA: Is Cardano or Ethereum a Better Investment in 2024?
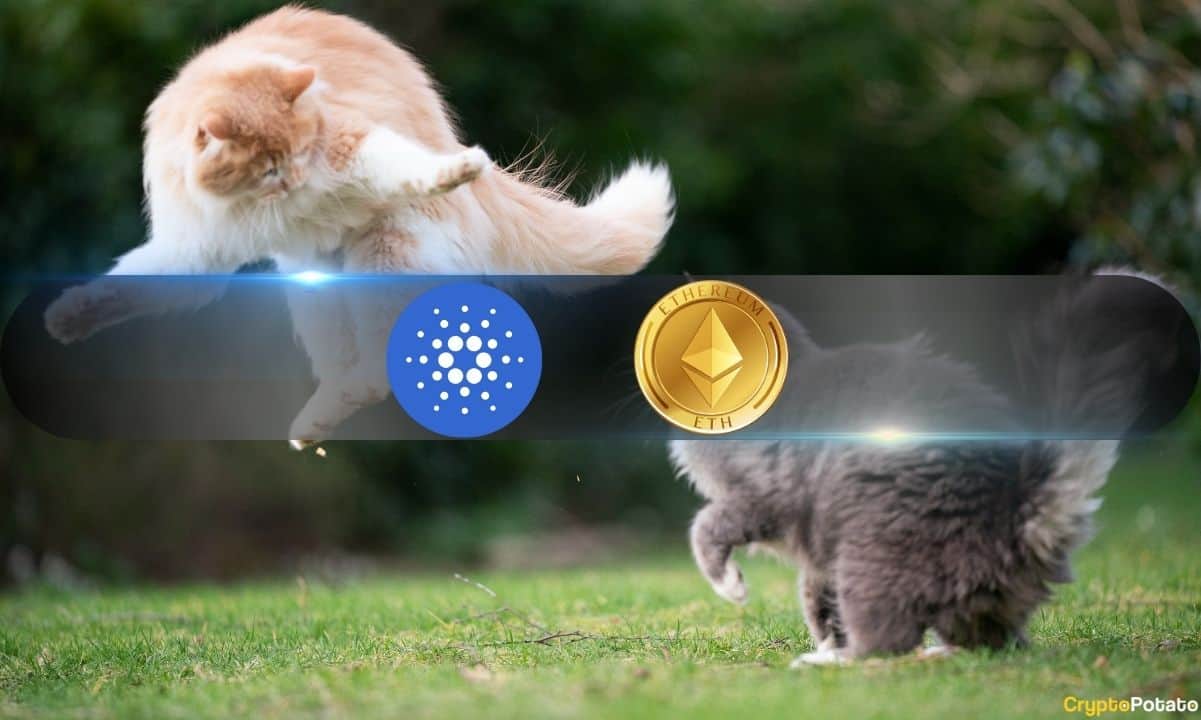
Markets got a big spike in Ethereum price this week on crypto exchanges. What’s behind it and what factors can investors take into consideration to determine whether Ether or its friend Cardano is the better buy?
Ethereum has a birthday coming up on July 30. It was launched in 2015 to create a “world computer” with the same Web3 blockchain properties as Bitcoin has for storing cash and making payments.
Cardano was launched on September 23, 2017 by initial coin offering (ICO) and founded by an Ethereum co-founder, Charles Hoskinson. Today it’s the 10th largest cryptocurrency by market capitalization.
Ethereum Market Cap (May 22): $451.8 billion
Cardano Market Cap (May 22): $17.2 billion
Certain differences between the two cryptocurrencies are an advantage for one or the other and a good reason to be bullish or bearish for ETH or ADA tokens.
But some of the two networks’ differences are tradeoffs that are more complex to evaluate as yielding an advantage for either crypto. Here are 7 key factors at play in the future Ethereum price against Cardano:
1. ETH vs. ADA – Technical Analysis (a tie)
Ethereum price is nearly all the way back to its ATH (all time high) after spiking this week on Ethereum spot ETF buzz. Cardano has a long way to go. That might actually be more bullish for ADA, with more upside left in its price.
The recent Ethereum ETF approval will shake up the entire meta for investing in Ether. If bulls take the price past $4,000, another 12.5% increase would pump ETH to $4,500— within striking range of the previous Ethereum ATH of $4,721 in Nov. 2021.
Forbes recently mentioned an Ethereum price prediction of $5,000 by the end of 2024. Bitcoin ETF issuer VanEck predicts $11,800 by 2030. An even more bullish outlook forecasts $10,000 ETH by the end of the year.
Over the short term, Cardano technical indicators and moving averages over the weekly span recommended “Sell” on Thursday. Meanwhile, Ethereum technical indicators for the seven-day span recommended “Strong Buy,” according to data from Investing.com.
2. Ether Spot ETF – Regulatory Analysis (bullish ETH)
There’s no denying it. Charles Hoskinson would certainly agree: U.S. regulators seem to favor Bitcoin and Ethereum over Cardano and other DeFi networks.
The SEC said okay to Ethereum futures ETFs in October, revealing it didn’t seem to think of Ether as an unregistered security. However, the U.S. regulator has classified Cardano and other cryptocurrencies as unregistered securities in lawsuits against multiple blockchain companies, while ignoring Bitcoin and Ether.
As Fortune Magazine reported on May 1, “Furthermore, despite launching a number of lawsuits against crypto companies since April 2023, the agency has never named Ether to be a security in its complaints.”
The SEC lawsuit against Ripple has taken years (since Dec. 2020) and still has not yet been resolved. It is costly and leaves the future unsure for the currencies under the government’s crosshairs.
Markets abhor uncertainty.
It may not be fair, but it’s a bullish factor for ETH and bearish for ADA.
3. ADA vs. ETH – Fundamental Analysis (a wash)
Fundamental analysis is the preferred method of investors who are not total degenerates. Instead of chart technical analysis or meme currency voodoo economics, the fundamentalist looks at an investment prospect and asks what would “The Intelligent Investor” author Benjamin Graham do if he were here?
Graham says:
“The intelligent investor is a realist who sells to optimists and buys from pessimists. In the short run, the market is a voting machine but in the long run, it is a weighing machine.”
If a business’s expected future revenues discounted to the present day exceed its current market value, then it may be a good investment. If they match or fall short of the business’s market cap, then it may be a poor investment.
ADA: $263.8 million TVL (3% annual reward rate + 121% annual growth rate) / Market Cap: $16.4 Billion
ETH $64.9 Billion TVL (5.5% annual reward rate + 145% annual growth rate) / Market Cap: $453 Billion
Going by the data above without any further context, it appears Cardano would be the winner, because its inflows make up a much smaller portion of its market cap than Ethereum (0.019 to 0.22), but only if we expect it to grow at the same rate as Ethereum in the future.
The lopsided institutional adoption between the two will make that difficult for Cardano unless it finds a use case, a feature/benefit, and a narrative that shakes up the retail Internet markets for cryptocurrency.
4. Cardano vs. Ethereum – Gas Fees (cat’s game)
There are lower and more predictable fees on Cardano, but higher fees on Ethereum are also a feature, not necessarily a bug. They make it more expensive to misuse the network for cybercrime that doesn’t pay, so it’s more secure. Big institutions like that.
That’s one reason why the industry leader, Bitcoin’s slow, expensive network, with a low transaction bandwidth holds its capital so well. In many ways these built-in costs qualify participants better than Know Your Customer policies and automatically and without discriminating on any basis other than ability and willingness to pay the network’s fees.
Still for newcomers, enterpreneurs, startups, and investors starting out with a smaller cash pile, smart contract blockchain networks with lower fees like Cardano have an advantage. Transaction fees on both networks are highly variable and spike during periods of high network use.
5. Ease Of Use – Cardano (another tie)
Some people in Web3 feel Ethereum has an ease-of-use problem. It’s become too overgrown with complicated, byzantine layers on top of layers, creating a steeper learning curve and potential security threats.
Blockchain advocate Daniel Cawrey wrote in a recent opinion article on Blockworks:
“Ethereum is becoming a multilayered lasagna-like system whereby complexity and fees are pushing people to the margins, causing interoperability and security concerns.”
While true, much like Ethereum’s higher transactions fees— the complexity of Ethereum may be a reason to be bullish for ETH. It could simply be proof of the network’s success. As Cawrey acknowledges in the piece, the network is beginning to achieve its “world computer” concept.
Any computer architecture expert would be hard-pressed to explain how a Turing-complete global computer that anyone can use on a peer-to-peer network would become anything but a flying spaghetti monster of complexity.
6. Ether vs. Cardano Whales (bullish ADA)
A massive 15,000 ETH whale deposit to Kraken on May 18 spotted by Whale Alert suggested a bear run on Ether by whales could be incoming, but after the SEC approved the spot Ethereum ETF a surge in whale-sized transactions has been net positive for the network, according to IntoTheBlock data.
Meanwhile, Cardano whales have been extremely bullish for ADA in May. They boosted holdings in Cardano tokens by 11% in a month. Whales tend to be smart money with some of the most advanced analytics and market outlooks to know what they’re doing, so that’s positively bullish for Cardano.
https://x.com/intotheblock/status/1790774801277042863
7. Ethereum vs. Cardano Memes (bullish ETH)
Meme coins are a definite advantage for Ethereum. While Cardano does have meme coins, none of them are notable and they have not topped the market cap charts like Ethereum’s SHIB, PEPE, and FLOKI.
Cardano has succeeded in making a simpler, lower-fee Ethereum, but crypto markets tend to reward projects that leaven their technology with some meme karma. Maybe an Orange Pill Moon Boys NFT collection or something with a dog on it would do the trick.
Binance Free $600 (CryptoPotato Exclusive): Use this link to register a new account and receive $600 exclusive welcome offer on Binance (full details).
LIMITED OFFER 2024 at BYDFi Exchange: Up to $2,888 welcome reward, use this link to register and open a 100 USDT-M position for free!


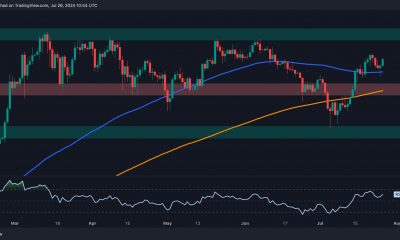

Bitcoin has recently experienced an uptick in demand near the crucial support region of the 100-day moving average, leading to a notable rebound.
This price action underscores a bullish sentiment in the market with the potential for a continued rally toward a new all-time high.
Technical Analysis
By Shayan
The Daily Chart
A detailed analysis of Bitcoin’s daily chart reveals that following a resurgence of demand near the critical $53K support area, the cryptocurrency initiated an impulsive bullish rally, surpassing several key resistance levels and introducing a bullish sentiment into the market.
These zones include the 200-day moving average at $60.5K, the 100-day moving average at $64.4K, and the static resistance at $61K. After breaking above the 100-day MA, the price recently exhibited a corrective retracement, completing a pullback to the broken level and validating the breakout.
Currently, Bitcoin has faced heightened buying pressure near the 100-day MA and experienced a bullish rebound toward the $67K threshold. If conditions remain stable, there is potential for the bullish trend toward the significant resistance region of $70K in the mid-term to continue.

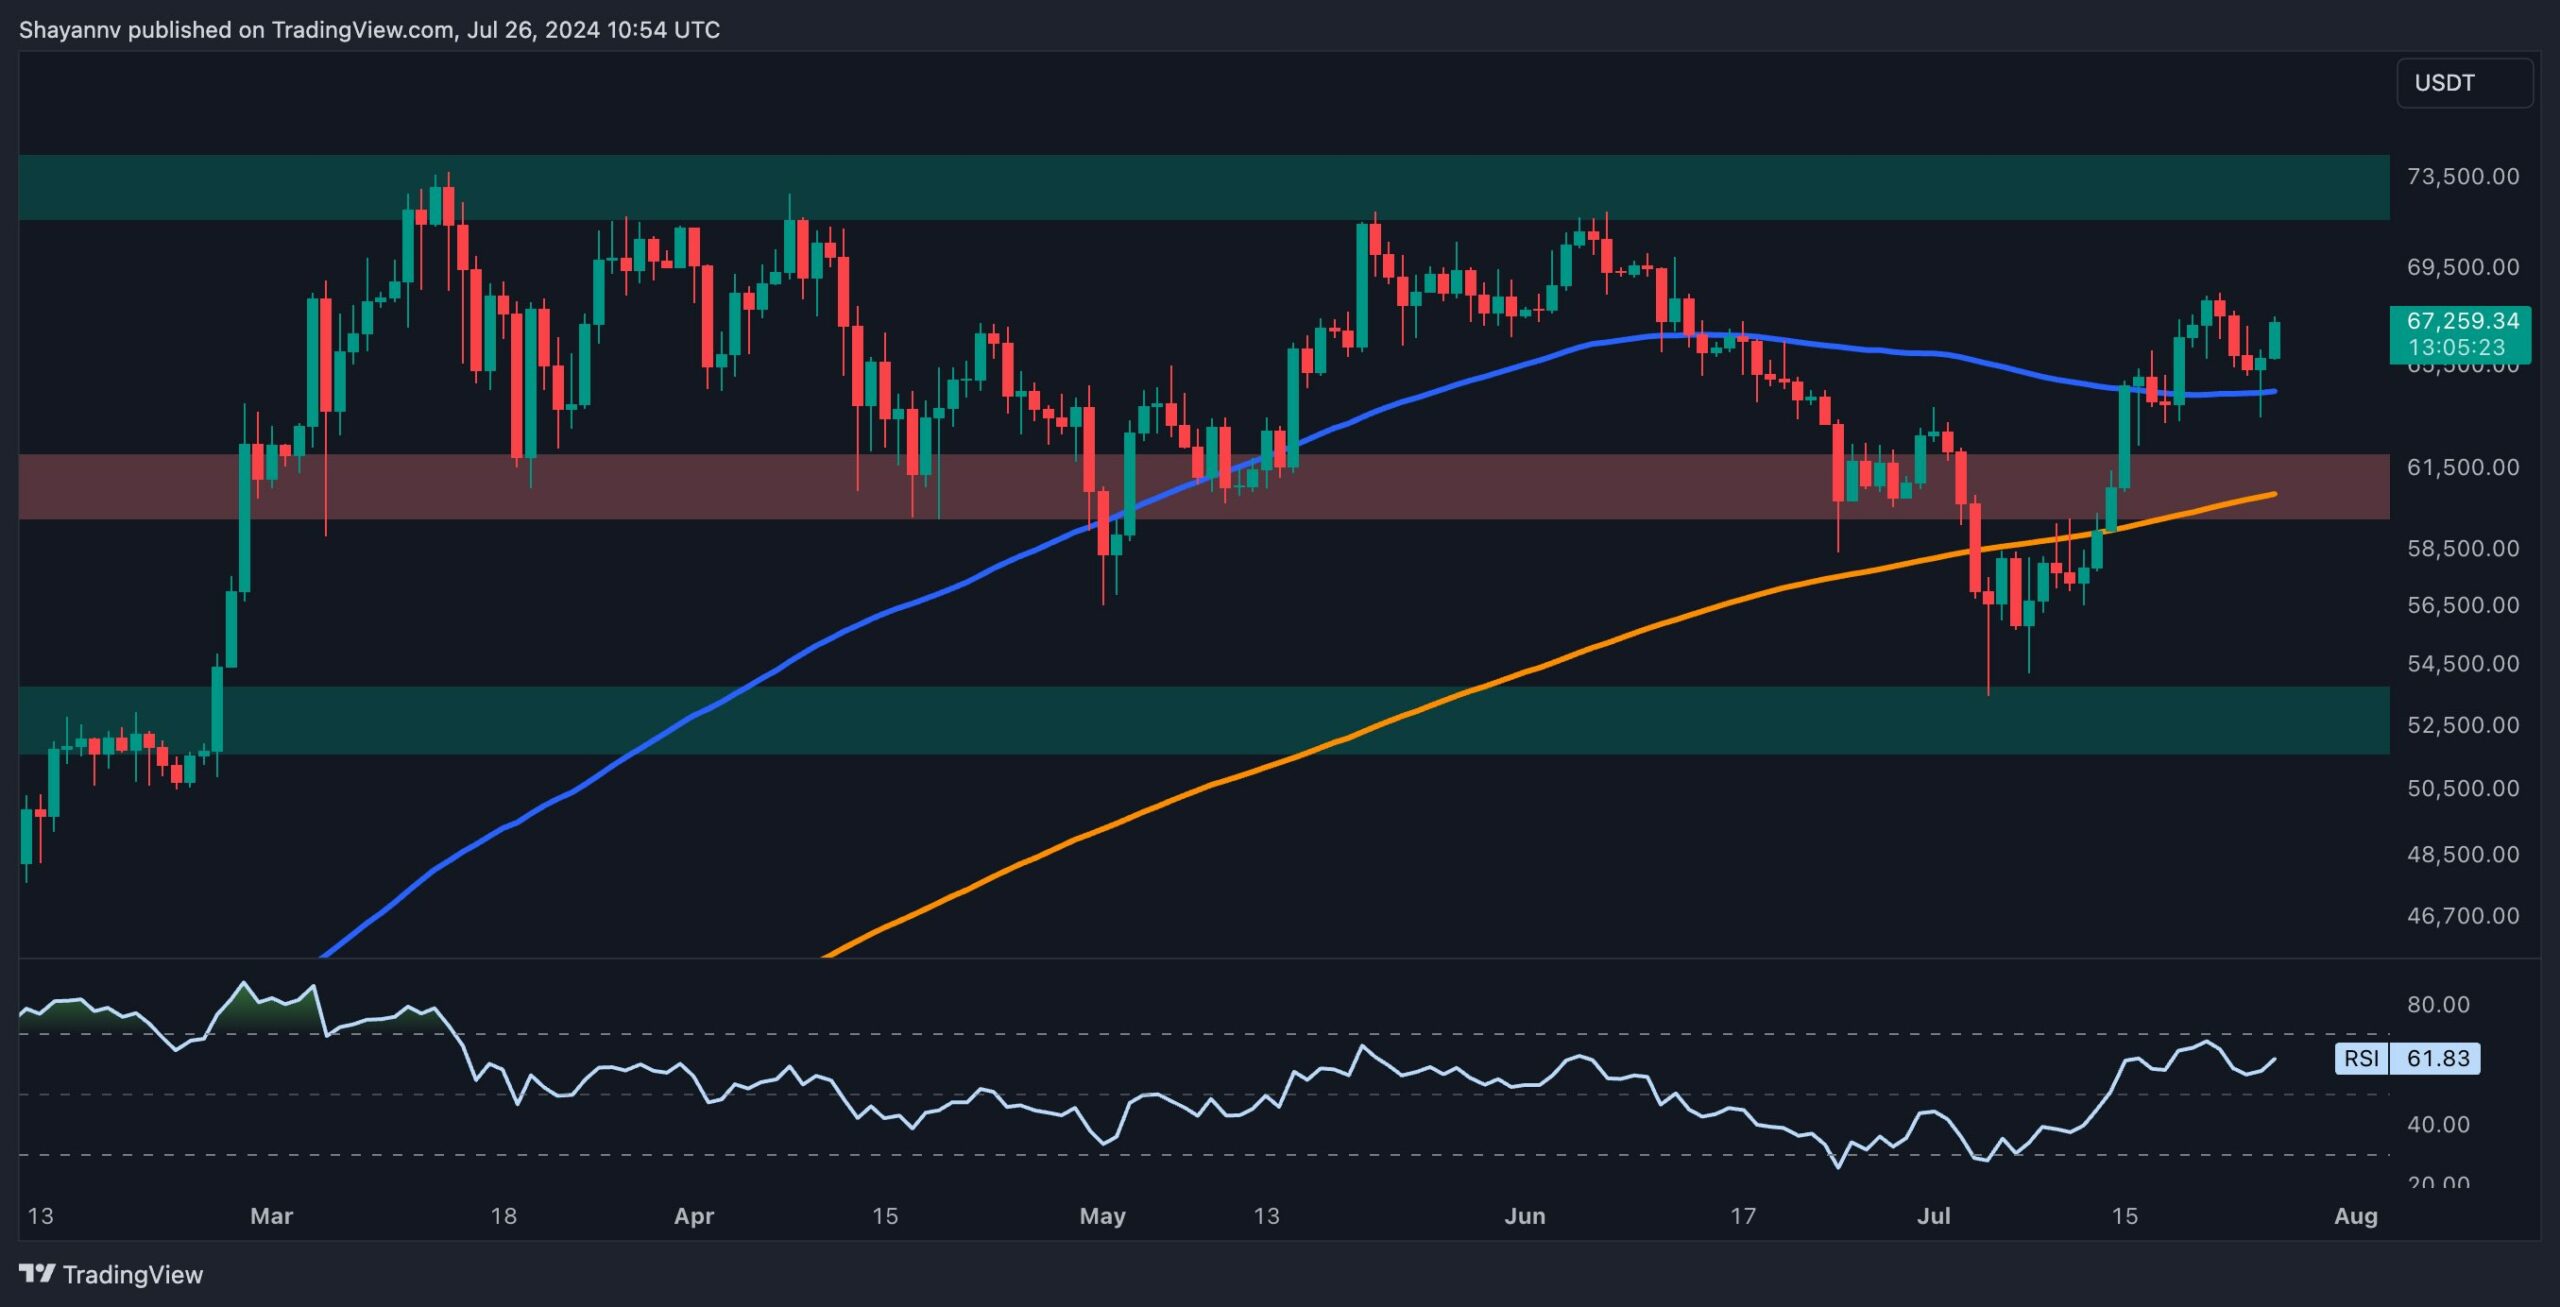
The 4-Hour Chart
On the 4-hour chart, after receiving sufficient support near the lower boundary of the multi-month wedge at $54K, the price initiated an impulsive bullish rally, reaching the wedge’s upper trendline at $68K.
This price action clearly indicates that buyers are eager to push above the $70K resistance and set a new ATH for Bitcoin in the mid-term. During the recent rally, the price has formed an ascending short-term trendline, serving as the main support for BTC in the short term.
However, Bitcoin faced increased selling pressure near the wedge’s upper boundary, leading to a notable rejection toward the upslope trendline and the $64K support region.
Yet, the cryptocurrency was supported by the trendline and the $64K threshold, initiating a new surge toward the wedge’s upper boundary. Currently, the price is confined by the dynamic support of the ascending trendline and the dynamic resistance of the wedge’s upper boundary, roughly forming a triangle pattern.
A break above the wedge’s upper trendline will pave the way for a renewed bullish surge toward the $70K threshold. Conversely, a break below the ascending trendline could lead to a retracement toward the $64K mark.

On-chain Analysis
By Shayan
While Bitcoin’s price has experienced a notable bullish reversal, a closer examination is essential to determine if this trend will persist.
The Taker Buy/Sell Ratio, a crucial metric for evaluating futures market sentiment, provides valuable insights into the market dynamics. Values above 1 indicate aggressive buying by bulls, while values below 1 suggest bearish selling pressure.
The chart highlights the Taker Buy/Sell Ratio, which has experienced an impulsive surge above the “1” threshold concurrently with Bitcoin’s bullish revival. This surge signifies strong buying interest in the perpetual market, indicating a notable bullish sentiment and significant buying activity. If the upward trend in the Taker Buy/Sell Ratio continues, it confirms a potential mid-term bullish trend, with the price likely rallying toward the $70K mark.

Binance Free $600 (CryptoPotato Exclusive): Use this link to register a new account and receive $600 exclusive welcome offer on Binance (full details).
LIMITED OFFER 2024 at BYDFi Exchange: Up to $2,888 welcome reward, use this link to register and open a 100 USDT-M position for free!
Disclaimer: Information found on CryptoPotato is those of writers quoted. It does not represent the opinions of CryptoPotato on whether to buy, sell, or hold any investments. You are advised to conduct your own research before making any investment decisions. Use provided information at your own risk. See Disclaimer for more information.
Cryptocurrency charts by TradingView.
Cryptocurrency
MEET48 “2024 GIPR2” Voting Event Final Results on August 3rd, Ranking Top on DappBay and DappRadar

[PRESS RELEASE – Singapore, Singapore, July 26th, 2024]
Recently, the “2024 GIPR2” voting event Dapp of MEET48, a metaverse virtual community based on an AI and WEB3.0 diversified UGC entertainment content ecosystem, has rapidly risen in the rankings on DappBay and DappRadar, attracting widespread attention.
The MEET48 “2024 GIPR2” voting event (https://gipr.meet48.xyz/#/gipr) is divided into the Idol Group, Sprout Group, and Virtual Idol Group. Users can log into the MEET48 official website and app, complete tasks and watch contestant videos to earn points, mint NFTs, and use points to buy voting tickets to vote for idols. The final voting rankings will determine the metaverse and overseas offline performance resources that participants will receive. Users who participate in voting interactions will also be whitelisted for future airdrop eligibility.
As of 12PM on July 26, 2024, the MEET48 event Dapp has become the number one social category Dapp on DappBay and ranked fifth in the social category on DappRadar.
According to DappRadar data, MEET48’s event Dapp recorded 25.25 million on-chain transactions in the past 30 days, with 669.98K active user addresses (UAW). In DappBay’s statistics, MEET48’s event Dapp also performed excellently, with 25.62 million on-chain transactions and 647K users in the past 30 days.
Currently, the MEET48 “2024 GIPR2” voting event Dapp has over 3 million registered users, and the total accumulated votes in the event have exceeded 10 million. These users, who joined through the airdrop, will eventually be integrated into MEET48’s intelligent social metaverse community through the MEET48 content ecosystem matrix products.
With the final results of the “2024 GIPR2” voting airdrop event set to be announced on August 3rd, MEET48’s popularity is expected to continue rising. For those who have not yet participated, there is still an opportunity to complete tasks and earn points to join the airdrop event:
https://gipr.meet48.xyz/#/gipr.
About MEET48
MEET48 currently boasts a technical and R&D team of 500 people, covering regional operations in Singapore, Hong Kong, Taipei, Tokyo, Seoul, and Dubai. This makes it one of the largest Web3 application project teams globally. MEET48 aims to achieve the mass adoption of Web3 technology by focusing on an AI UGC content ecosystem centered on AIGC (Animation, IDOL, GAME, and Comics) Gen Z trend entertainment content and a graphical, intelligent metaverse social base.
For more information users can visit MEET48’s: Official Website | Twitter (X) | Telegram | Discord
Binance Free $600 (CryptoPotato Exclusive): Use this link to register a new account and receive $600 exclusive welcome offer on Binance (full details).
LIMITED OFFER 2024 at BYDFi Exchange: Up to $2,888 welcome reward, use this link to register and open a 100 USDT-M position for free!
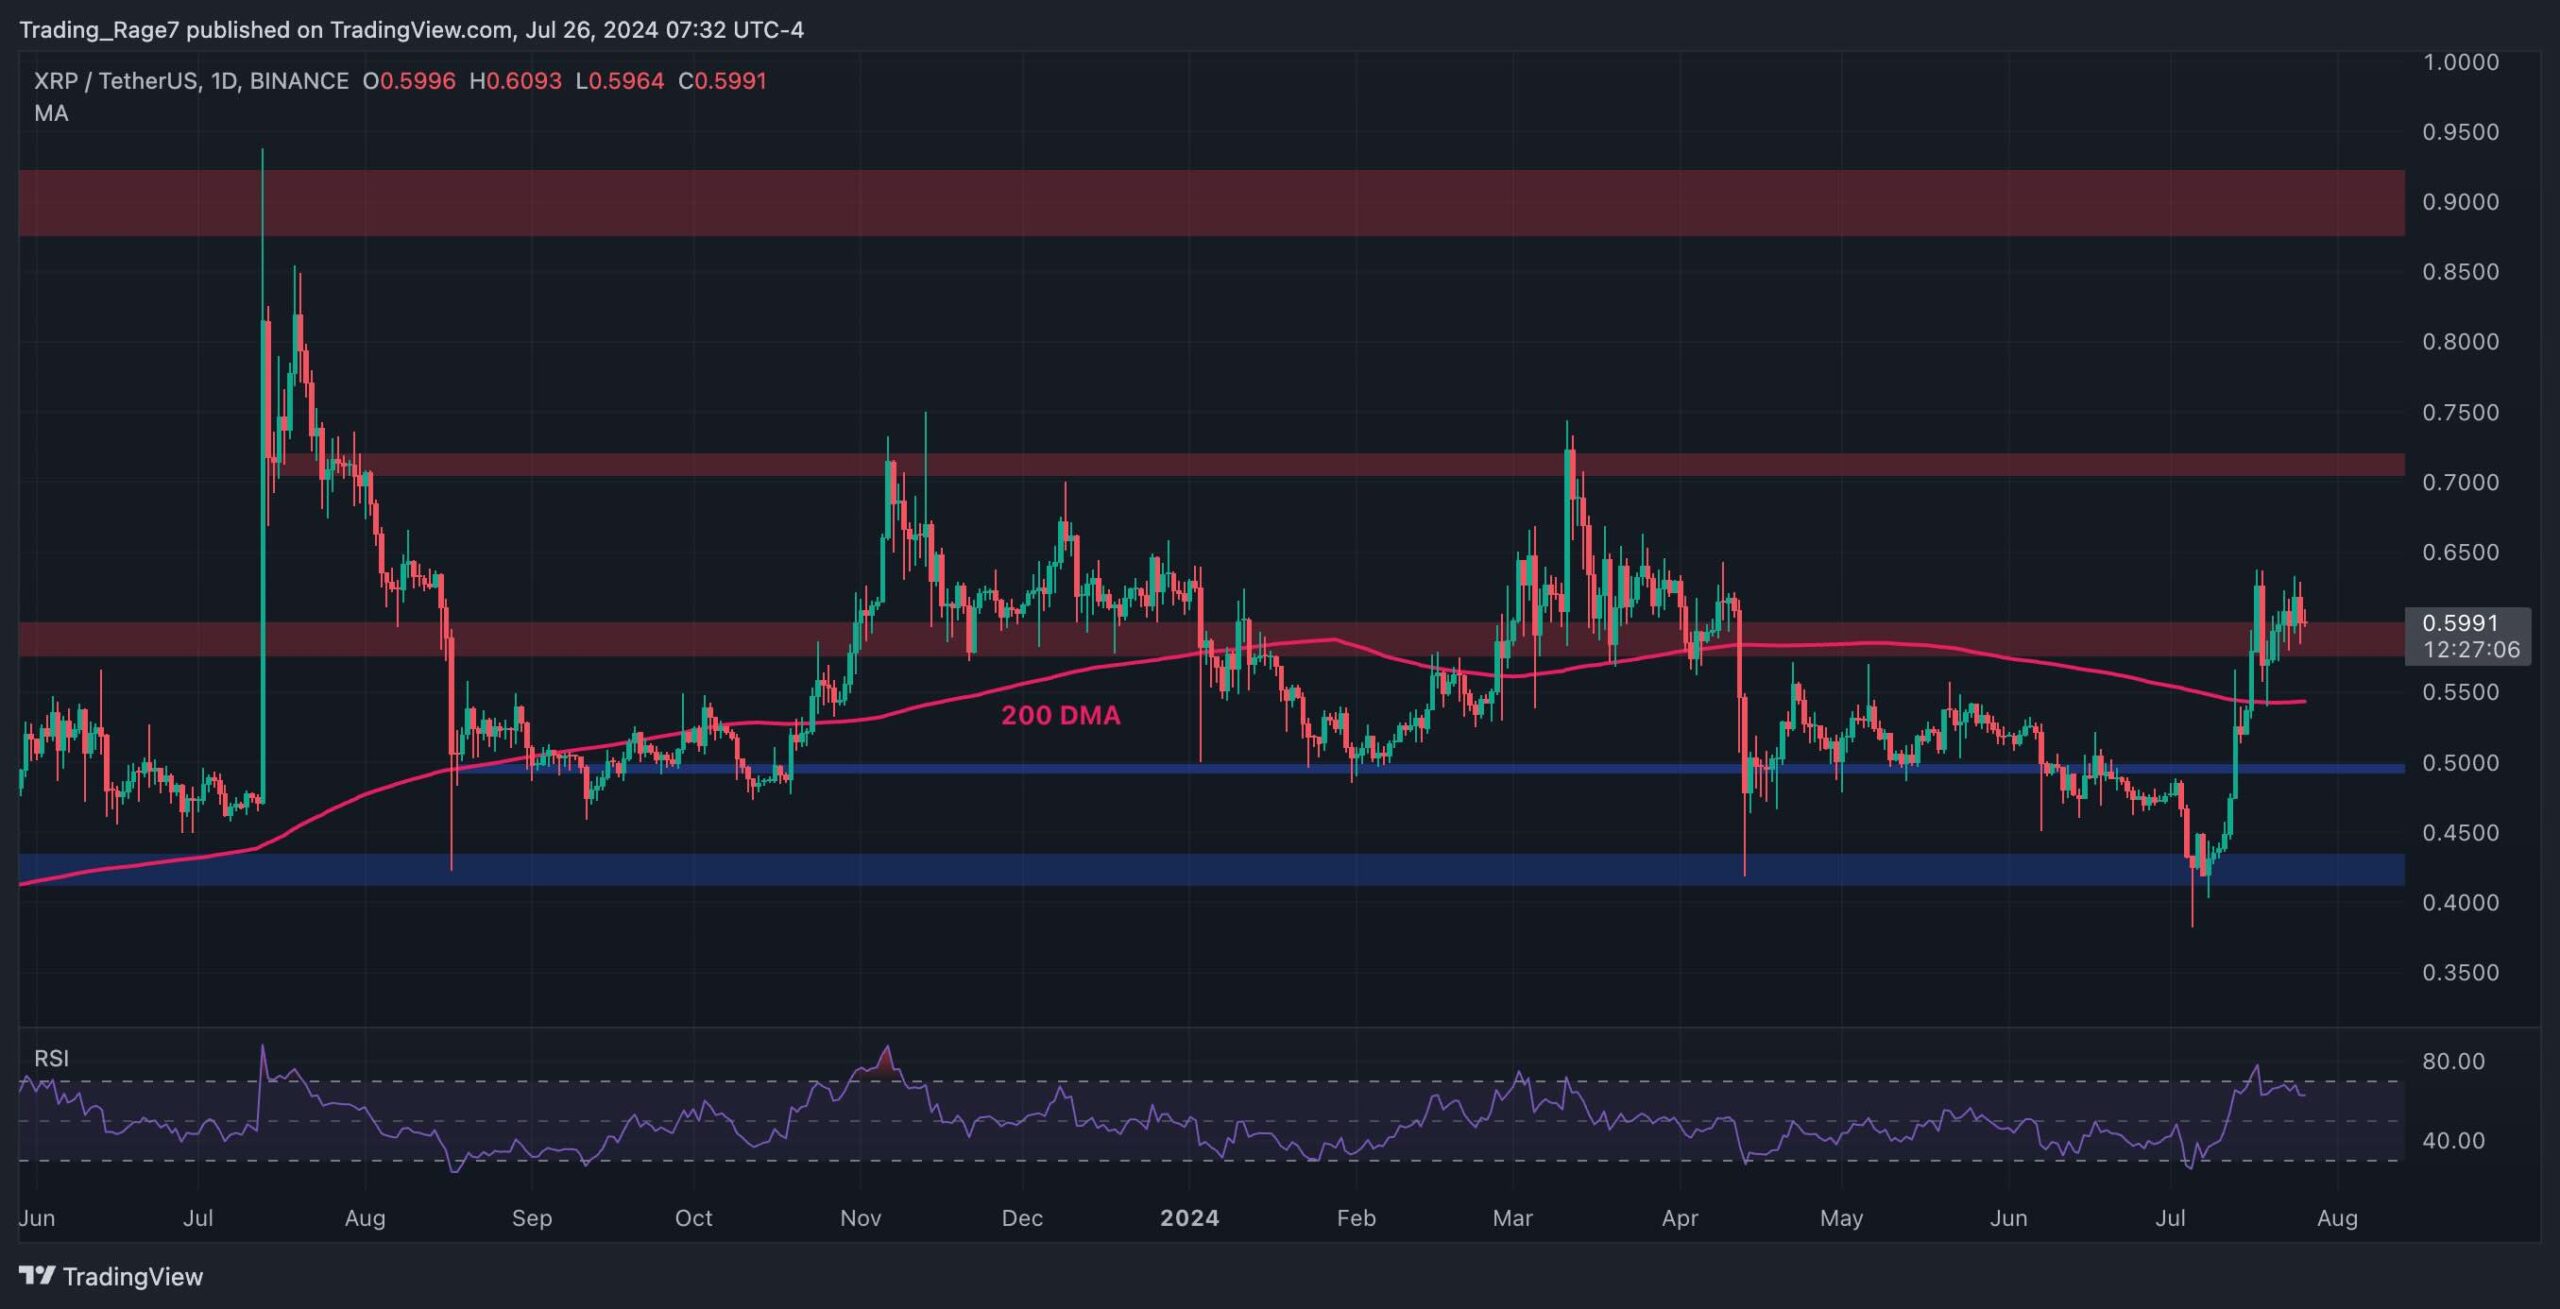
Ripple’s price is finally gaining some bullish momentum following months of downtrend and consolidation.
By TradingRage
The USDT Paired Chart
Analyzing the XRP/USDT pair, it is evident that the price has demonstrated a rapid recovery from the $0.43 support level. It broke above both the $0.5 level and the 200-day moving average, located around the $0.55 mark.
The price is currently on the verge of breaking above the $0.59 resistance zone and if it succeeds, a rally higher toward the key $0.72 resistance level would be probable in the coming weeks.

The BTC Paired Chart
The BTC paired chart also displays a similar behavior. The market has rebounded and broken above the 800 SAT level. Yet, the price has yet to break through the 200-day moving average, located around the 900 SAT mark.
Typically, a rise above the 200-day moving average indicates the beginning of a new uptrend. Therefore, if a breakout occurs, XRP will likely significantly appreciate against BTC in the short term.

Binance Free $600 (CryptoPotato Exclusive): Use this link to register a new account and receive $600 exclusive welcome offer on Binance (full details).
LIMITED OFFER 2024 at BYDFi Exchange: Up to $2,888 welcome reward, use this link to register and open a 100 USDT-M position for free!
Disclaimer: Information found on CryptoPotato is those of writers quoted. It does not represent the opinions of CryptoPotato on whether to buy, sell, or hold any investments. You are advised to conduct your own research before making any investment decisions. Use provided information at your own risk. See Disclaimer for more information.
Cryptocurrency charts by TradingView.

 Forex2 years ago
Forex Today: the dollar is gaining strength amid gloomy sentiment at the start of the Fed’s week
- Forex2 years ago
How is the Australian dollar doing today?
- Forex2 years ago
Unbiased review of Pocket Option broker
- Forex2 years ago
Dollar to pound sterling exchange rate today: Pound plummeted to its lowest since 1985
- Cryptocurrency2 years ago
What happened in the crypto market – current events today
- World2 years ago
Why are modern video games an art form?
- Stock Markets2 years ago
Morgan Stanley: bear market rally to continue
- Economy2 years ago
Crude oil tankers double in price due to EU anti-Russian sanctions