Cryptocurrency
Ethereum Poised to Retest $3.5K as Bullish Sign Reappear (ETH Price Analysis)
After experiencing a rapid downturn, Ethereum has found itself supported by a substantial zone, comprising the 100-day moving average and a critical price range between the 0.5 and 0.618 Fibonacci levels. Consequently, a bullish rebound is anticipated in the medium term.
By Shayan
The Daily Chart
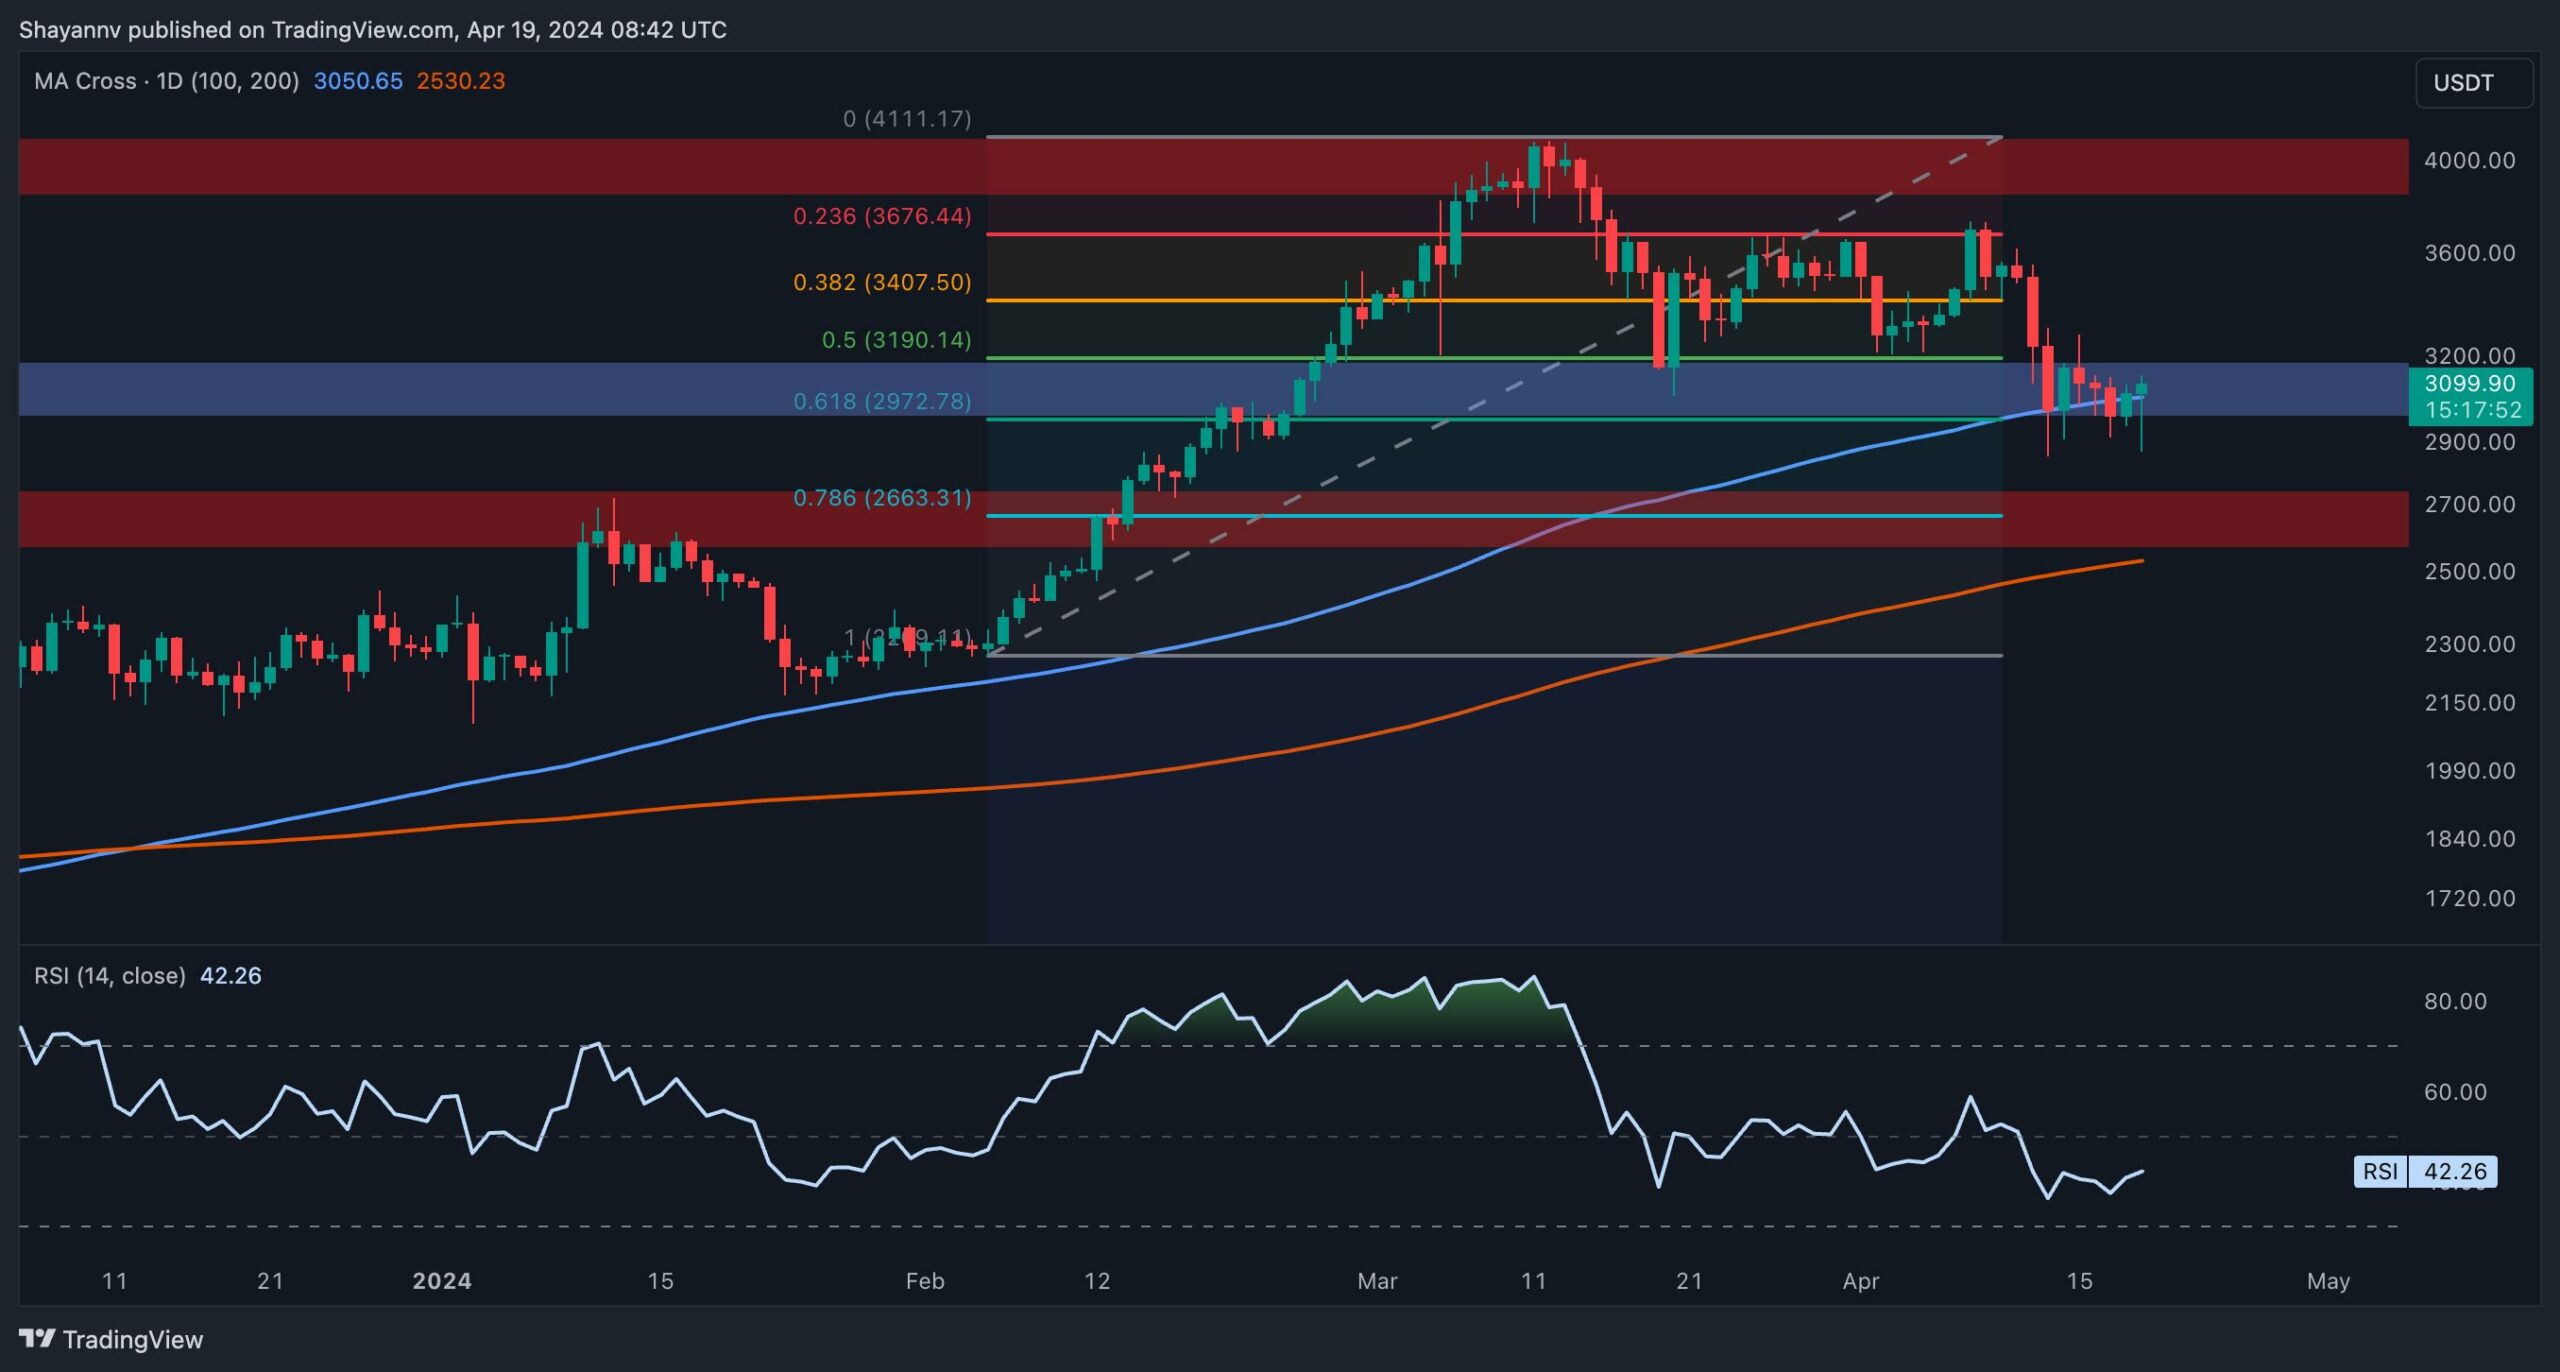
A thorough examination of the daily chart reveals an extended period of corrective retracements, culminating in the price finding support within a pivotal zone.
This zone encompasses the 100-day moving average at $3050 and the significant price range between the 0.5 ($3190) and 0.618 ($2972) Fibonacci levels.
This range carries significance as it attracts considerable demand, potentially hindering further downward pressure from market sellers. Additionally, a minor bullish divergence between the price and the RSI indicator suggests the potential for a bullish resurgence, targeting a reclaim of the $3.5K threshold. However, despite the bullish indications, an unexpected breach below this critical support zone could trigger a cascade effect toward the 200-day moving average at $2.5K.

The 4-Hour Chart
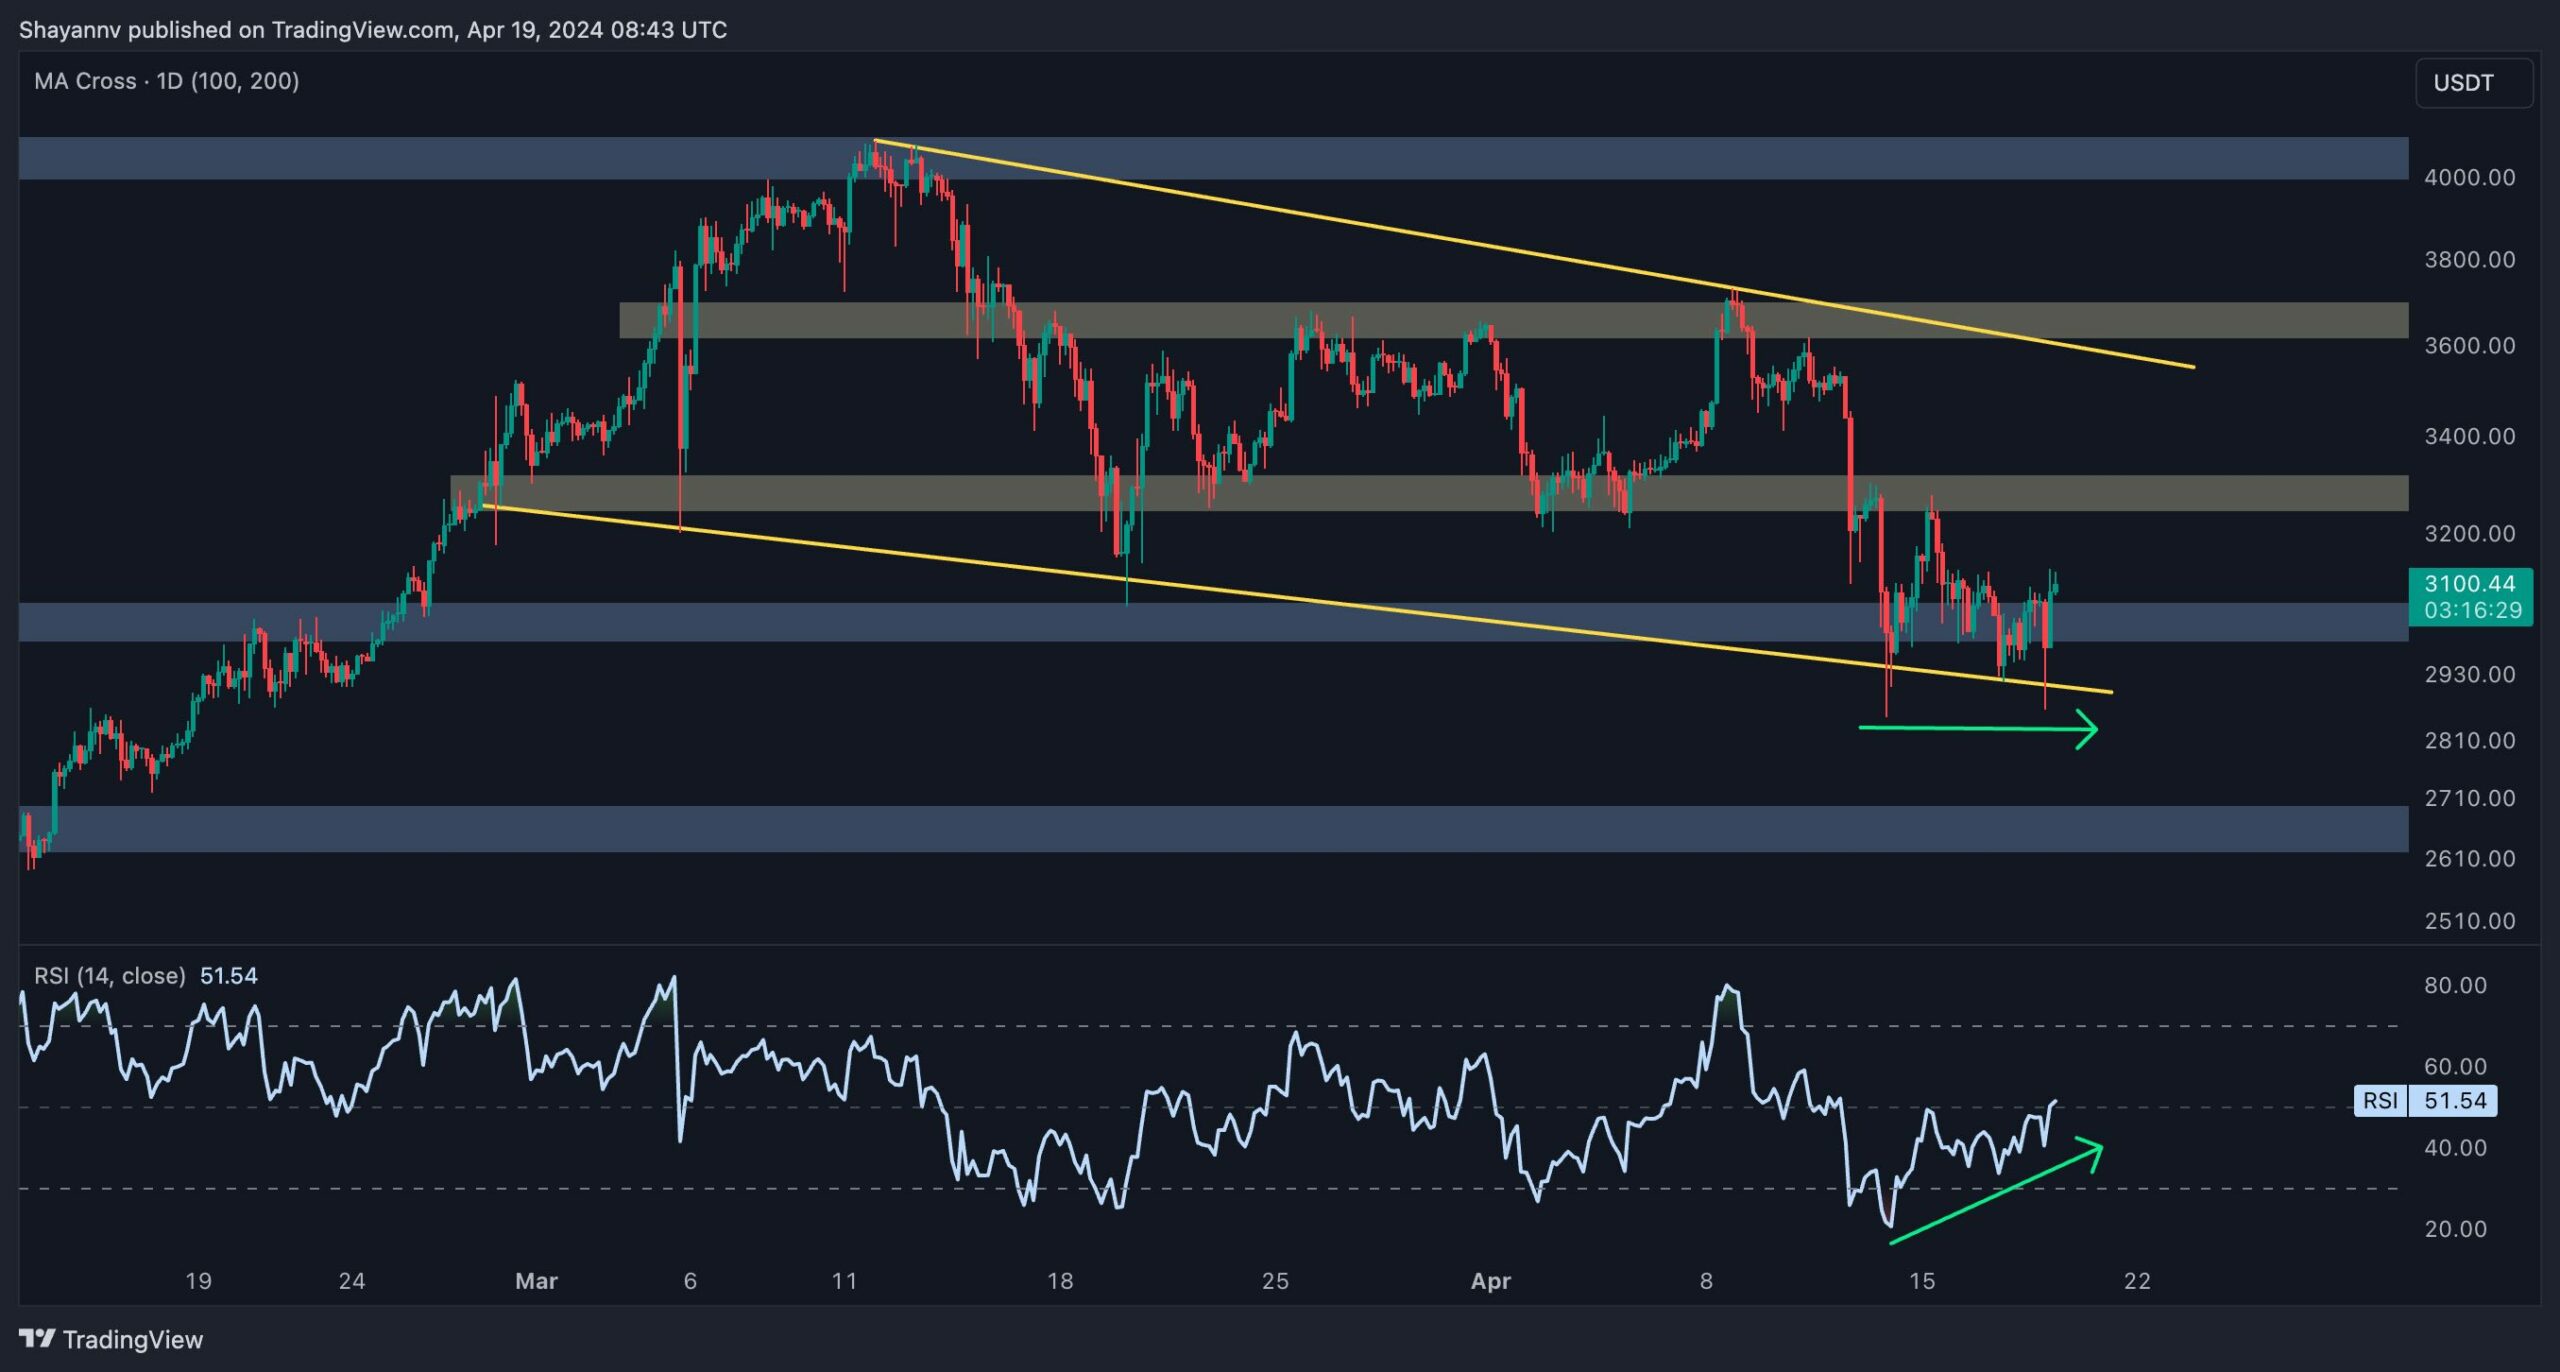
A closer inspection of the 4-hour chart reveals the formation of a descending wedge pattern during a multi-month consolidation correction. Following a significant decline, the price has reached the lower boundary of the wedge and the support region around $3K.
Nonetheless, given the potential buying pressure within this crucial range, the price has entered a consolidation phase characterized by minimal volatility.
This price action highlights a tug-of-war between buyers and sellers. Nevertheless, a noticeable divergence between the price and the RSI indicator on the 4-hour timeframe suggests the strength of buyers, increasing the likelihood of a bullish upswing in the medium term. In such a scenario, the next target for the price would be the critical resistance level at $3.5K. Conversely, should a break below this support occur, a descent toward the $2.7K support becomes increasingly probable.
By Shayan
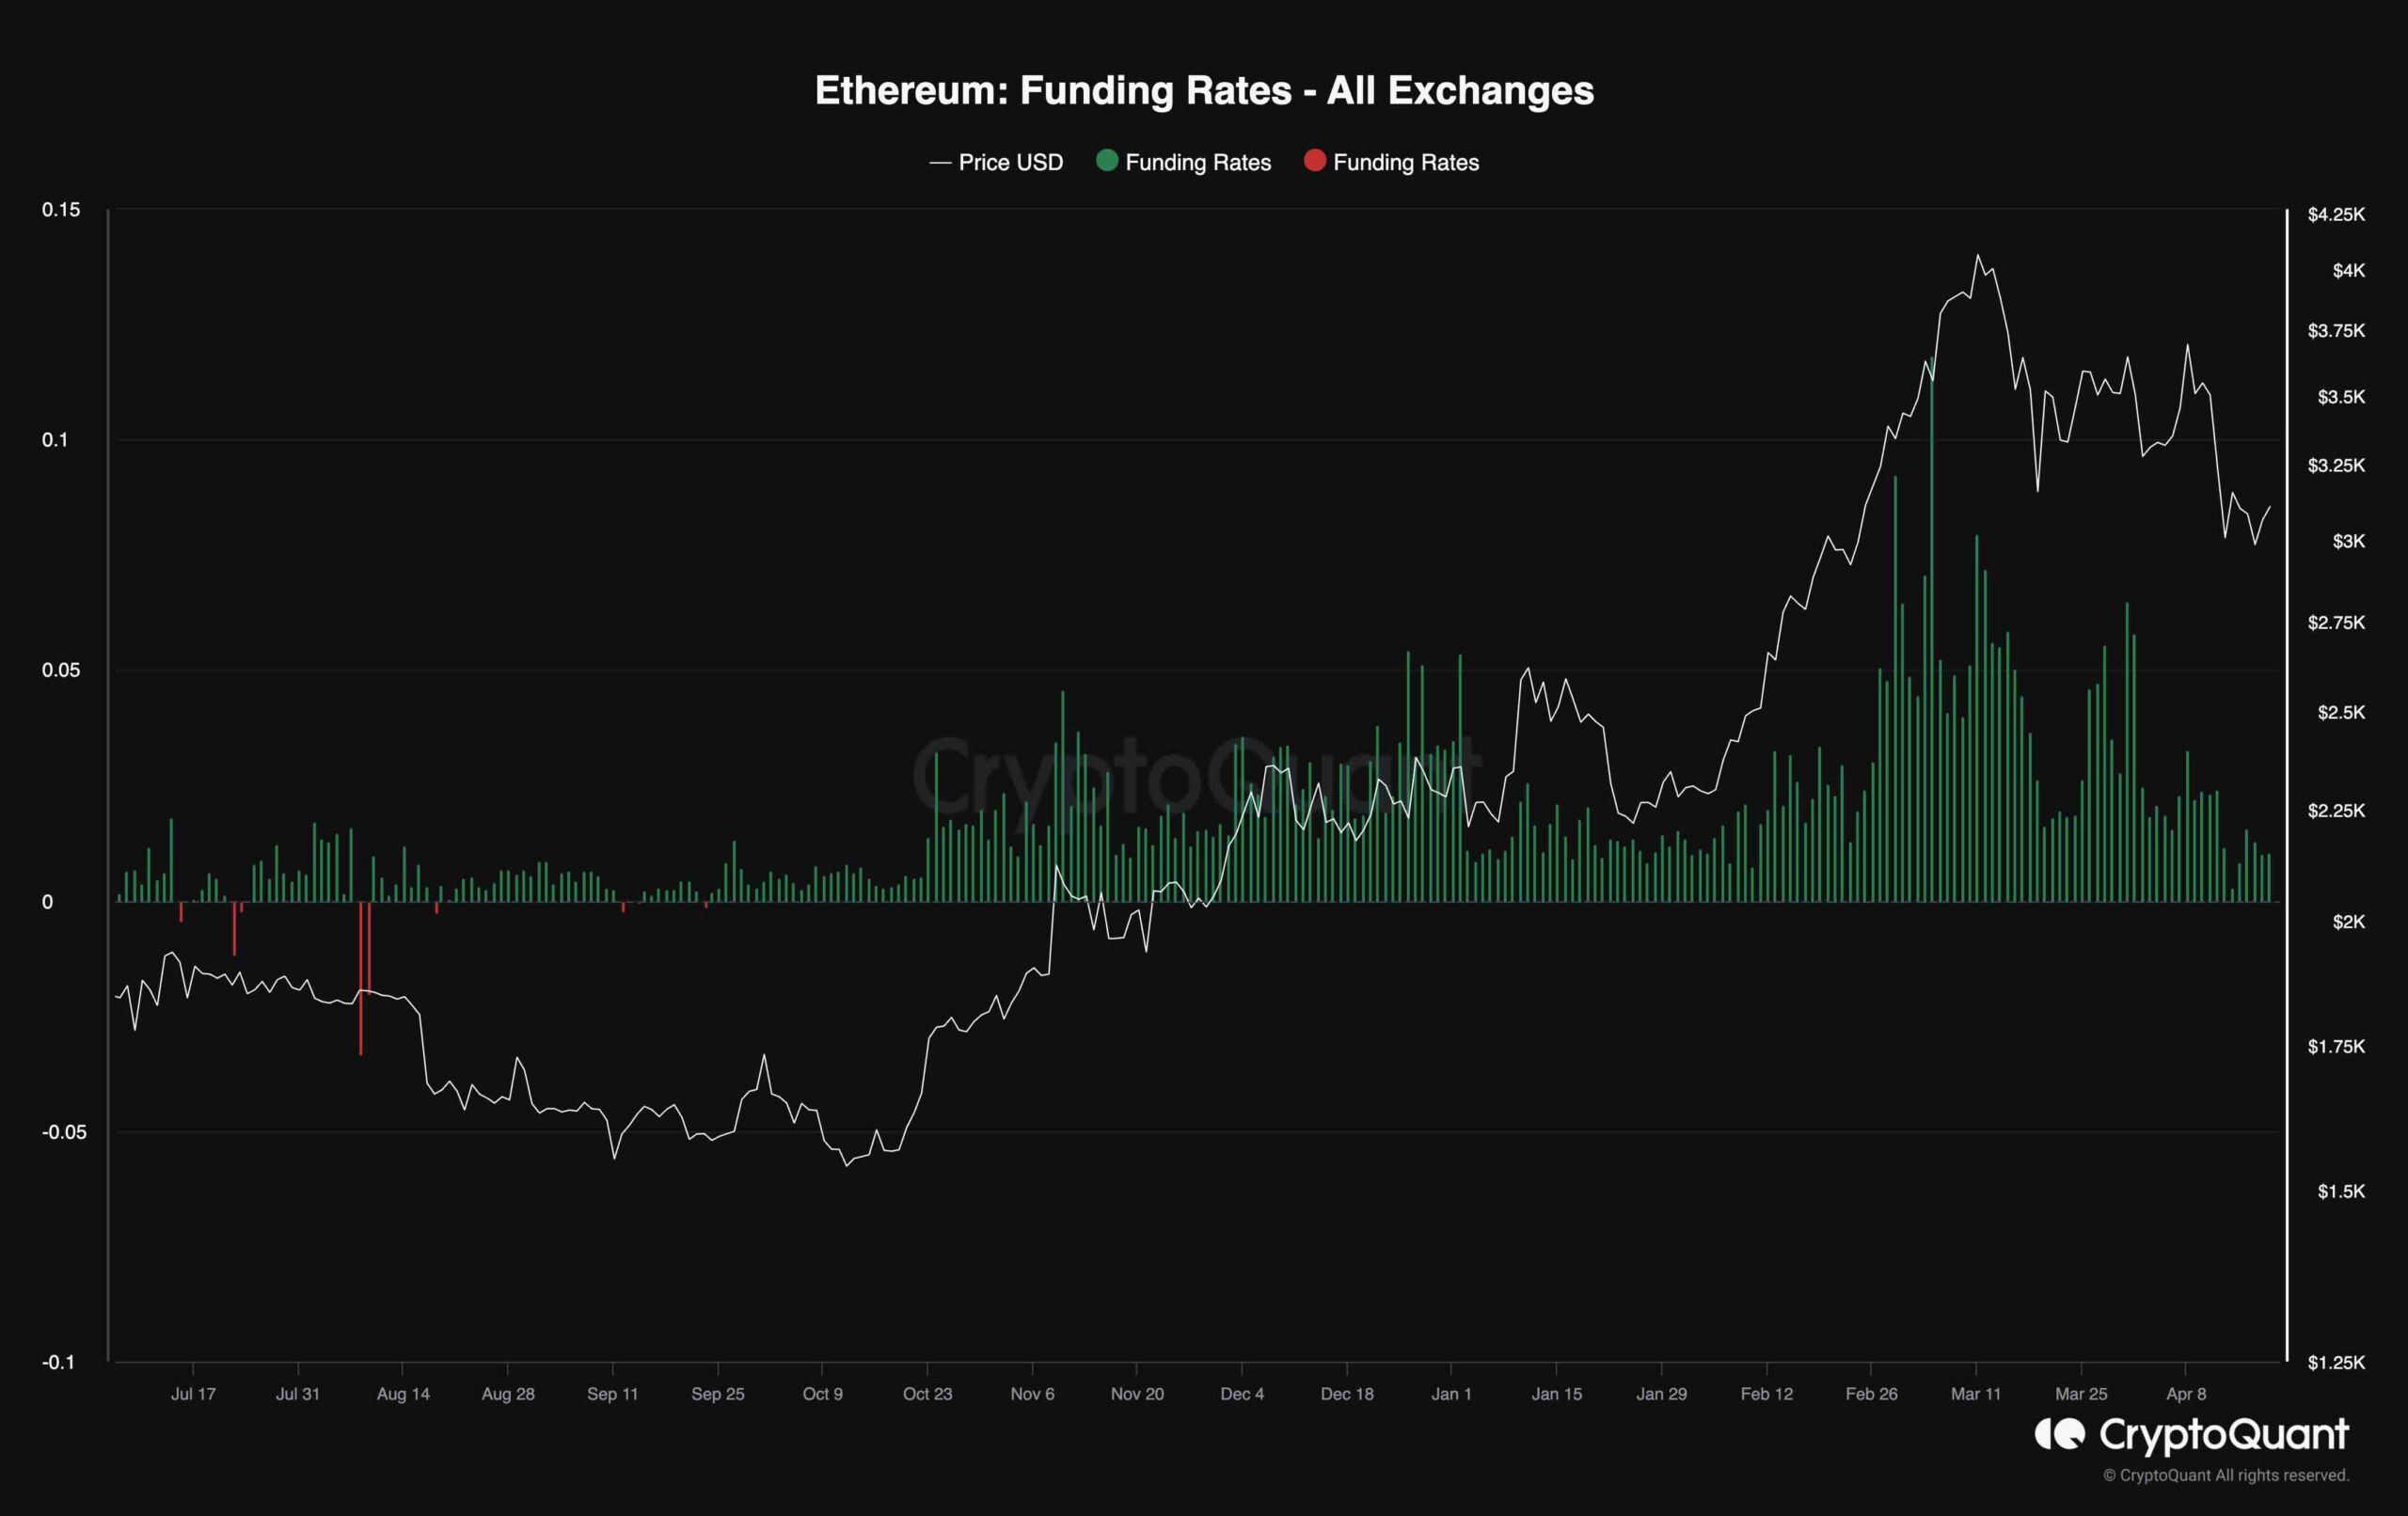
As Ethereum’s price exhibits signs of recovery, it’s crucial to determine whether this resurgence stems from spot buying or leveraged futures activity. A key metric for this analysis is the funding rates, where positive values signify bullish sentiment and negative values indicate fear in the market.
Observing the recent downtrend in Ethereum’s price, it’s notable that the funding rate metric has mirrored this trajectory, steadily declining until reaching near-zero levels. This alignment suggests that the recent price drop has led to the liquidation of a significant number of positions in the perpetual market, resulting in a cooling effect on the futures market. Consequently, the market appears primed for the re-emergence of long positions, with the potential for a fresh upward surge.
LIMITED OFFER 2024 for CryptoPotato readers at Bybit: Use this link to register and open a $500 BTC-USDT position on Bybit Exchange for free!
Disclaimer: Information found on CryptoPotato is those of writers quoted. It does not represent the opinions of CryptoPotato on whether to buy, sell, or hold any investments. You are advised to conduct your own research before making any investment decisions. Use provided information at your own risk. See Disclaimer for more information.
Cryptocurrency charts by TradingView.


Japanese crypto exchange bitFlyer announced that it has completed its acquisition of FTX Japan, making it a fully owned subsidiary.
The deal, finalized on July 26, will have bitFlyer taking 100% ownership of FTX Japan’s outstanding shares.
Crypto Custody Services
In a Friday press release, bitFlyer detailed its plans to rebrand the newly acquired entity as “Custody New Company” by August 26, 2024. This new entity will focus on expanding bitFlyer’s crypto custody business, leveraging the company’s existing operational resources and advanced wallet technology.
“By acquiring all shares and management rights of FTX Japan, we aim to achieve sustainable growth,” bitFlyer stated. “We will leverage synergies within the bitFlyer Group to develop new services, benefiting not only FTX Japan and its customers but all stakeholders of the bitFlyer Group.”
According to bitFlyer, the Custody New Company will focus on meeting the growing demand for secure crypto asset management among institutional investors.
“The increasing need for institutional investors to enter the crypto asset market and the need for professional security measures drive our strategy,” bitFlyer explained. “We believe that providing advanced crypto custody services and crypto asset ETF-related services will add significant value to the bitFlyer Group.”
bitFlyer also said that it is prepared to address this demand with advanced security measures, using its expertise in blockchain technology and security. The company has developed a highly secure wallet, which will be integral to its new crypto custody offerings.
The financial terms of the acquisition have not been disclosed. However, they stated that it is exploring the provision of services related to cryptocurrency derivatives ETFs while awaiting further legislative developments in Japan, including tax regulations. These offerings are aimed at meeting the needs of financial institutions and trust banks.
FTX Japan’s History
The acquisition follows a sale order issued by the U.S. Court of Insolvency on July 16, 2024. FTX Japan has been under Chapter 11 bankruptcy protection since November 2022, following the collapse of its parent company, FTX. The Japanese arm had stopped exchange operations after the bankruptcy filing but continued managing customer assets.
FTX Japan was launched in June 2022, facilitated by the acquisition of fintech company Liquid Group and its subsidiaries, including Quoine Corporation, one of Japan’s first crypto exchanges.
Despite its promising start, FTX Japan faced issues just five months later when its parent company collapsed amid allegations of embezzlement and misappropriation of billions of dollars in customer funds. FTX’s founder, Sam Bankman-Fried, was subsequently sentenced to 25 years in prison and ordered to reimburse $11 billion.
Binance Free $600 (CryptoPotato Exclusive): Use this link to register a new account and receive $600 exclusive welcome offer on Binance (full details).
LIMITED OFFER 2024 at BYDFi Exchange: Up to $2,888 welcome reward, use this link to register and open a 100 USDT-M position for free!
[PRESS RELEASE – VILNIUS, Lithuania, July 26th, 2024]
In a significant move this July 2024, BTCC has launched up to 50x leverage on over 300 USDT-margined trading pairs. This development follows the successful introduction of 500x leverage on major trading pairs, including BTC, ETH, XRP, SOL, and DOGE. BTCC has now decided to elevate the futures trading experience by increasing the available leverage from 20x to 50x, setting a new standard in the crypto trading world where most exchanges only provide up to 20x leverage for their traders.
Since this launch, nearly 25% of orders have been placed with 50x leverage, showcasing the strong demand among traders. The 300+ cryptocurrencies feature many of the coins in the market right now, such as PEPE, SATS, WIF, SHIB, ZK, WLD, AVAX, and TON.
Alex, Head of Operations at BTCC, commented on the launch, “In June, we introduced 500x leverage on major pairs, and the response was overwhelmingly positive. Our users have since been asking for higher leverage on other altcoins, especially memecoins. This feedback drove our decision to increase the leverage to 50x on over 300 trading pairs.”
The primary advantage of higher leverage can be the ability to open large market positions with a relatively small amount of capital, allowing traders to significantly amplify their potential profits. This feature can be attractive for experienced traders who can predict market movements. However, traders must be aware of the risks involved, and the stop-loss feature is an essential tool to help manage these risks effectively.
About BTCC Exchange
BTCC, established in 2011, is one of the world’s longest-serving and most reputable cryptocurrency exchanges. Known for its robust security measures and user-friendly platform, BTCC offers a wide range of features, including spot trading, futures trading, and copy trading, catering to both novice and experienced traders.
Website: https://www.btcc.com
Binance Free $600 (CryptoPotato Exclusive): Use this link to register a new account and receive $600 exclusive welcome offer on Binance (full details).
LIMITED OFFER 2024 at BYDFi Exchange: Up to $2,888 welcome reward, use this link to register and open a 100 USDT-M position for free!
A wallet associated with the Ethereum Foundation has transferred 92,500 ETH, worth $294.9 million, after being inactive for nearly 6.6 years.
According to Lookonchain, these tokens have been held at the same address since 2017.
The Transfer Details
On-chain data indicates that the ETH was originally received from the Ethereum Foundation on September 1, 2015. The transfer, recorded on July 25, occurred just minutes after a smaller transaction of 1 ETH from the same wallet.
Before the transaction, the only other one from this address in the past seven years was a negligible movement of 0.000513 ETH 30 days ago.
An #EthereumFoundation-related wallet transferred 92,500 $ETH($294.9M) to a new wallet 9 hours ago after being dormant for 6.6 years.
Through on-chain tracking, it was found that these $ETH were received from the #EthereumFoundation on Sept 1, 2015.https://t.co/FKGsNCrBAT pic.twitter.com/vPOAMq4ccK
— Lookonchain (@lookonchain) July 26, 2024
At writing time, Etherscan shows that the funds remain in the new wallet. The reasons behind this transfer are still unknown, and the Ethereum Foundation has not commented on the situation.
Before this, the organization had not engaged in any major selling activity in the current market cycle, causing speculation about a potential change in strategy.
Analysts noted that, historically, the Foundation had strategically sold large amounts of ETH during each bull market, often timing these sales with market peaks. The absence of significant sales in the current cycle had raised questions about whether the market peak was still ahead or if the Foundation had altered its approach.
On July 25, the price of ETH dropped by 10% as spot Ethereum ETFs experienced $133 million in outflows on their second day. The asset fell from nearly $3,500 to a multi-day low of $3,130. At the time of writing, the token is trading at $3,266, having increased by 3% in the last 24 hours.
Previous Ethereum Foundation Transfers
Earlier in July, other wallets linked to the Ethereum Foundation made some transfers. On July 17, according to on-chain analytics firm SpotOnChain, an Ethereum Foundation wallet and another connected to an Ethereum initial coin offering (ICO) participant transferred $12.5 million and $9 million worth of ETH, respectively, to Kraken.
Two #Ethereum Foundation/ICO-related wallets deposited 3,631 $ETH ($12.5M) to #Kraken in the past 2 days as the market rebounded:
1️⃣ Wallet 0xdb3 unloaded 2,631 $ETH ($9.01M).
• It received $ETH from the Ethereum Foundation and Ethereum ICO participant 0xAb0.
• Since June 8,… pic.twitter.com/rpEC1Fe4jj
— Spot On Chain (@spotonchain) July 17, 2024
Since early June, these two wallets have deposited a total of 17,886 ETH, valued at around $65 million, to the centralized cryptocurrency trading platform, suggesting a possible sell-off.
In January, Arkham Intelligence identified a blockchain address associated with the Ethereum Foundation that sold $1.6 million worth of ETH.
Then, in April, Peckshield Alert reported that the Foundation had converted part of its ETH holdings into stablecoins, exchanging 100 ETH for 354,000 DAI during a time when ETH was trading above $3,600.
Binance Free $600 (CryptoPotato Exclusive): Use this link to register a new account and receive $600 exclusive welcome offer on Binance (full details).
LIMITED OFFER 2024 at BYDFi Exchange: Up to $2,888 welcome reward, use this link to register and open a 100 USDT-M position for free!

 Forex2 years ago
Forex Today: the dollar is gaining strength amid gloomy sentiment at the start of the Fed’s week
- Forex2 years ago
How is the Australian dollar doing today?
- Forex2 years ago
Unbiased review of Pocket Option broker
- Forex2 years ago
Dollar to pound sterling exchange rate today: Pound plummeted to its lowest since 1985
- Cryptocurrency2 years ago
What happened in the crypto market – current events today
- World2 years ago
Why are modern video games an art form?
- Stock Markets2 years ago
Morgan Stanley: bear market rally to continue
- Economy2 years ago
Crude oil tankers double in price due to EU anti-Russian sanctions