Cryptocurrency
Litecoin (LTC) has formed a double top. What to expect
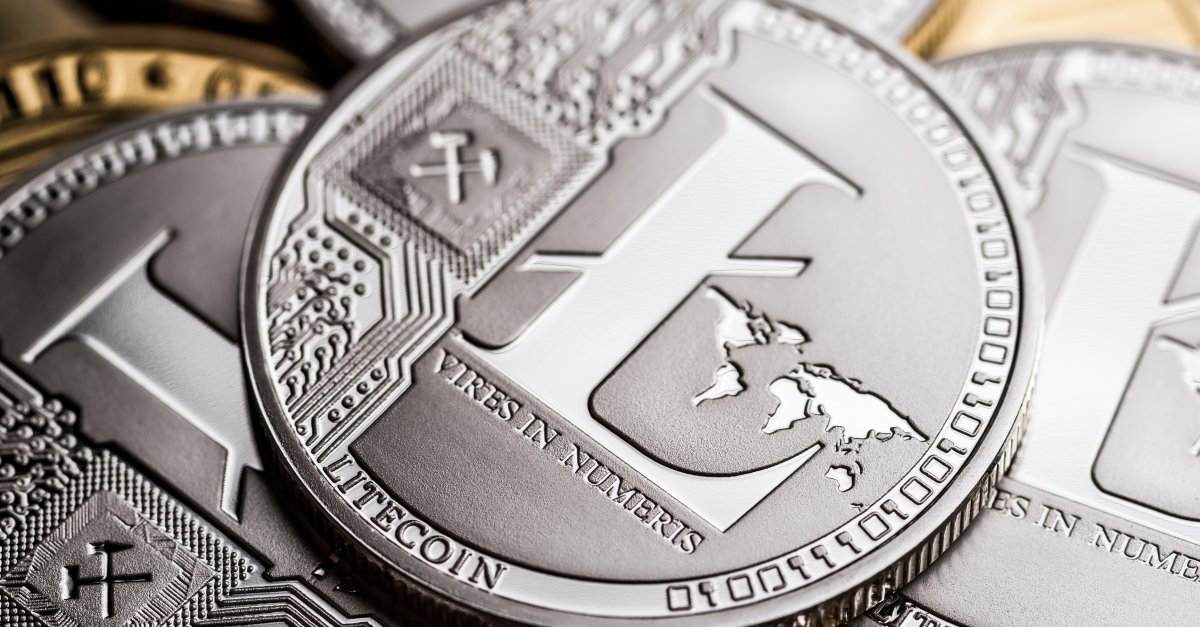
Litecoin (LTC) has been declining since mid-February. It is now trading within a short-term bullish pattern, but the long-term trend is still bearish.
Litecoin gives bearish signals
As the results of the technical analysis of the weekly chart show, LTC has been rising since June 2022 and reached a yearly high of $105.80 in February 2023.
However, the price didn’t overcome long-term horizontal resistance at $100. It bounced twice from this level (red icons). Because of these bounces, a double top has formed on the chart. It is a bearish pattern that may cause a significant decline in LTC. Shortly after the appearance of this pattern, the price began to fall.
Moreover, the Weekly Relative Strength Index (RSI) gives signals that are unfavorable to the coin. It is a momentum indicator, which indicates that the market is overbought/oversold and bullish/bearish, depending on whether it is above or below the 50 level.
Against the backdrop of a double top, it formed a bearish divergence signal. You can talk about such a divergence when the price rally is not accompanied by a rise in Momentum. The RSI is around 50 and a pullback below that line would indicate a bearish trend.
Can LTC reverse the bearish trend?
The shorter 6-hour timeframe paints a more positive picture for LTC. It implies the potential for a price rebound, at least in the short term. Three factors speak in favor of this scenario.
First, the token is trading inside a descending parallel channel. This pattern is considered corrective, so its southerly direction suggests that the broader trend for the currency is bullish and eventually the price is likely to make a northward breakout from this channel.
Also, the LTC is trading at the top of this channel, which further increases the likelihood of a bullish breakout. Litecoin has also recovered above the $79 support area after a short drawdown below it (red circle). Usually after such price deviations a rise starts, because it means that the sellers didn’t sell the price down.
We previously reported on why bitcoin fell and what the U.S. government has to do with it.


Bitcoin (BTC) has sent the crypto community into delirium, hitting a new all-time high (ATH) of almost $119,000 after brief stops around $113,000 and $116,000.
However, despite the excitement, prominent analyst CrediBULL Crypto has cautioned traders not to chase the rally blindly, suggesting that the real opportunity lies in altcoins, not Bitcoin.
Why BTC FOMO Could Be Costly
With BTC currently over 650% above its ideal accumulation zone, CrediBULL posted a stark warning on X:
“The big opportunity for gains is on ALTS even if Bitcoin is the one that is ‘leading’ this move.”
He added that anyone buying the asset at this particular point should only do so for an active trade with a clear setup.
“If you can’t identify a trade setup then there is no reason to buy Bitcoin at these levels as there are much better opportunities in alts from a R/R perspective at current levels.”
His comments echoed a broader sentiment emerging from key market voices, including former BitMEX CEO Arthur Hayes and YouTuber Crypto Rover, who likened the current market cycle to November 2024, when a major altcoin rally followed Bitcoin’s price surge.
In a recent tweet, Hayes said he had reversed his previously bearish stance, citing Bitcoin’s strong breakout and the rising dominance of Ethereum (ETH).
“Get ready for a monster alt szn,” he wrote, signaling increased institutional confidence. The crypto entrepreneur also reported that his Maelstrom Fund is ramping up altcoin exposure amid expectations of favorable political and macroeconomic shifts.
Observers have described the flagship cryptocurrency’s latest move as structurally different from past bull cycles. According to CryptoQuant, it isn’t driven by speculative angst, but rather by strategic accumulation and restrained selling activity.
Additionally, metrics like the MVRV ratio, currently 2.2 vs. over 2.7 in previous tops, SOPR, and MPI all hint at a sustainable rally with long-term potential. The drop in exchange balances, down over 21% in four months, also suggests that holders are in no rush to exit their positions.
Altcoins on the Mend
However, even with BTC in price discovery mode, Ethereum and several other altcoins are beginning to outshine it in percentage gains. ETH, for instance, is up by more than 18% in the last seven days, beating Bitcoin’s 8.9% rise in the same period. It has also reclaimed the $3,000 level and is setting its sights on $3,350–$3,500.
Meanwhile, Cardano (ADA) has pumped 23.7% across the week, reclaiming critical support at $0.64 and eyeing a return to $1. Hyperliquid (HYPE) is up nearly 19%, having set a new all-time high at $46.25, and is now targeting the $50 psychological threshold.
Even Solana (SOL) is catching a bid, with prices climbing above $164 and showing potential for a rally beyond $180.
Binance Free $600 (CryptoPotato Exclusive): Use this link to register a new account and receive $600 exclusive welcome offer on Binance (full details).
LIMITED OFFER for CryptoPotato readers at Bybit: Use this link to register and open a $500 FREE position on any coin!

TL;DR
- The consolidation phase for many altcoins, including XRP, seems to be over, and Ripple’s native token is on the run again toward $3.
- On its way up, it managed to surpass USDT in terms of market cap and is now back in the third spot after months of hiatus.

The graph above clearly demonstrates the price stagnation XRP had to endure for the past month or so. Its upper boundary was at around $2.6, while it also tested the lower one at $1.9 during the darkest hours of the war between Israel and Iran.
Nevertheless, each attempt met immediate rejections, and the cryptocurrency was pushed south to a tight range between $2.2 and $2.3. However, there were multiple signs that the consolidation could be coming to an end, and one analyst even warned that most traders will miss the breakout.
Such a price surge indeed started to materialize in the past few days, and especially today. XRP has been among the top performers on a daily scale, having surged by 20% at one point and coming close to $3 on most exchanges.
Although it was stopped there and now sits just under $2.8, it’s still up by over 12% since yesterday. Its market cap has spiked above $160 billion for the first time in months, and XRP has now become the third-largest cryptocurrency, by overtaking Tether’s USDT.
The move north was quickly picked up by the XRP Army, many of whom praised the asset’s performance and provided some bullish (and outrageous) predictions.
$XRP at $2,500 isn’t just a dream.
-Because a pump like 2017 would easily clear $2,000 ✅
Fact: The yearly resistance is now free so expect vertical price discovery. pic.twitter.com/A4G3PasuVk
— Crypto Bitlord (@crypto_bitlord7) July 11, 2025
Binance Free $600 (CryptoPotato Exclusive): Use this link to register a new account and receive $600 exclusive welcome offer on Binance (full details).
LIMITED OFFER for CryptoPotato readers at Bybit: Use this link to register and open a $500 FREE position on any coin!

BitMEX co-founder Arthur Hayes has decisively flipped bullish and even announced that Maelstrom Fund is “backing up the truck.” The exec’s comments came as Bitcoin (BTC) broke through its all-time high above $118K on strong volume.
He also revealed that Ethereum (ETH) began to follow with potential outperformance, and markets began pricing in a Trump administration’s readiness to ease trade tensions.
From Bearish to Bullish
This pivot follows Hayes’ prior cautious stance, which was rooted in concerns about a Treasury General Account (TGA) refill draining liquidity.
In his previous essay, Hayes explained that the US Treasury Secretary, whom he calls “The Big Bessent Cock (BBC),” faces an impossible task: funding ballooning deficits without causing a bond market revolt. To manage this, the government is turning to innovative liquidity engineering, including stablecoin adoption by “too big to fail” (TBTF) banks, which could unlock up to $6.8 trillion in T-bill buying power.
Hayes also noted that if the Fed stops paying interest on reserves, it could unleash another $3.3 trillion, bringing the total potential liquidity injection to $10.1 trillion.
He argued this approach was the modern replacement for QE, by maintaining equity markets and crypto afloat despite the Fed’s tightening posture. The exec warned that the TGA refill could briefly interrupt crypto’s bull momentum.
Despite this, Bitcoin’s resilience in busting through resistance while Ethereum appears to be positioning for a “monster alt season.”
“Frontloading Ahead of Trump Tariffs”
Adding to this backdrop, QCP Capital, in its latest analysis, also identified frontloading ahead of potential Trump tariffs as a key macro driver. Manufacturers are accelerating imports and production to preempt implementation, which has led to increased trade and manufacturing credit and improved liquidity conditions.
The firm views the current environment as supportive for continued crypto upside, with steady ETF inflows and strong structural demand boosting momentum.
Binance Free $600 (CryptoPotato Exclusive): Use this link to register a new account and receive $600 exclusive welcome offer on Binance (full details).
LIMITED OFFER for CryptoPotato readers at Bybit: Use this link to register and open a $500 FREE position on any coin!

 Forex3 years ago
Forex Today: the dollar is gaining strength amid gloomy sentiment at the start of the Fed’s week
- Forex3 years ago
Unbiased review of Pocket Option broker
- Forex3 years ago
Dollar to pound sterling exchange rate today: Pound plummeted to its lowest since 1985
- Forex3 years ago
How is the Australian dollar doing today?
- Cryptocurrency3 years ago
What happened in the crypto market – current events today
- World3 years ago
Why are modern video games an art form?
- Commodities3 years ago
Copper continues to fall in price on expectations of lower demand in China
- Economy3 years ago
Crude oil tankers double in price due to EU anti-Russian sanctions


