Cryptocurrency
Polkadot Price Analysis: DOT Soars 4% Daily as Traders Brace for Incoming Volatility
After a period of subdued consolidation near the crucial $6 support region, Polkadot’s price encountered significant buying pressure, initiating a notable upward swing.
As a result, the crucial 0.5 Fibonacci level ($8.8) appears to be Polkadot’s next mid-term target.
Polkadot Price Analysis: Technicals
By Shayan
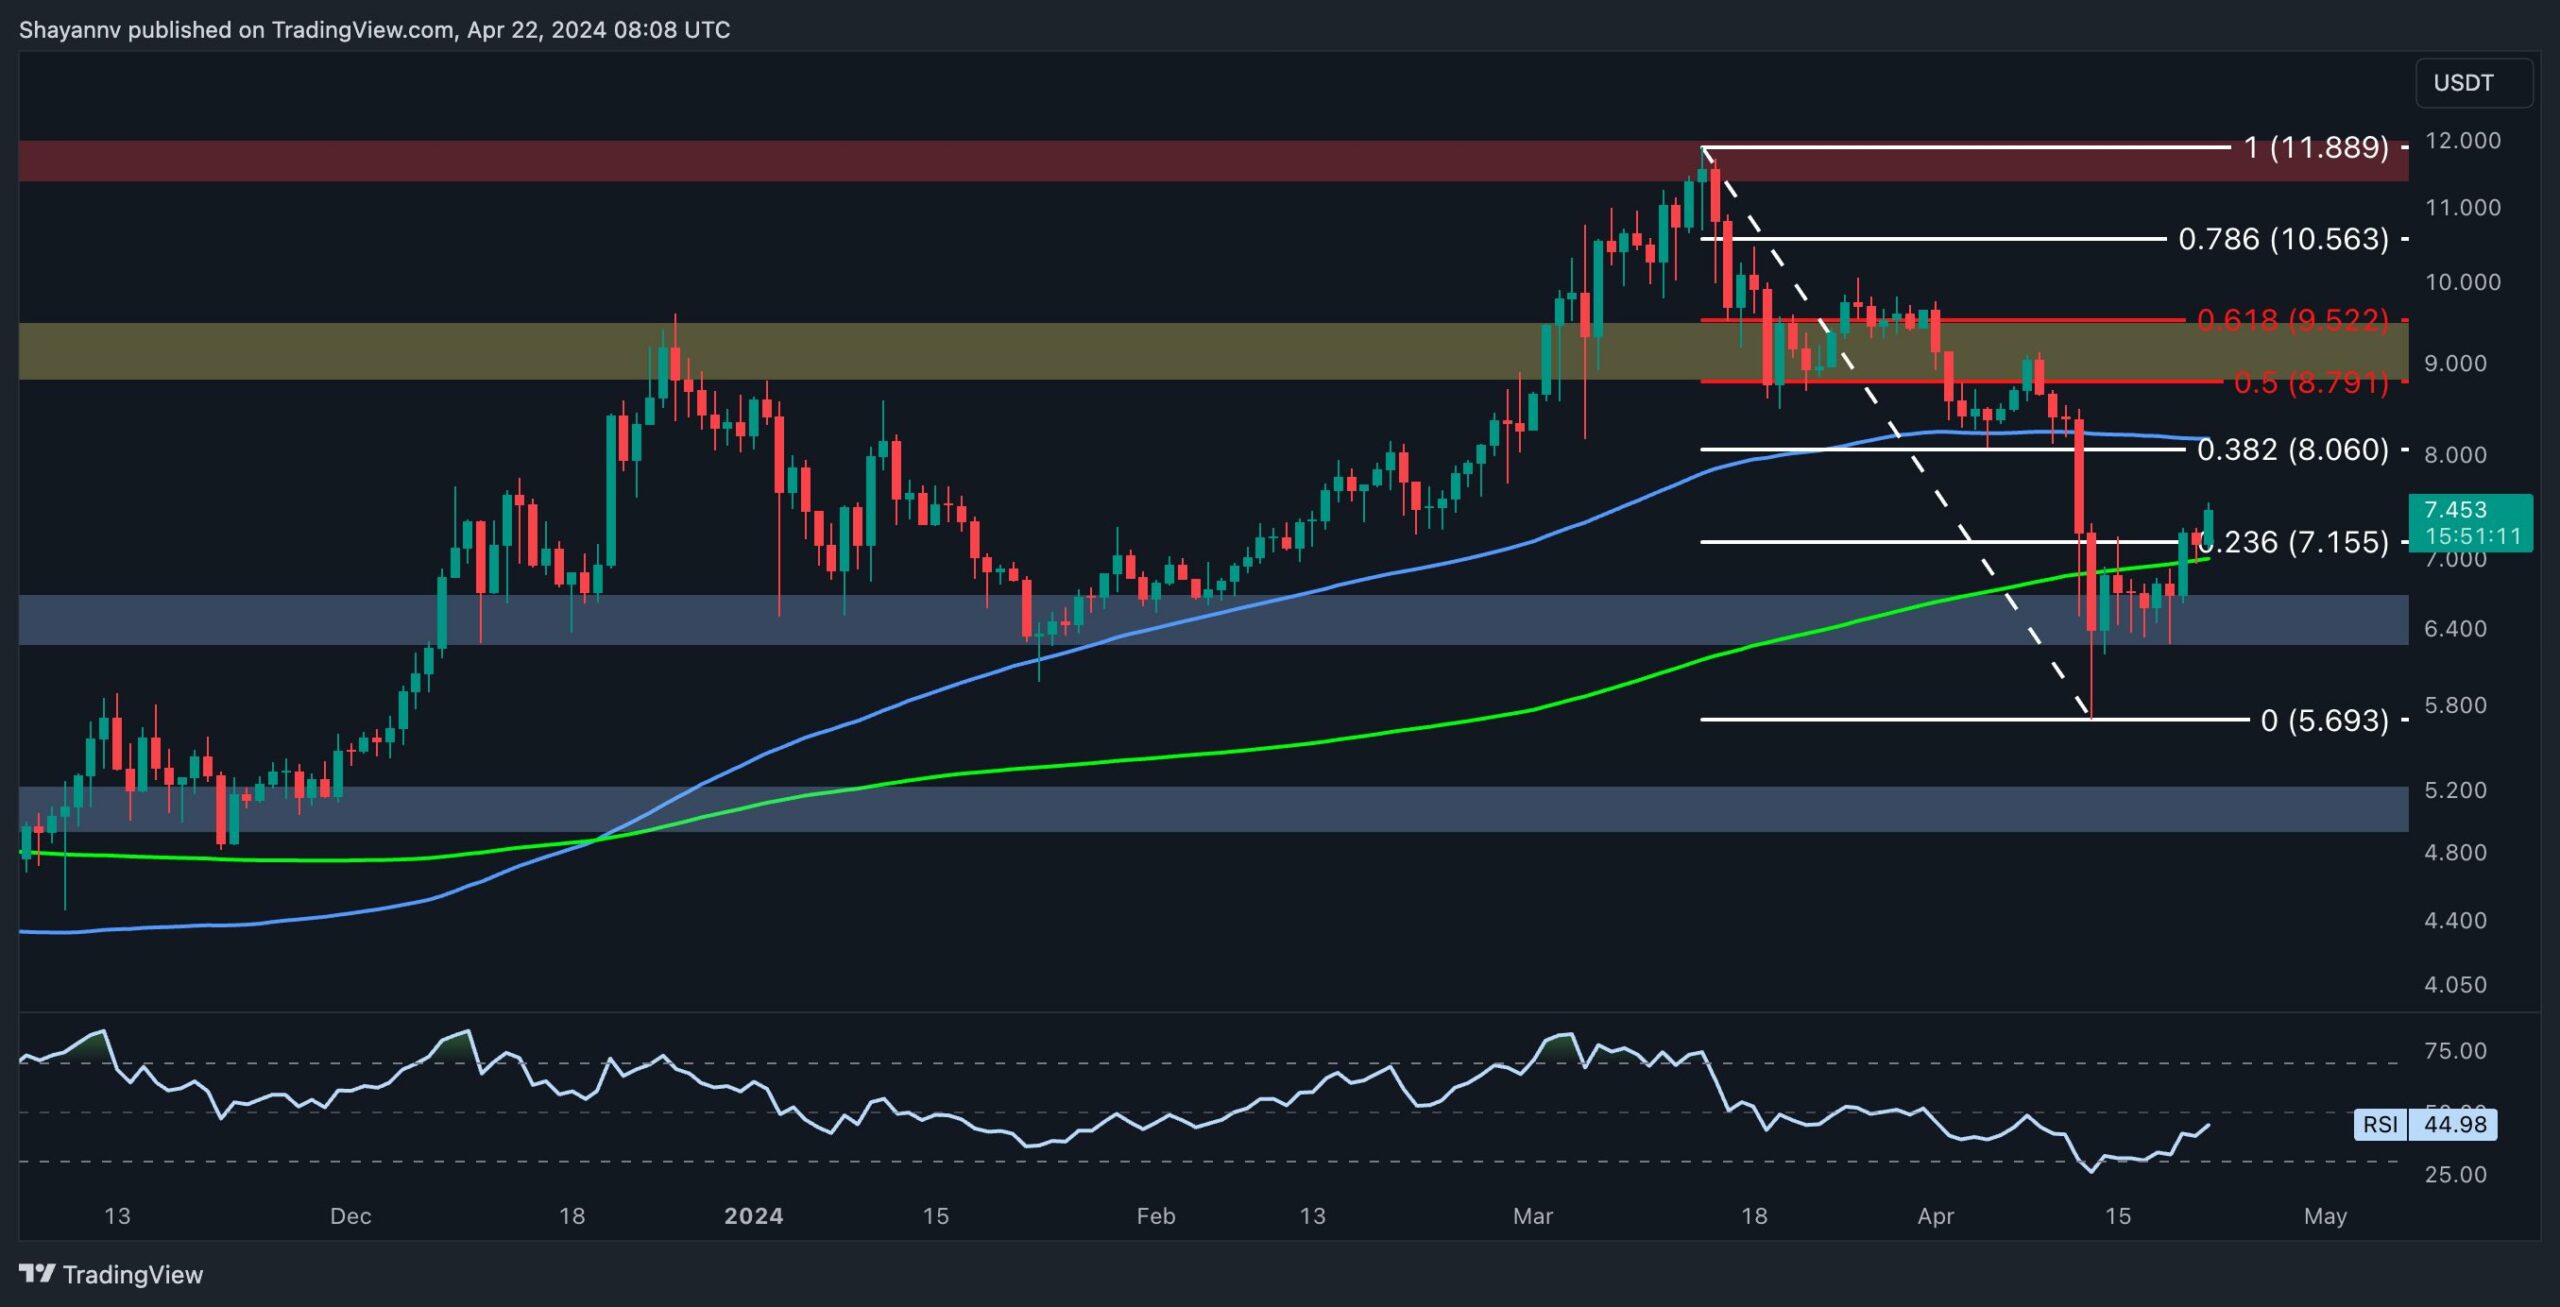
The Daily Chart
As part of our comprehensive Polkadot price analysis, we examined the notable recent changes in the market behavior. A closer look at the daily chart reveals that after consolidation around the significant support level of $6, buyers gained control, sparking a notable bullish rebound. This resurgence propelled the DOT price to reclaim the previously breached 200-day moving average at $7, signaling a bullish outlook for its long-term trajectory.
However, significant resistance lies ahead, including the 100-day moving average at $8.1 and the 0.5 Fibonacci retracement level ($8.8). These marks, in conjunction with the critical support provided by the 200-day MA, currently serve as key reference points for Polkadot in the short term and can potentially influence market trends in the coming weeks.

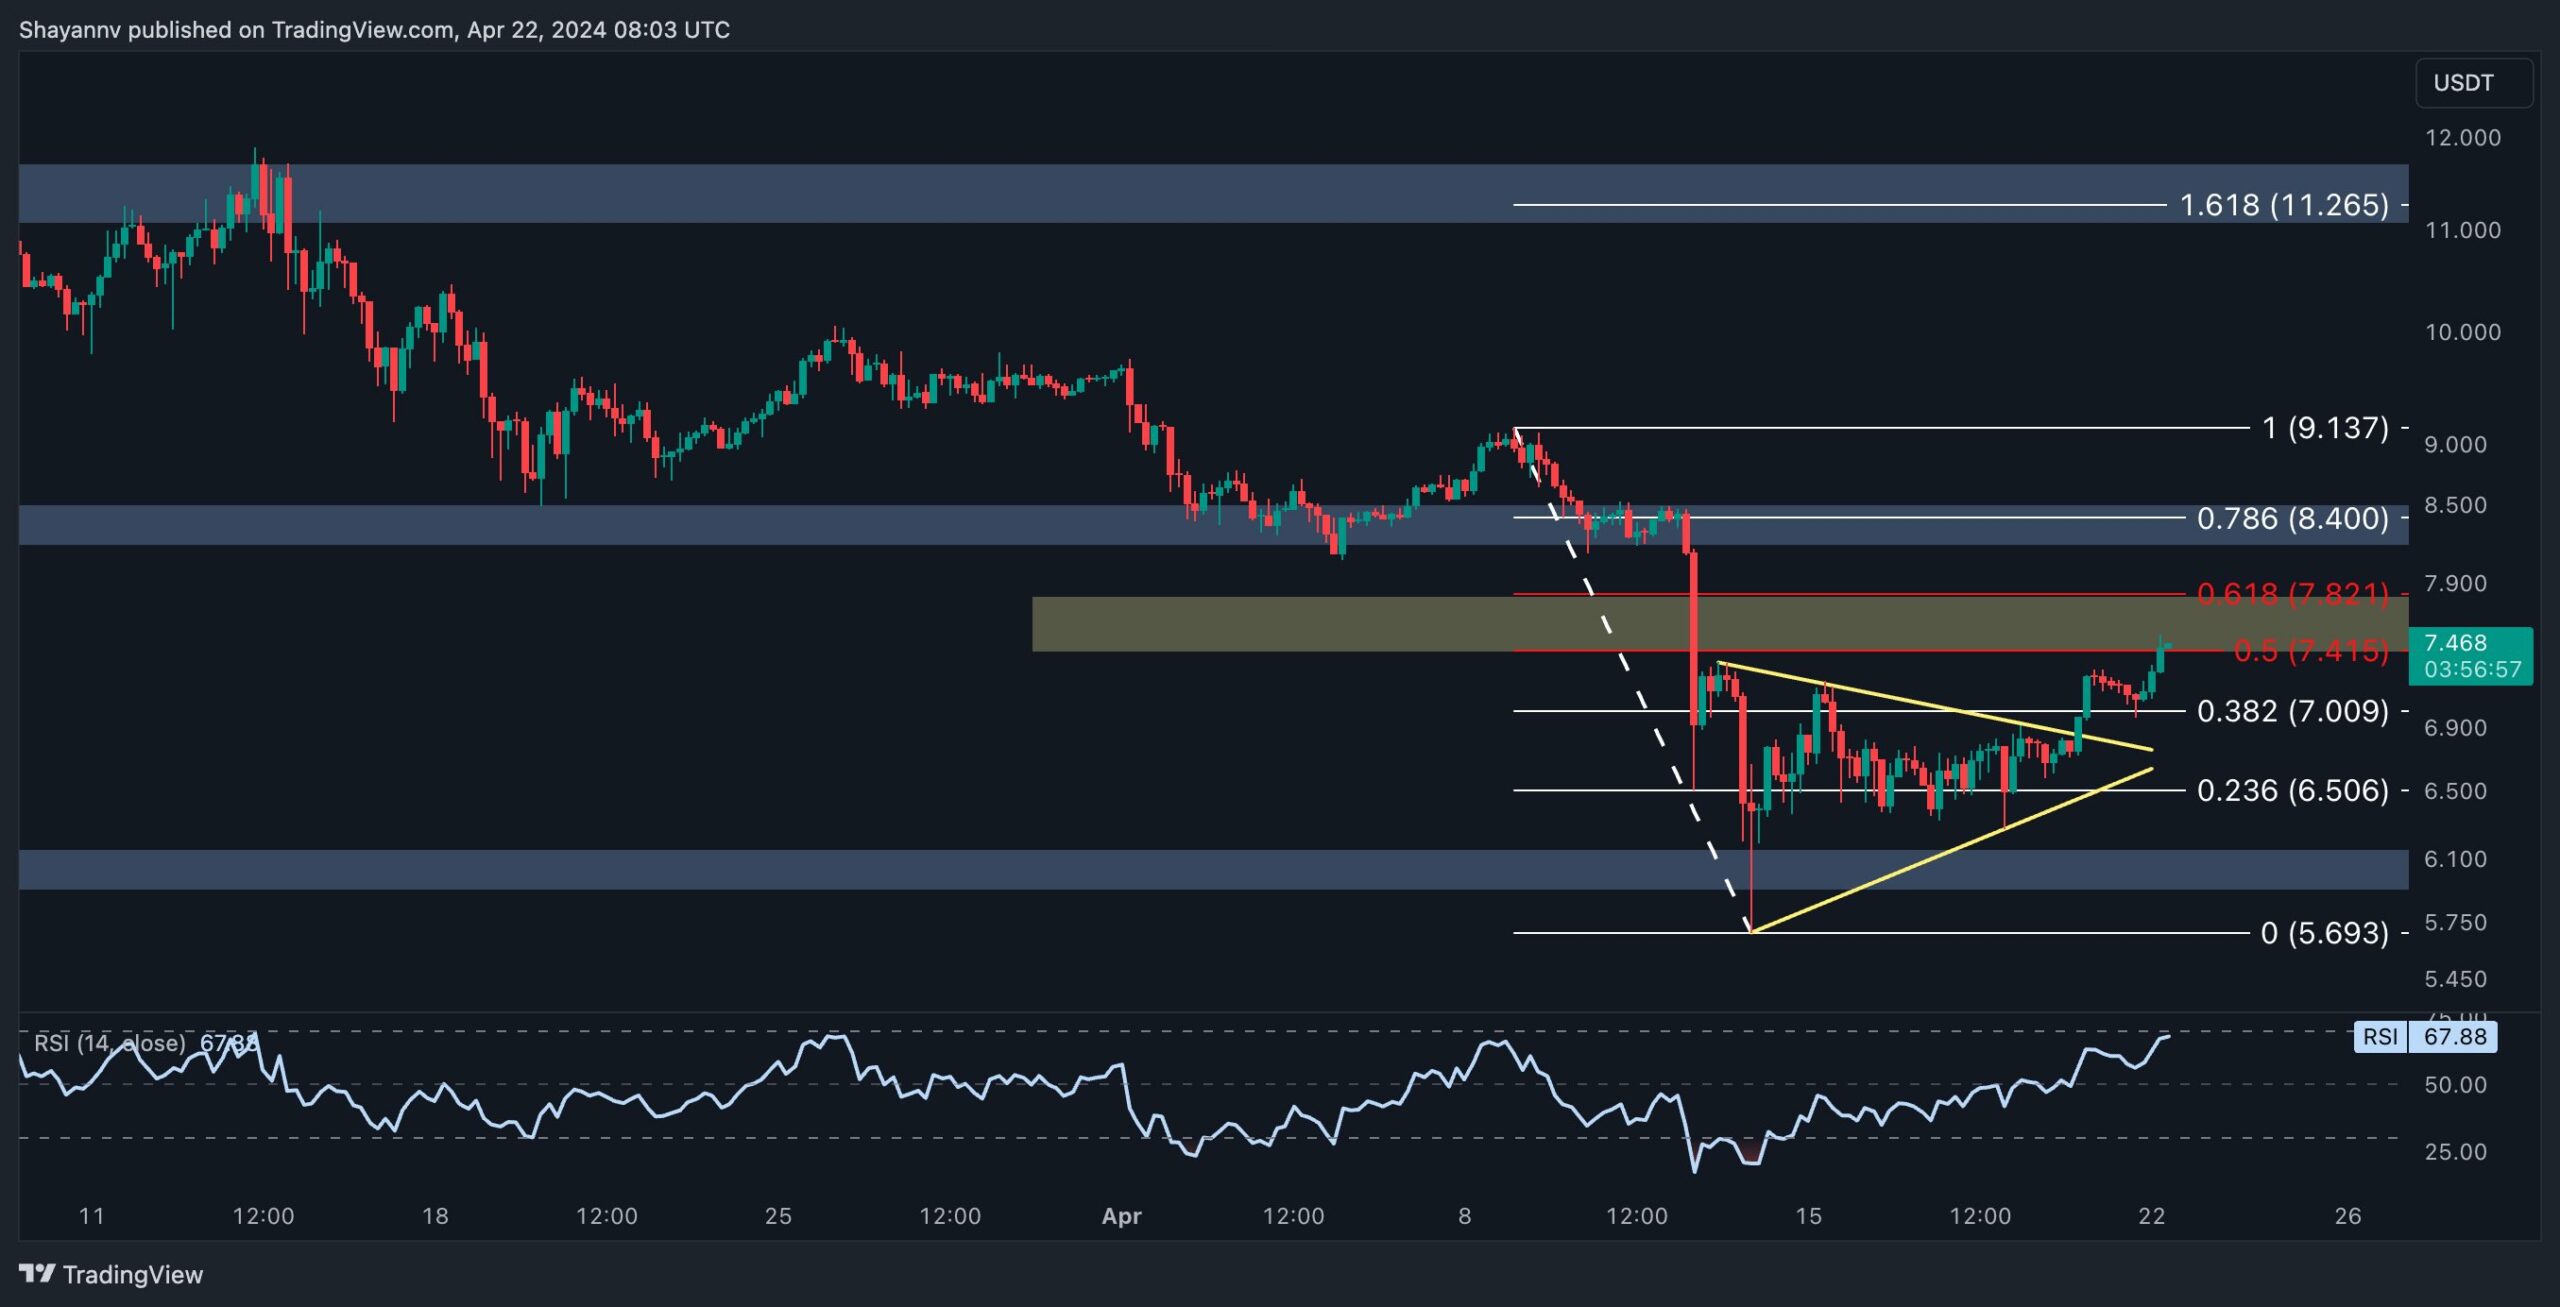
The 4-Hour Chart
A detailed examination of the 4-hour timeframe reveals the formation of a sideways triangle pattern following a period of indecisive consolidation near the crucial $6 mark. Nevertheless, the price successfully broke above the upper boundary of the triangle, indicating the dominance of buyers in this region and sustaining upward momentum.
Currently, the Polkadot price has entered a crucial and decisive range defined by the 0.5 ($7.4) and 0.618 ($7.8) Fibonacci levels, where a significant amount of supply may be present.
Therefore, what happens near this critical juncture is significant, as it could determine DOT’s future direction. A break above this crucial region would likely lead to the continuation of the current uptrend toward the critical resistance level at $8.8.
Sentiment Analysis
By Shayan
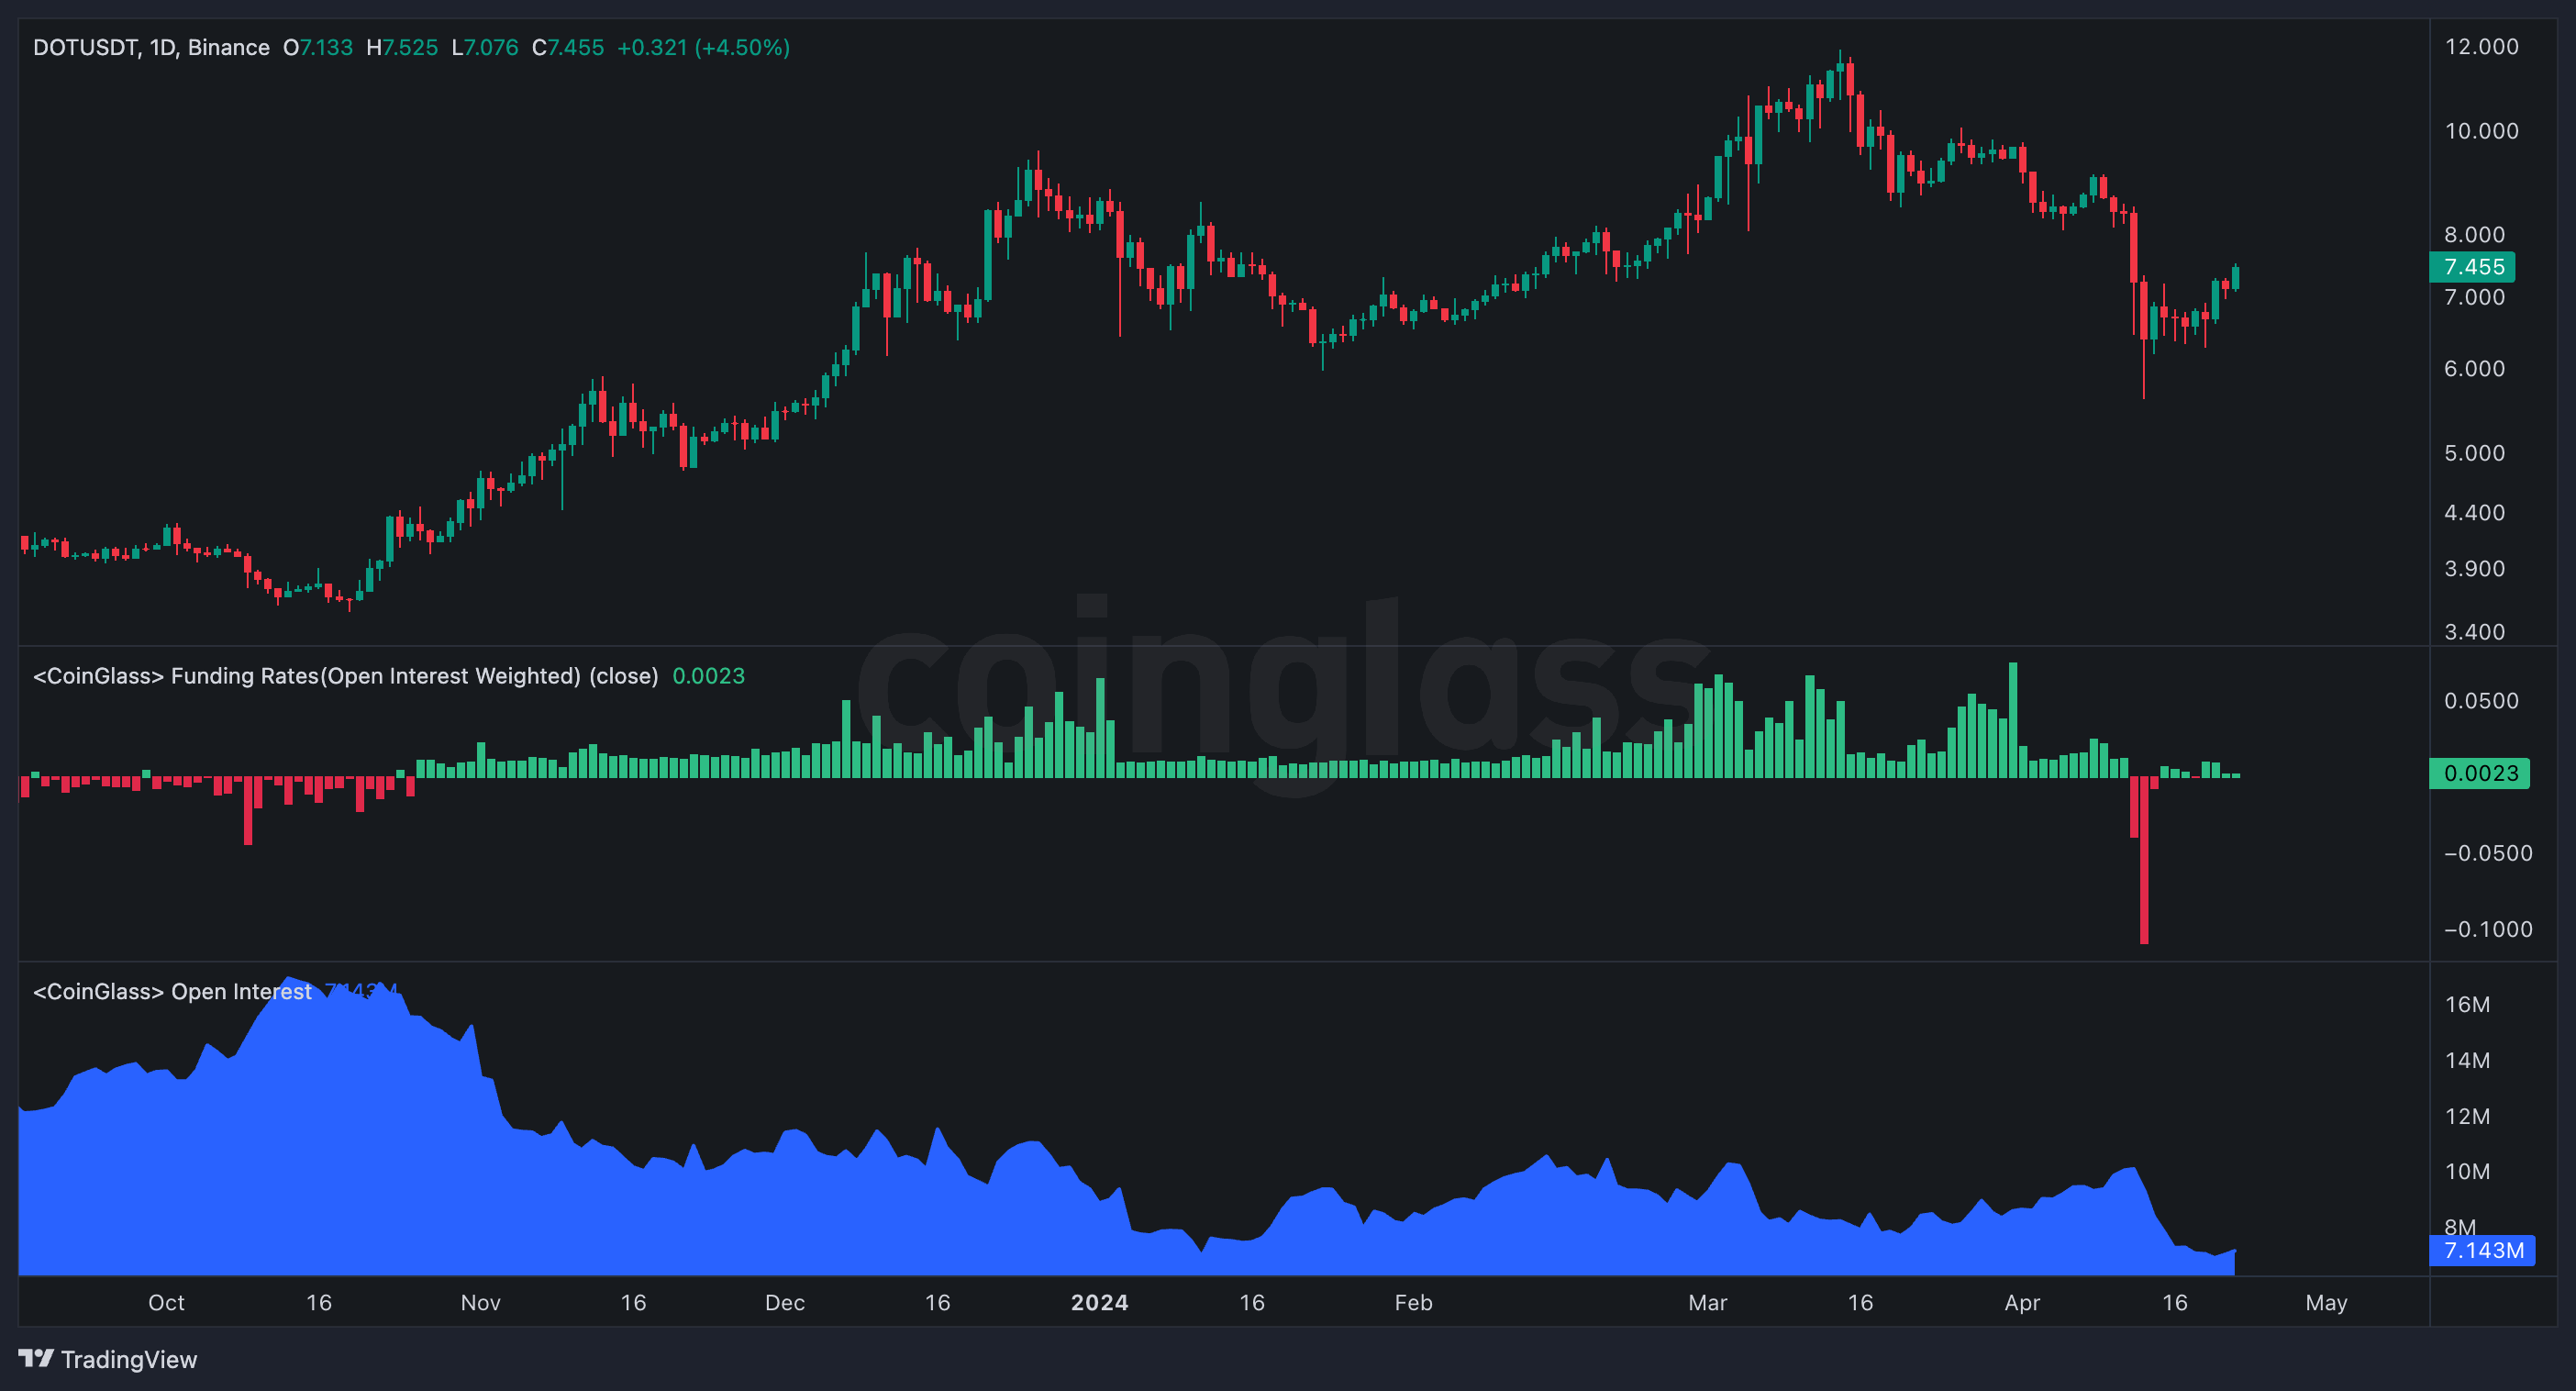
The perpetual futures market plays a pivotal role in shaping cryptocurrency prices, with the establishment of long or short positions often resulting in increased market volatility and rapid price fluctuations. Therefore, analyzing its sentiment and the level of aggressiveness in these positions can provide valuable insights for traders and investors alike.
The accompanying chart visually represents the Funding Rates and Open Interest metrics alongside Polkadot’s price movements. It is evident from the chart that following a significant decline in DOT’s value; there has been a corresponding decrease in both metrics.
This suggests that not only has the futures market cooled down, with a substantial number of positions being liquidated, but it has also shifted to a neutral stance, as indicated by the near-zero values in the funding rate metric.
This confluence of factors indicates that the market is poised for renewed activity, with the potential for re-establishing long and short positions. Consequently, Polkadot is anticipated to experience heightened volatility in the mid-term, potentially leading to significant price movements.
This post has been powered by Polkadot
LIMITED OFFER 2024 for CryptoPotato readers at Bybit: Use this link to register and open a $500 BTC-USDT position on Bybit Exchange for free!


Bitcoin’s recent market correction that dragged the world’s largest cryptocurrency near the low of $56,500 turned out to be a good opportunity for high-profile investors.
Data shared by CryptoQuant CEO Ki Young Ju revealed that whales have accumulated a whopping 47,000 BTC – worth more than $2.8 billion in current price – over the past 24 hours alone. This shopping spree signals the beginning of “a new era” for the primary cryptocurrency, according to the exec.
Bitcoin whales increasing their holdings may indicate growing confidence in the cryptocurrency’s future trajectory among institutional investors or high-net-worth entities.
The CryptoQuant founder also revealed that the whale wallets in question are mostly custodial ones, including ETFs, but clarified that the recent spike is not ETF-related.
#Bitcoin whales accumulated 47K $BTC in the past 24 hours. We’re entering a new era. pic.twitter.com/SXgzToN8GU
— Ki Young Ju (@ki_young_ju) May 3, 2024
There appears to be a change of heart as just a week ago, long-term bitcoin whales saw a substantial increase in their unrealized profits, especially as the price remained above $60,000.
Although their profits had risen significantly, these whales hadn’t yet cashed out, indicating they were holding onto their positions.
This aligned with a notable increase in bitcoin exchange inflows, mostly attributed to whales, which subsequently led to a market-wide slump.
Following the latest whale accumulation, however, bitcoin climbed by over 6% to surge above $62,000 on Friday, staging a modest relief rally.
The whale known as “Mr. 100” bought over 4,100 BTC worth over $242 million at around $58,000 on May 2nd, marking the wallet’s first bitcoin purchase since April 19, just before the 2024 halving.
LIMITED OFFER 2024 for CryptoPotato readers at Bybit: Use this link to register and open a $500 BTC-USDT position on Bybit Exchange for free!
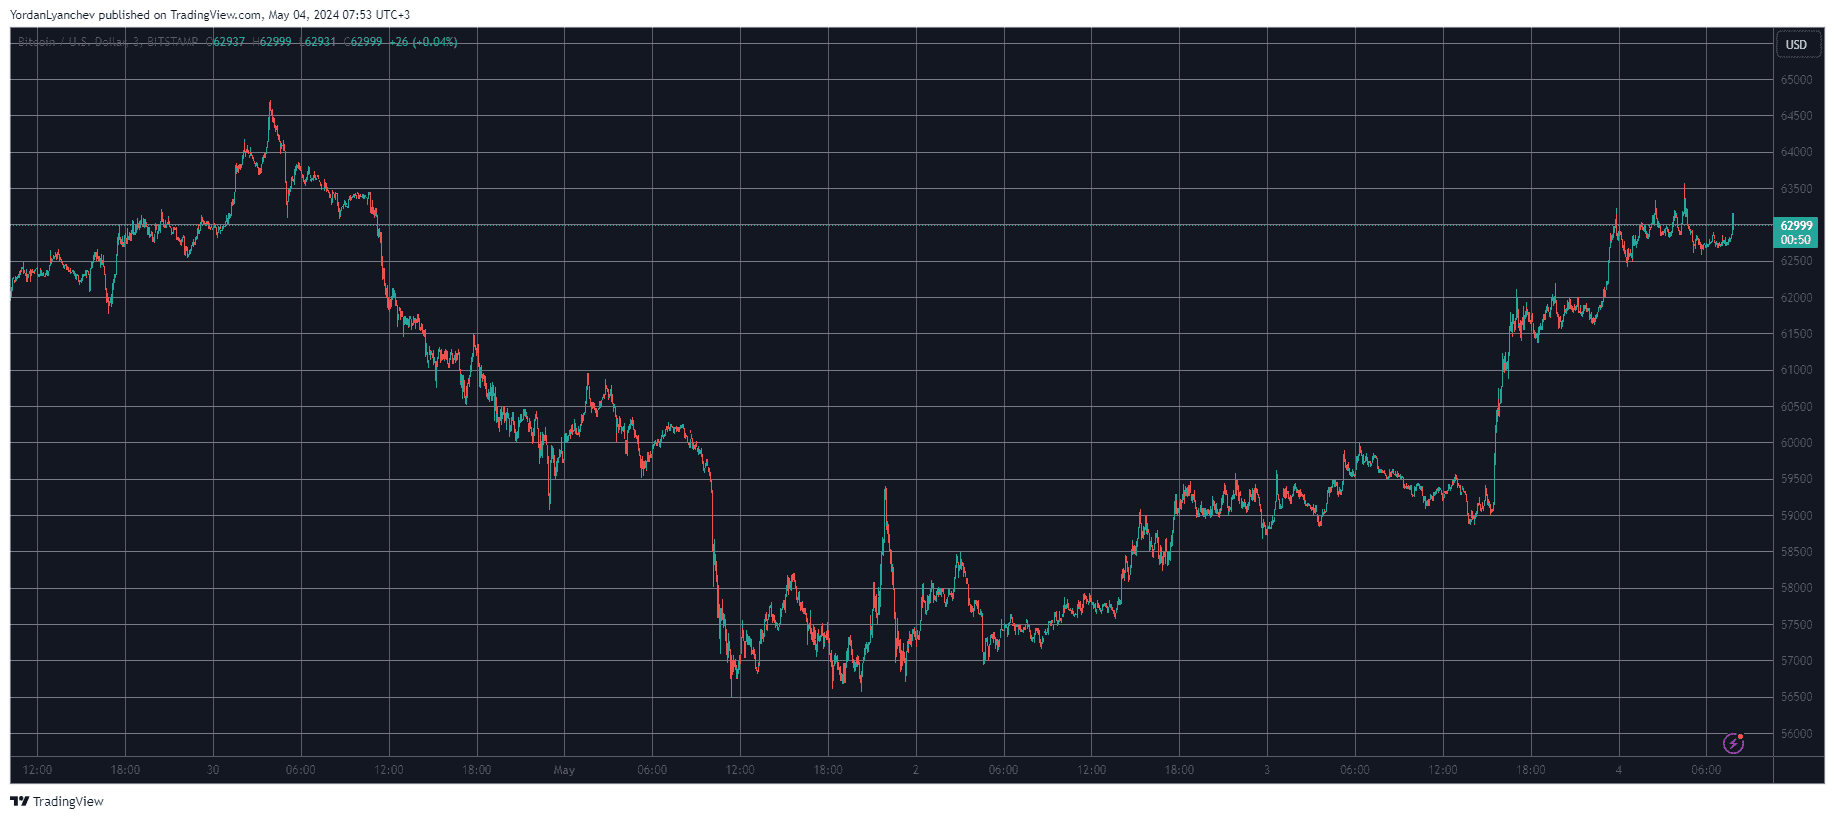
Bitcoin’s recovery tour continues as the cryptocurrency jumped from under $59,000 yesterday to a multi-day peak of over $63,000 earlier today.
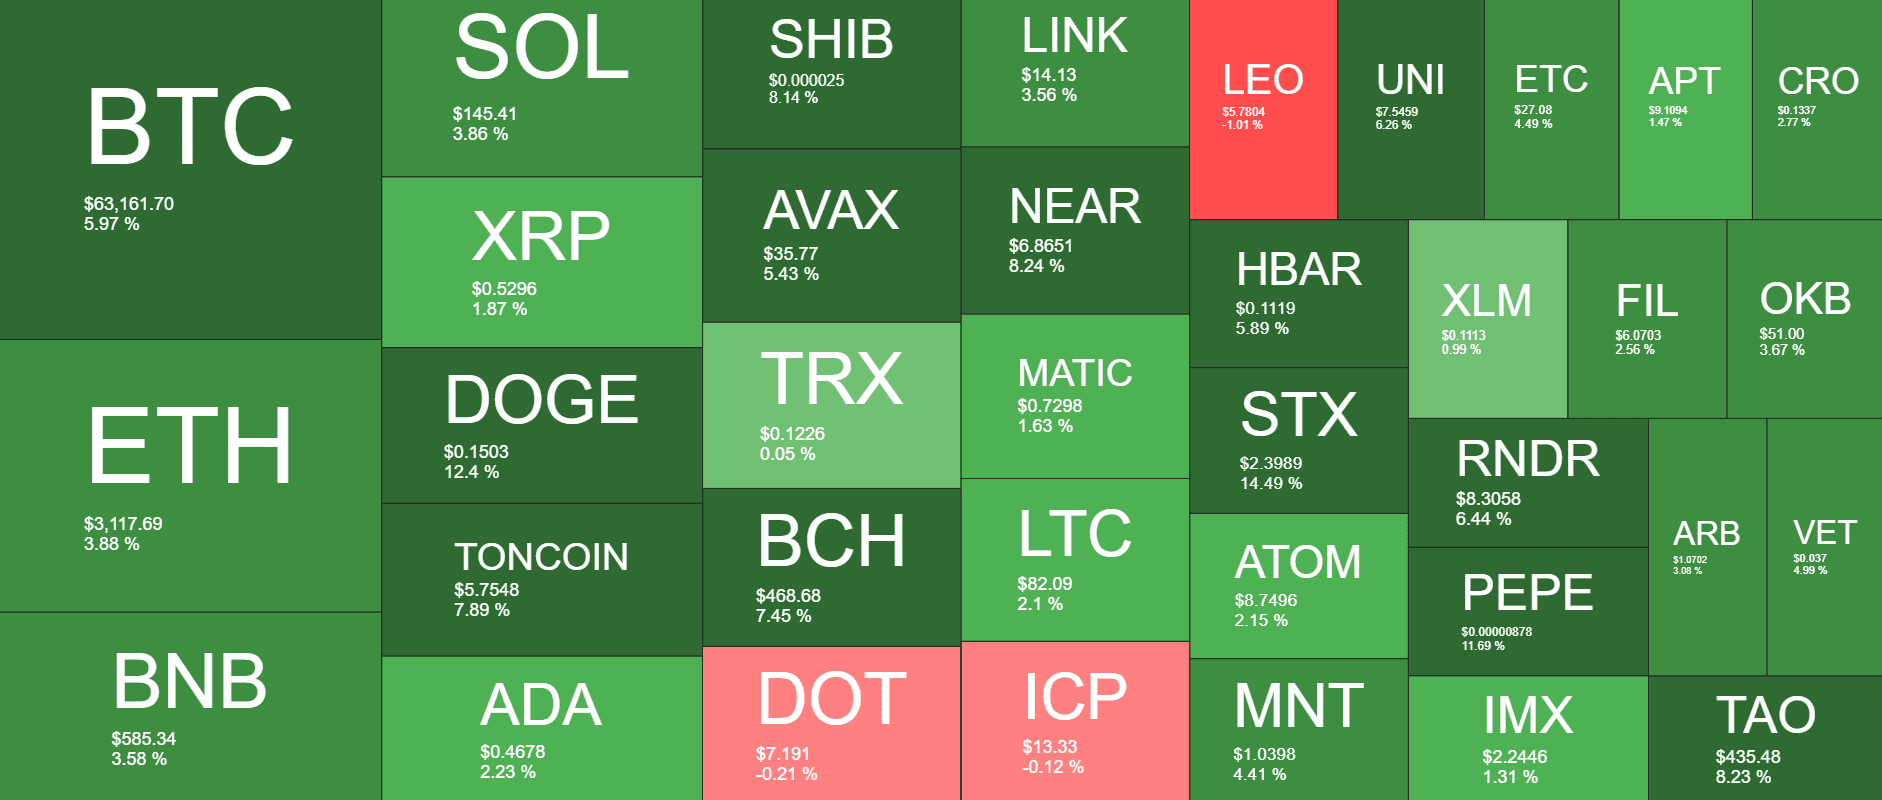
Most altcoins have followed suit with impressive gains once again, including the ever-volatile meme coin sector.
BTC Goes After $63K
Bitcoin had a highly adverse trading week as its price dumped hard on a few occasions. It all started positively on Monday morning when BTC pumped to almost $65,000, but the bears took control of the market immediately and pushed it south to $62,000.
The declines were far from over as the asset further slumped to and below $60,000. The correction culminated in a two-month low of $56,500 charted on Wednesday, ahead of the latest US FOMC meeting.
Once that was completed and the Fed said it will not raise the interest rates soon, BTC reacted with a $2,000 pump and dump and returned to its starting position. It started to recover more ground in the following hours and neared $60,000 yesterday, as reported.
It was stopped there at first, but managed to break through that psychological resistance later that day. The bulls kept the pressure on and pushed BTC to a multi-day peak of $63,500. Despite losing some ground since then, bitcoin currently sits at around $63,000.
Its 6% daily increase means that its market cap has risen to $1.240 trillion, while its dominance over the alts stands at 50.5%.
DOGE, SHIB, PEPE on the Rise
The top gainers from the largest altcoins come from the volatile meme coin sector. Dogecoin, the first and largest of the cohort, is up by over 12% and now trades at $0.15. PEPE has followed suit with an 11.7% jump, while SHIB has gained 8% and is above $0.000025. The other highly impressive gainer is STX, which has soared by 14% to $2.4.
Ethereum and Binance Coin have increased by similar percentages of around 3.5%. Consequently, ETH has soared past $3,100, while BNB is at $585.
The rest of the larger-cap alts are also in the green, including TON, BC, AVAX, NEAR, and HBAR. The total crypto market cap has recovered more than $200 billion since the low of Wednesday and is up to $2.460 trillion on CG.
LIMITED OFFER 2024 for CryptoPotato readers at Bybit: Use this link to register and open a $500 BTC-USDT position on Bybit Exchange for free!
Disclaimer: Information found on CryptoPotato is those of writers quoted. It does not represent the opinions of CryptoPotato on whether to buy, sell, or hold any investments. You are advised to conduct your own research before making any investment decisions. Use provided information at your own risk. See Disclaimer for more information.
Cryptocurrency charts by TradingView.

CryptoQuant analysts have found that Bitcoin miners have increased their selling activity in the last month amid slow demand growth for BTC.
According to the latest CryptoQuant weekly report, the decrease in BTC demand is evident in low Bitcoin whale demand, fewer purchases from spot exchange-traded funds in the United States, and the Coinbase premium falling below zero.
Miners Increase Selling Activity
Miners have sent a large amount of BTC to spot exchanges, creating an imbalance in the market. Since the halving was completed on April 19, miners’ revenue has decreased significantly following the reduction of block rewards by 50%.
Presently, mining entities are selling their holdings to cover operational costs; however, if the trend continues and miners’ profitability turns negative, the price of BTC may witness more pressure.
Due to the high miner selling activity, BTC supply is outpacing demand. CryptoQuant head of research Julio Moreno revealed yesterday that the total balance of BTC at over-the-counter (OTC) desks started to increase when the crypto asset peaked at $73,000 in mid-March. OTC supply has remained on the rise since then, hitting its highest level since November 2022, but demand has slowed.
Demand for BTC Slows Down
The monthly growth of BTC demand from permanent holders (investors who purchase BTC and never sell) has plummeted 50% from 200,000 BTC in late March to 96,000 BTC at the time of writing. Analysts noted that accelerating demand growth is needed for prices to bottom and eventually spike.
Demand growth from large investors and Bitcoin whales has also fallen from a peak of 12% in late March to 6% currently. Spot Bitcoin ETFs in the U.S. have recently recorded significant outflows and little to no inflows, falling significantly from a mid-March peak of $1 billion.
Additionally, the funding rate in the perpetual futures market has fallen to its lowest level this year, indicating that selling orders are outpacing buy orders, and traders are not willing to pay as much as before to open long positions. Traders are also opening more short positions in anticipation of further price declines.
With BTC hovering around two-month low levels of $60,000, the asset may target $55,000 to $57,000 in the short term. This range is 10% below traders’ current cost basis of $63,000, a level which acts as a support during bull markets.
LIMITED OFFER 2024 for CryptoPotato readers at Bybit: Use this link to register and open a $500 BTC-USDT position on Bybit Exchange for free!

 Forex2 years ago
Forex Today: the dollar is gaining strength amid gloomy sentiment at the start of the Fed’s week
- Forex2 years ago
How is the Australian dollar doing today?
- Forex1 year ago
Unbiased review of Pocket Option broker
- Forex2 years ago
Dollar to pound sterling exchange rate today: Pound plummeted to its lowest since 1985
- Cryptocurrency2 years ago
What happened in the crypto market – current events today
- World2 years ago
Why are modern video games an art form?
- Stock Markets2 years ago
Morgan Stanley: bear market rally to continue
- Economy2 years ago
Crude oil tankers double in price due to EU anti-Russian sanctions