Cryptocurrency
Polkadot Price Analysis: DOT Tumbles 7% Weekly but the Bulls May Be Staging a Comeback

Polkadot’s price has been dropping rapidly over the last couple of months and is yet to show any sign of slowing down. However, the cryptocurrency might soon begin a bullish rebound.
Technical Analysis
By TradingRage
The Daily Chart
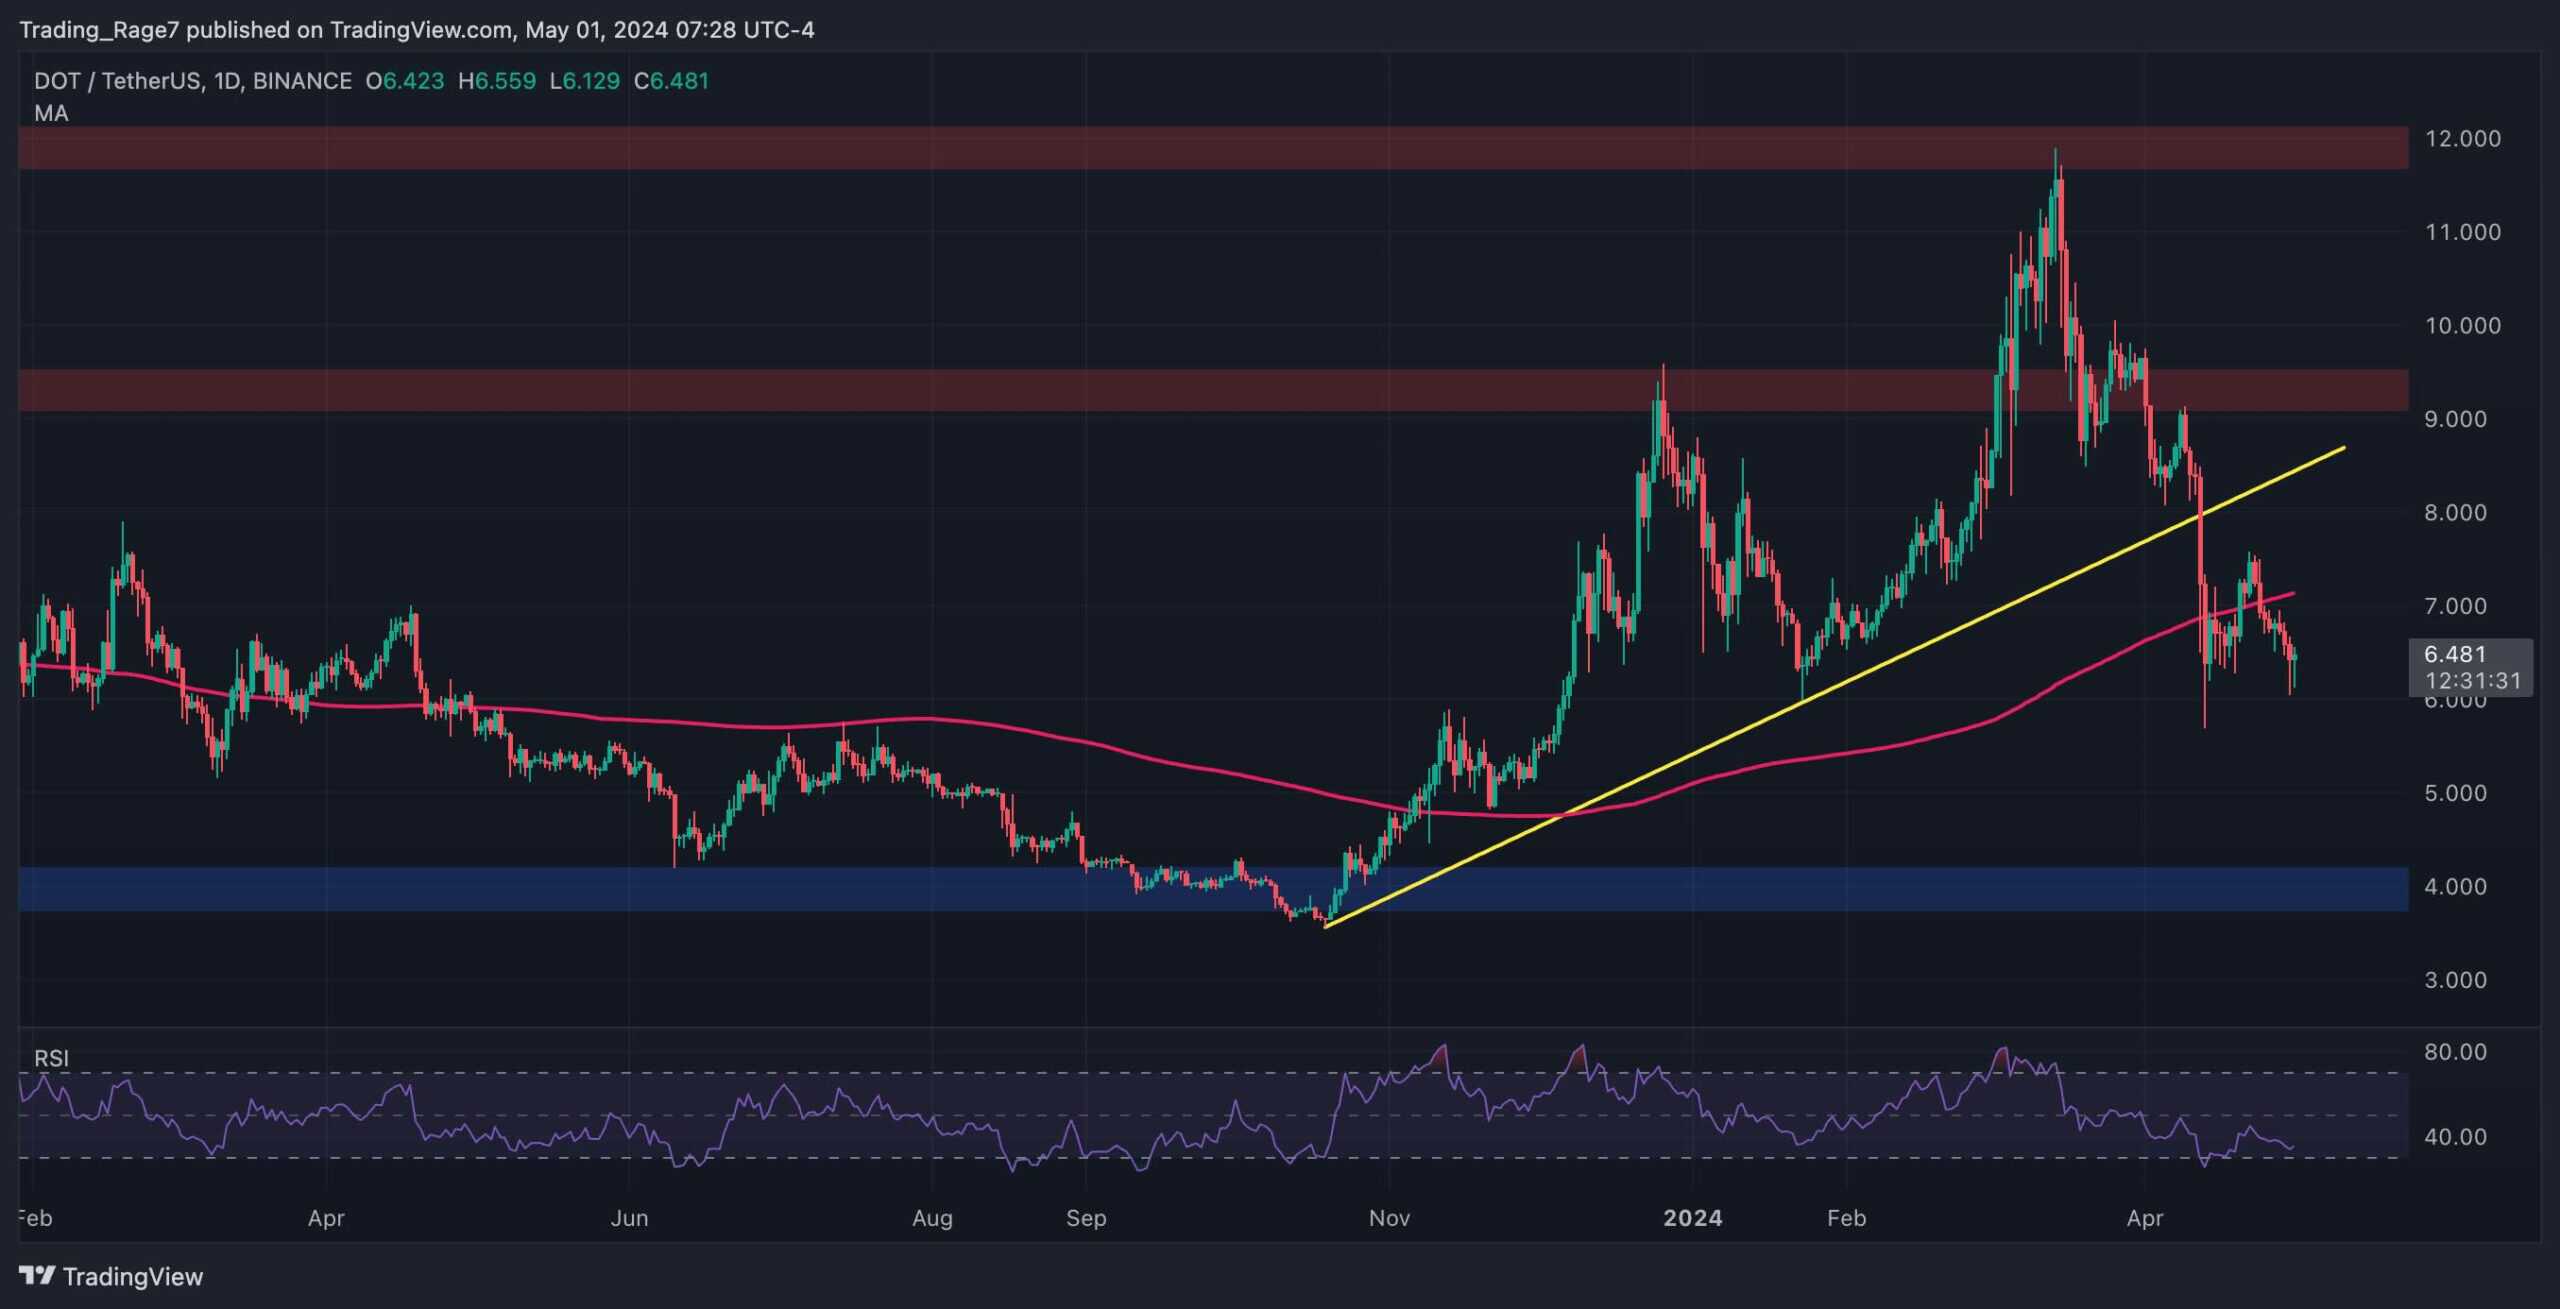
On the daily chart, the price has been on an aggressive decline since a rejection from the $12 resistance level. The market has also broken below the bullish trendline that has been formed since October 2023.
The 200-day moving average, located around the $7 mark has also been broken down, with the price seemingly targeting the $4 support zone.
With the Relative Strength Index also showing values below 50%, the momentum is in favor of a further bearish continuation.
The 4-Hour Chart
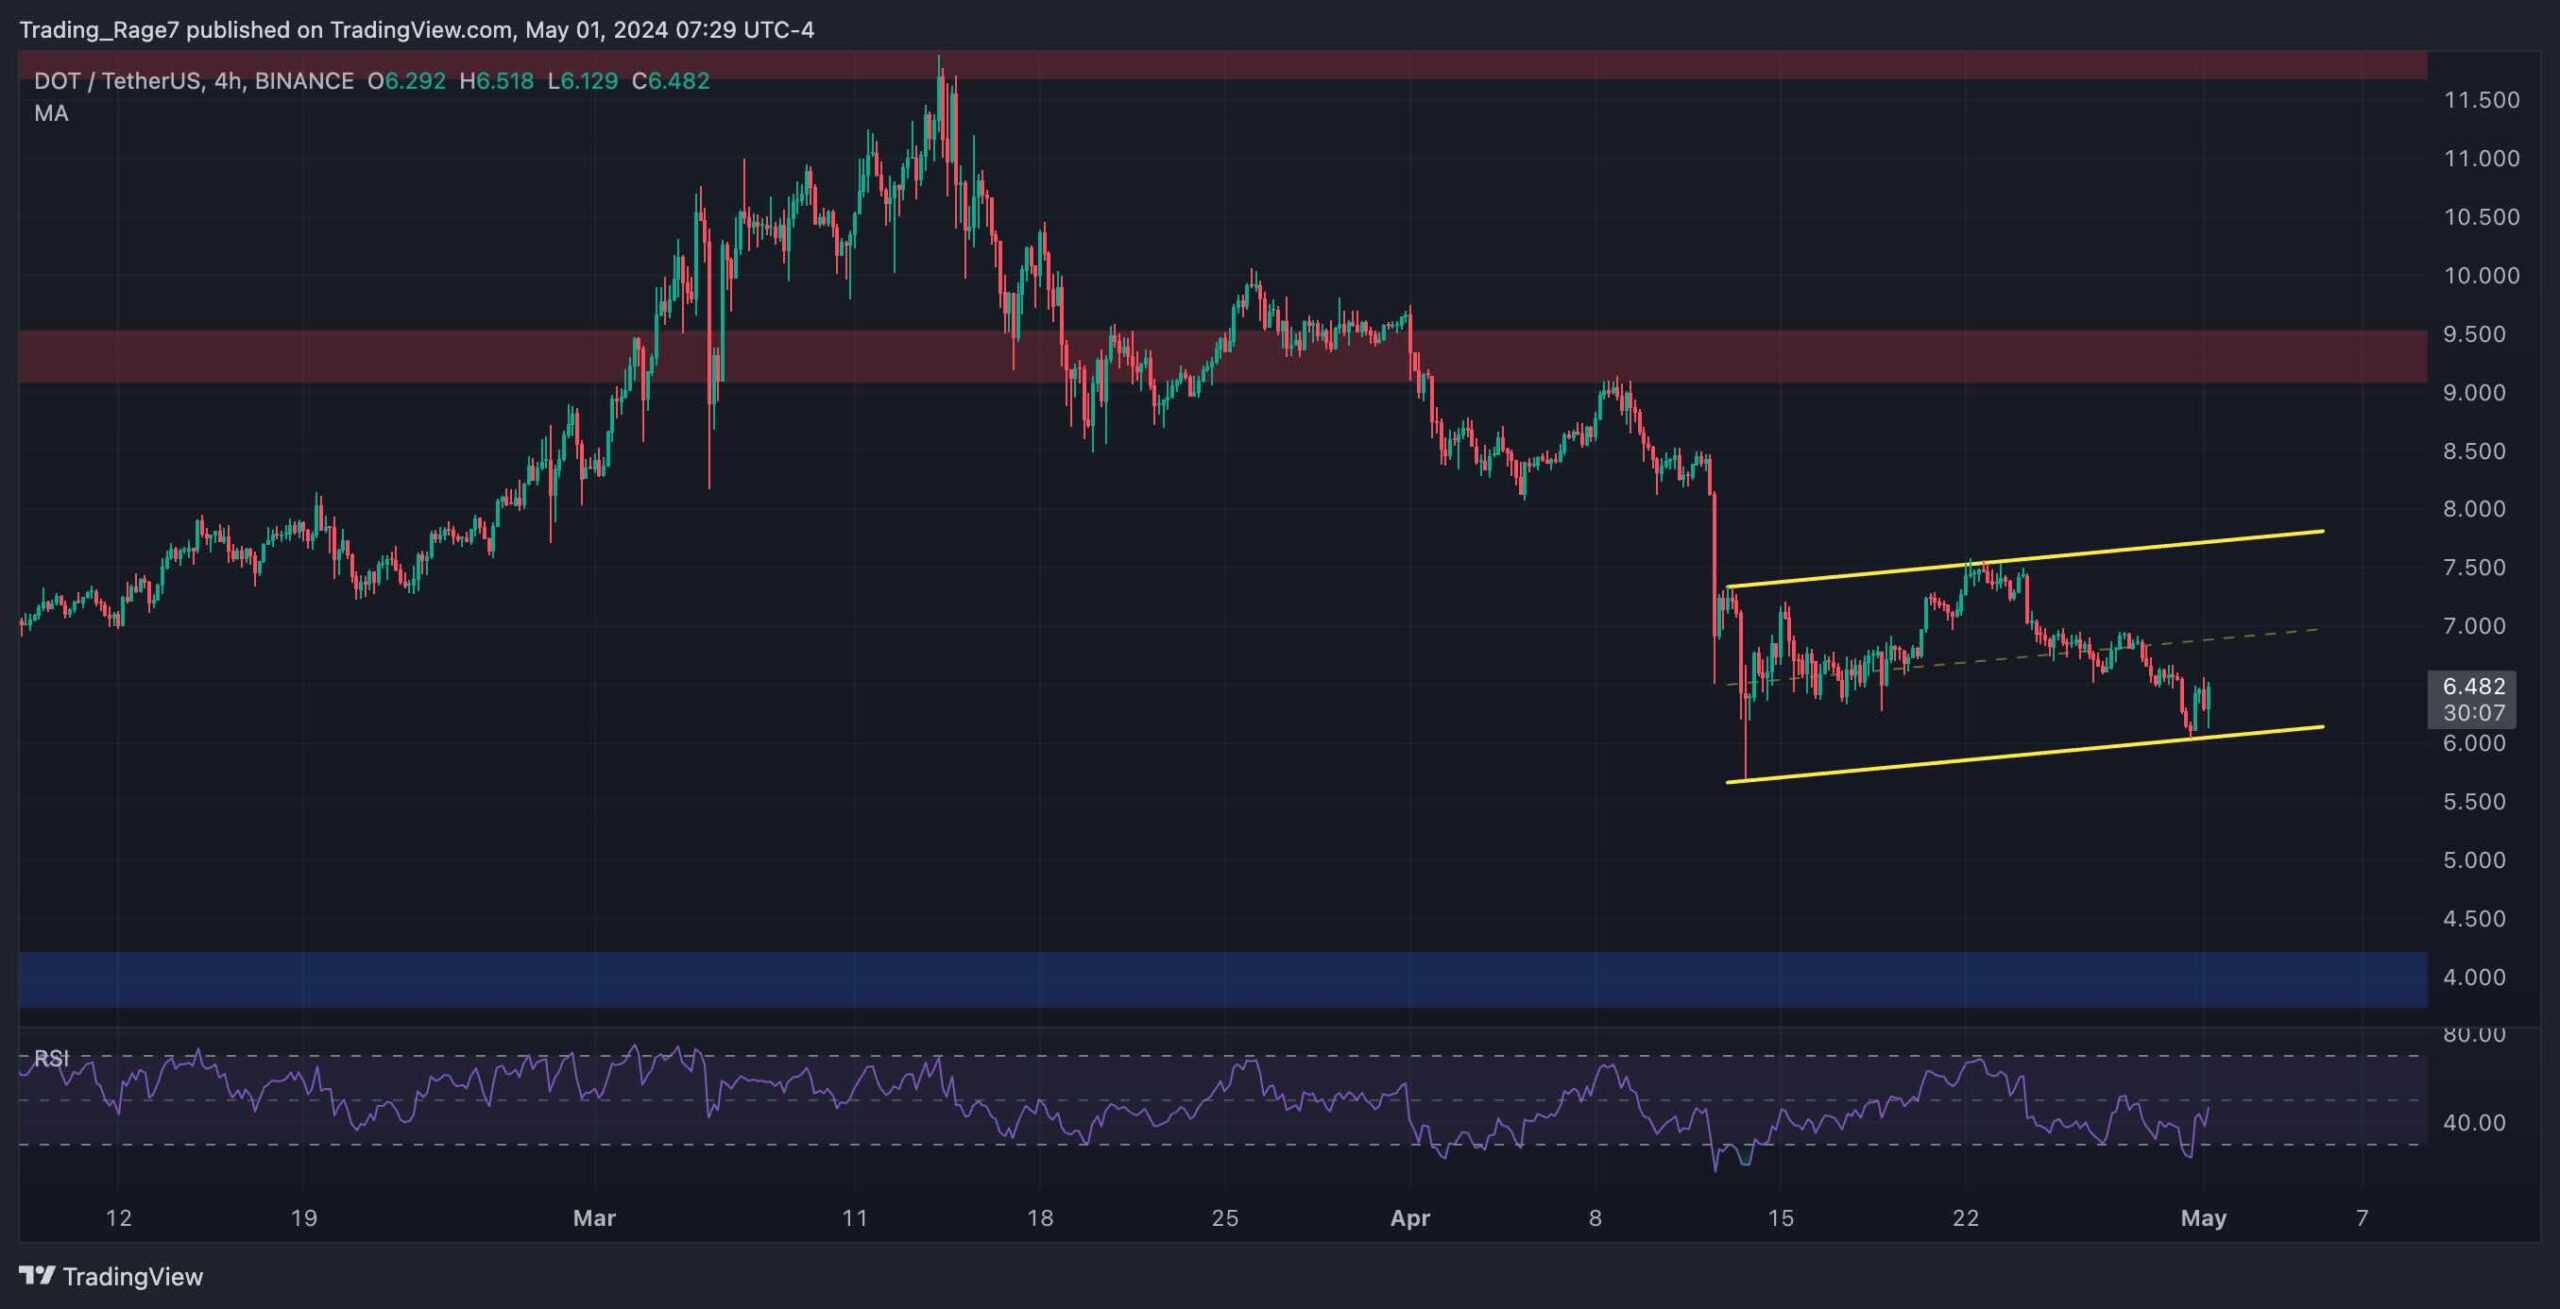
The 4-hour chart paints a much more clear picture of the recent price action. The market is seemingly forming an ascending channel pattern at the moment.
These formations are normally considered bearish continuation patterns inside a larger downtrend.
Therefore, if the channel breaks down, the market would be more likely to crash toward the $4 support zone. On the other hand, a breakout above the channel can completely overturn the scenario, and the market could begin a bullish trend.
Therefore, the short-term fate of the market relies heavily on whether the channel is broken to the upside or downside.
Sentiment Analysis
By TradingRage
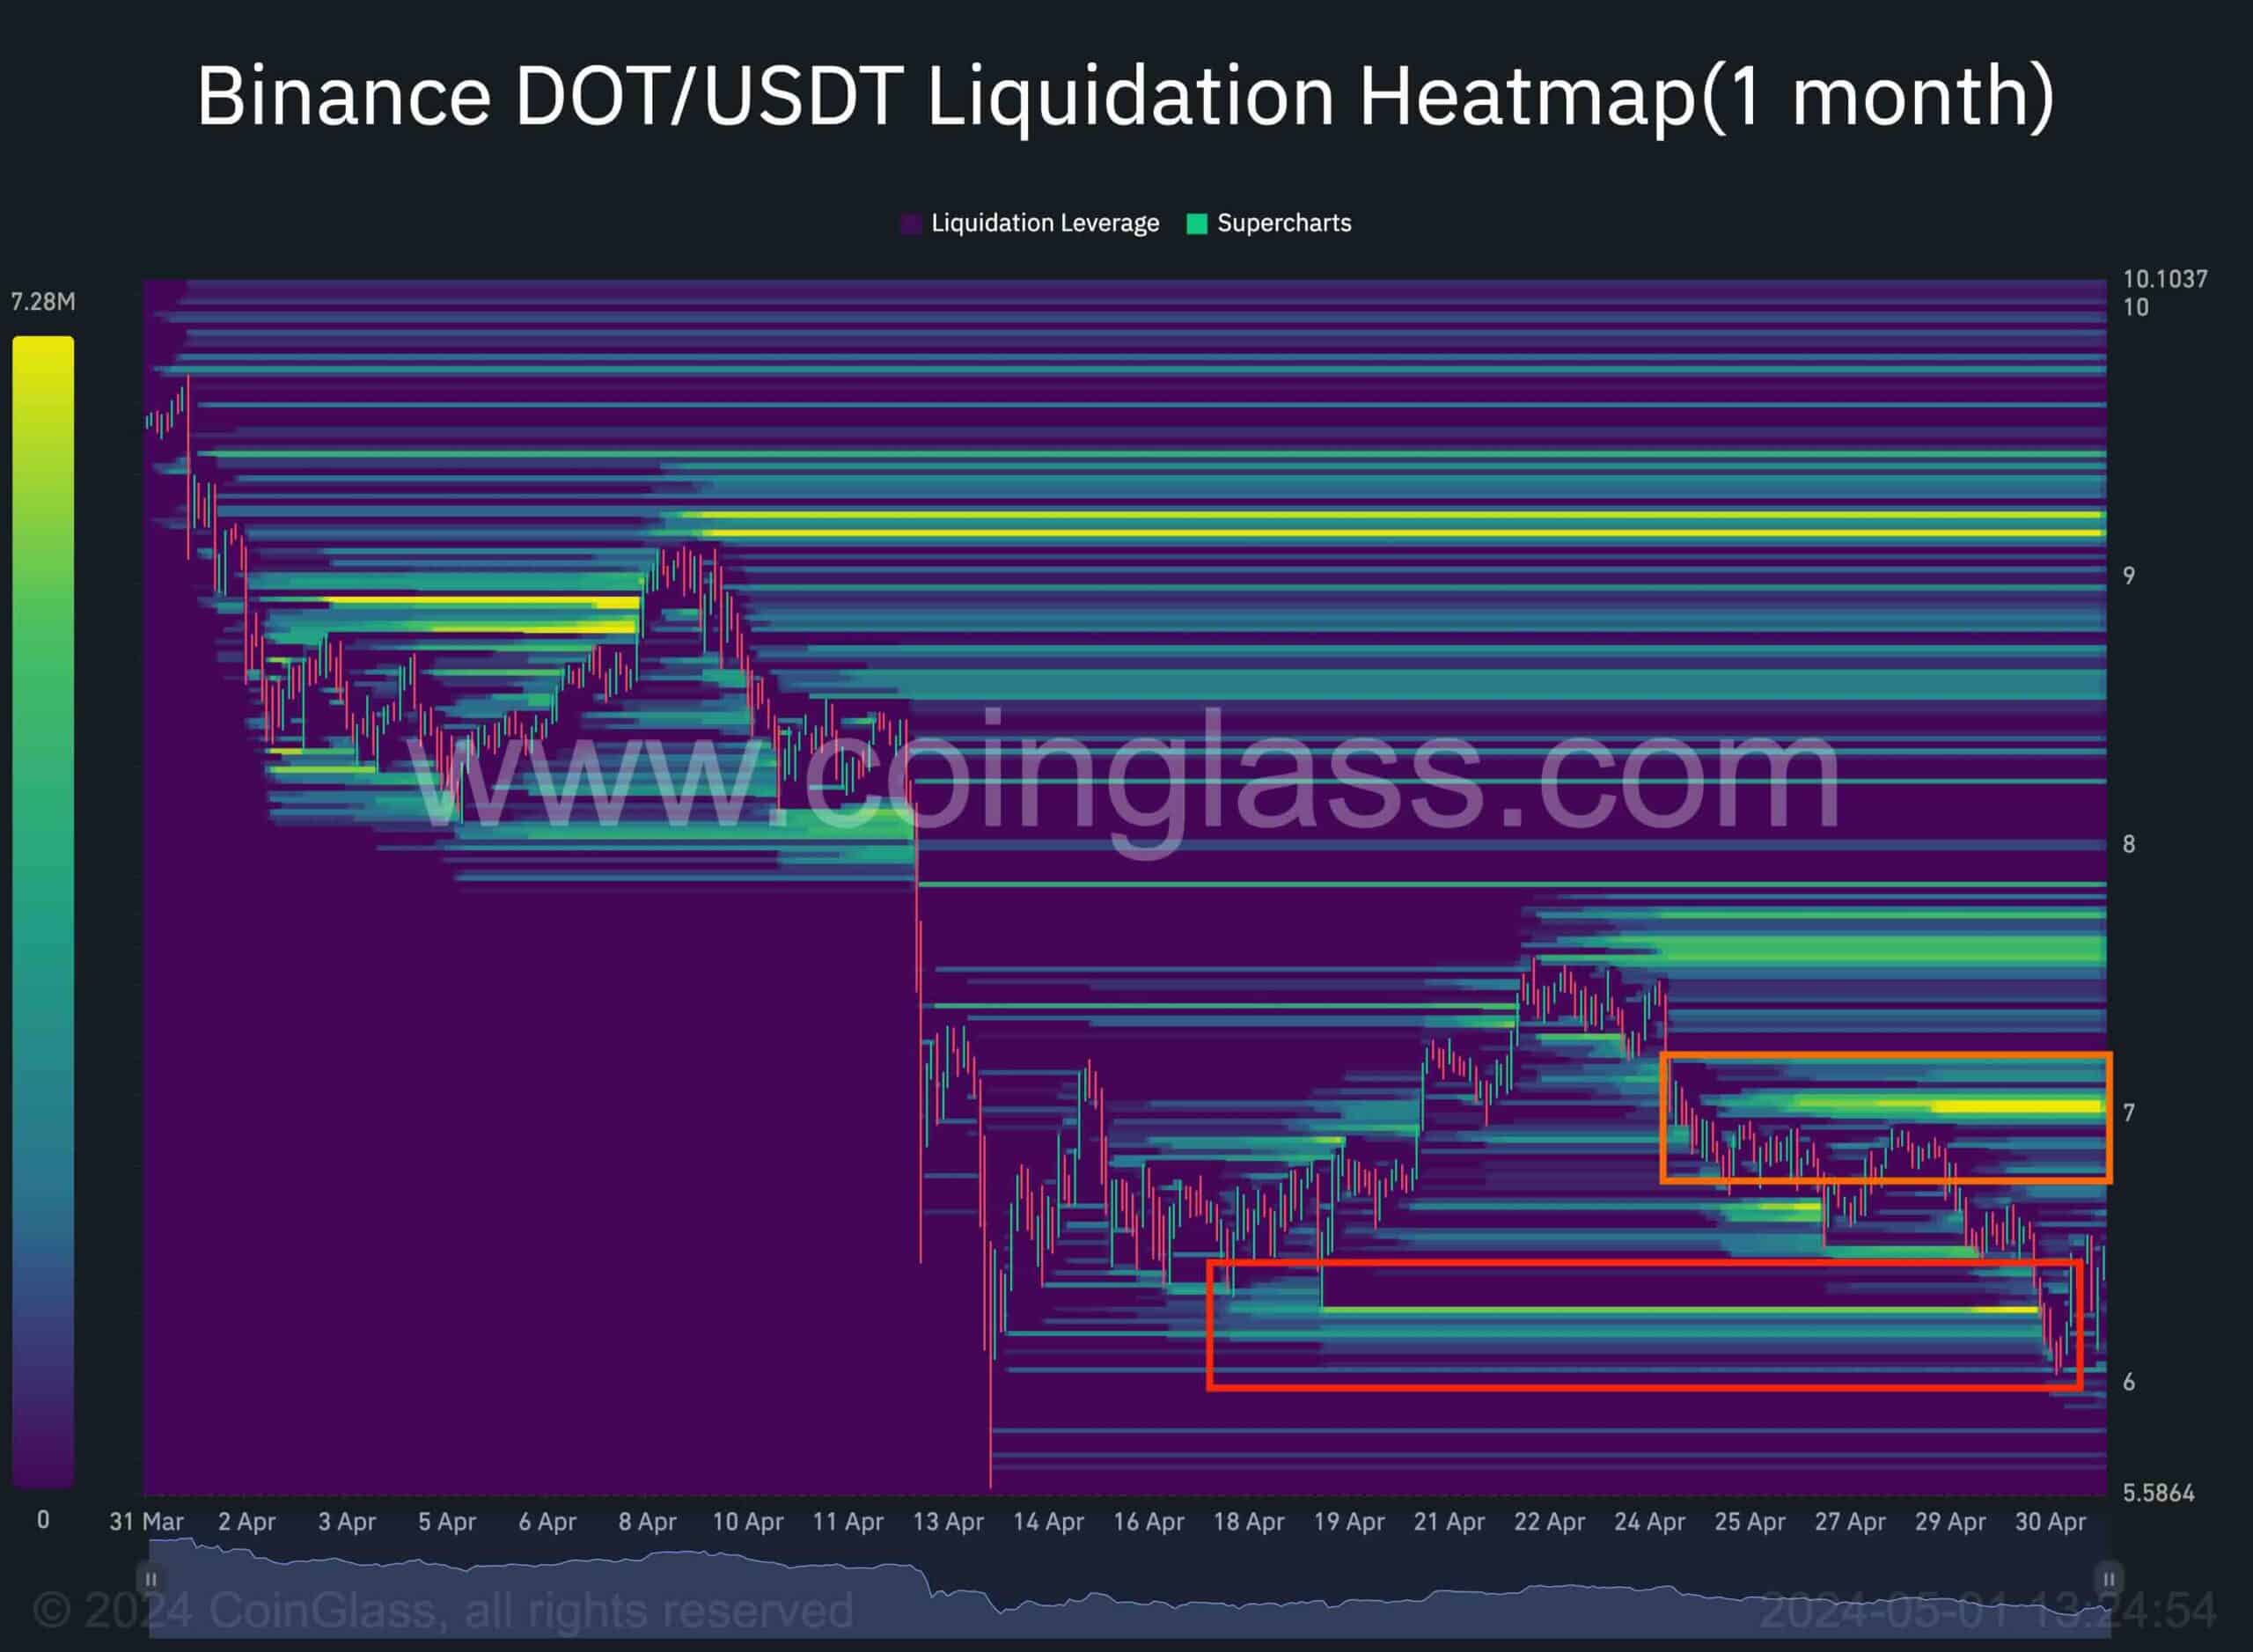
Polkadot Liquidation Heatmap
While the technical analysis of the DOT price chart suggests that we are in a clear bearish trend, the futures market data hints at a potential rebound in the short term.
This chart demonstrates the Binance DOT/USDT pair’s liquidation heatmap. It is evident that tons of liquidity were located below the $6.5 level, which the price has recently dropped below. Therefore, it could be interpreted that the demand has absorbed this supply as the market is not dropping lower anymore.
Currently, a potential liquidity pool for the price to target is located above the $7 level. As a result, the price could at least experience a short-term pullback toward this level.
LIMITED OFFER 2024 for CryptoPotato readers at Bybit: Use this link to register and open a $500 BTC-USDT position on Bybit Exchange for free!


Cryptocurrency
Important Shibarium Indicator Jumps by 200% Amid Shiba Inu (SHIB) Price Revival: Details

TL;DR
- Shiba Inu’s layer-2 blockchain solution, Shibarium, saw daily transactions surge by 193%, although still below its peak activity from mid-April.
- A 4,000% increase in SHIB’s burn rate and positive analyst predictions hint at the potential for further price gains of 20-50%.

The Latest Spike
Shiba Inu’s layer-2 scaling solution – Shibarium – continues to make great strides, witnessing a substantial increase in transaction activity. Data shows that daily transactions on the network have soared to almost 18,000, a 193% jump compared to the figures observed a day earlier.
However, the metric is far from its glory days, which were registered in mid-April. Back then, daily transactions were in the millions.
Launched in the summer of 2023, Shibarium aims to foster the development of the meme coin by enhancing scalability, lowering transaction fees, and improving speed. It blasted through numerous milestones in the past few months, while its further development is considered a bullish factor for the price of Shiba Inu.
The asset has entered into green territory as of late, with its value jumping by 9% on a daily scale and 18% monthly. Meanwhile, those interested in learning more about Shibarium, feel free to check our dedicated video below:
Additional Bullish Elements
Shiba Inu’s burn rate increase can also contribute to a SHIB rally. The metric recently exploded by 4,000%, destroying millions of tokens.
The mechanism’s ultimate goal is to reduce the tremendous circulating supply of the token, making it scarcer and potentially more valuable in time.
Users on Crypto X are generally quite optimistic about SHIB’s potential price movements. Such an example is the popular analyst Ali Martinez, who recently said that the asset’s price can rise by 20% should it break “the upper boundary of this descending parallel channel at $0.00002444.” Interestingly, SHIB has gone above that level during the recent market revival and now sits at $0.0000248.
Dami-Defi was even more bullish. In case SHIB breaks out of the recently formed falling wedge pattern on the 1D time frame, its price could surge by 50%.
Binance Free $600 (CryptoPotato Exclusive): Use this link to register a new account and receive $600 exclusive welcome offer on Binance (full details).
LIMITED OFFER 2024 for CryptoPotato readers at Bybit: Use this link to register and open a $500 BTC-USDT position on Bybit Exchange for free!

Alongside the rest of the cryptocurrency market, Cardano also witnessed a lackluster month. But certain cohorts of high-profile investors have been slowly amassing significant amounts of ADA tokens.
Cardano whales – those holding between 100 million and 1 billion ADA – have added 11% to their balances in the past month, according to ITB’s latest findings.
ADA Whales Adds More Tokens
The latest surge indicates a growing confidence or strategic positioning among large ADA holders. As of now, this cohort of ADA investors commands 6.71% of the entire token supply. Such an insight highlights the whales’ substantial influence within the Cardano ecosystem.
Cardano whales holding between 100m and 1b $ADA have added 11% to their balances over the past 30 days.
This group now holds 6.71% of the entire $ADA supply. pic.twitter.com/nSe4lXE96R
— IntoTheBlock (@intotheblock) May 15, 2024
Over recent weeks, there has been a gradual increase in Cardano whale activity as reported earlier. Historically, such rises in whale activity have been associated with potential price reversals, suggesting shifts in market sentiment.
However, contrary to this trend, ADA has closely mirrored the broader market movement, which saw a modest recovery on Thursday. ADA surged by nearly 6% in the past 24 hours, reaching $0.456 at the time of writing.
Experts believe that ADA could mirror its 2021 surge even targeting $7.80 level. Further bullish predictions suggest that the world’s 10th largest cryptocurrency by market cap might reach short-term levels near $1.70 and potentially ascend to a “parabolic” peak of $10, thereby reflecting strong confidence in its growth prospects.
Earlier this week, speculation about Gemini potentially listing ADA also surged following a popular post from the exchange. If the US-based cryptocurrency exchange proceeds with listing ADA, it could trigger a significant price rally for the token.
Cardano’s User Activity
Despite optimistic price projections, user activity on the Cardano network has been declining since March this year. Data compiled by Artemis shows that daily transactions on the network have decreased significantly, currently hovering around 50.7k compared to almost 96k recorded two months ago.
Additionally, daily active addresses have followed a similar trend, briefly dipping below 24k this month. These declines in user activity raise concerns about the network’s current usage and adoption rates despite the positive sentiment surrounding Cardano’s price potential.
Binance Free $600 (CryptoPotato Exclusive): Use this link to register a new account and receive $600 exclusive welcome offer on Binance (full details).
LIMITED OFFER 2024 for CryptoPotato readers at Bybit: Use this link to register and open a $500 BTC-USDT position on Bybit Exchange for free!

Ethereum’s price has been on a gradual decline since mid-March and has yet to show any decisive sign of recovery.
Yet today’s price action is critical, as it can finally bring back some bullish momentum to the market.
Technical Analysis
By TradingRage
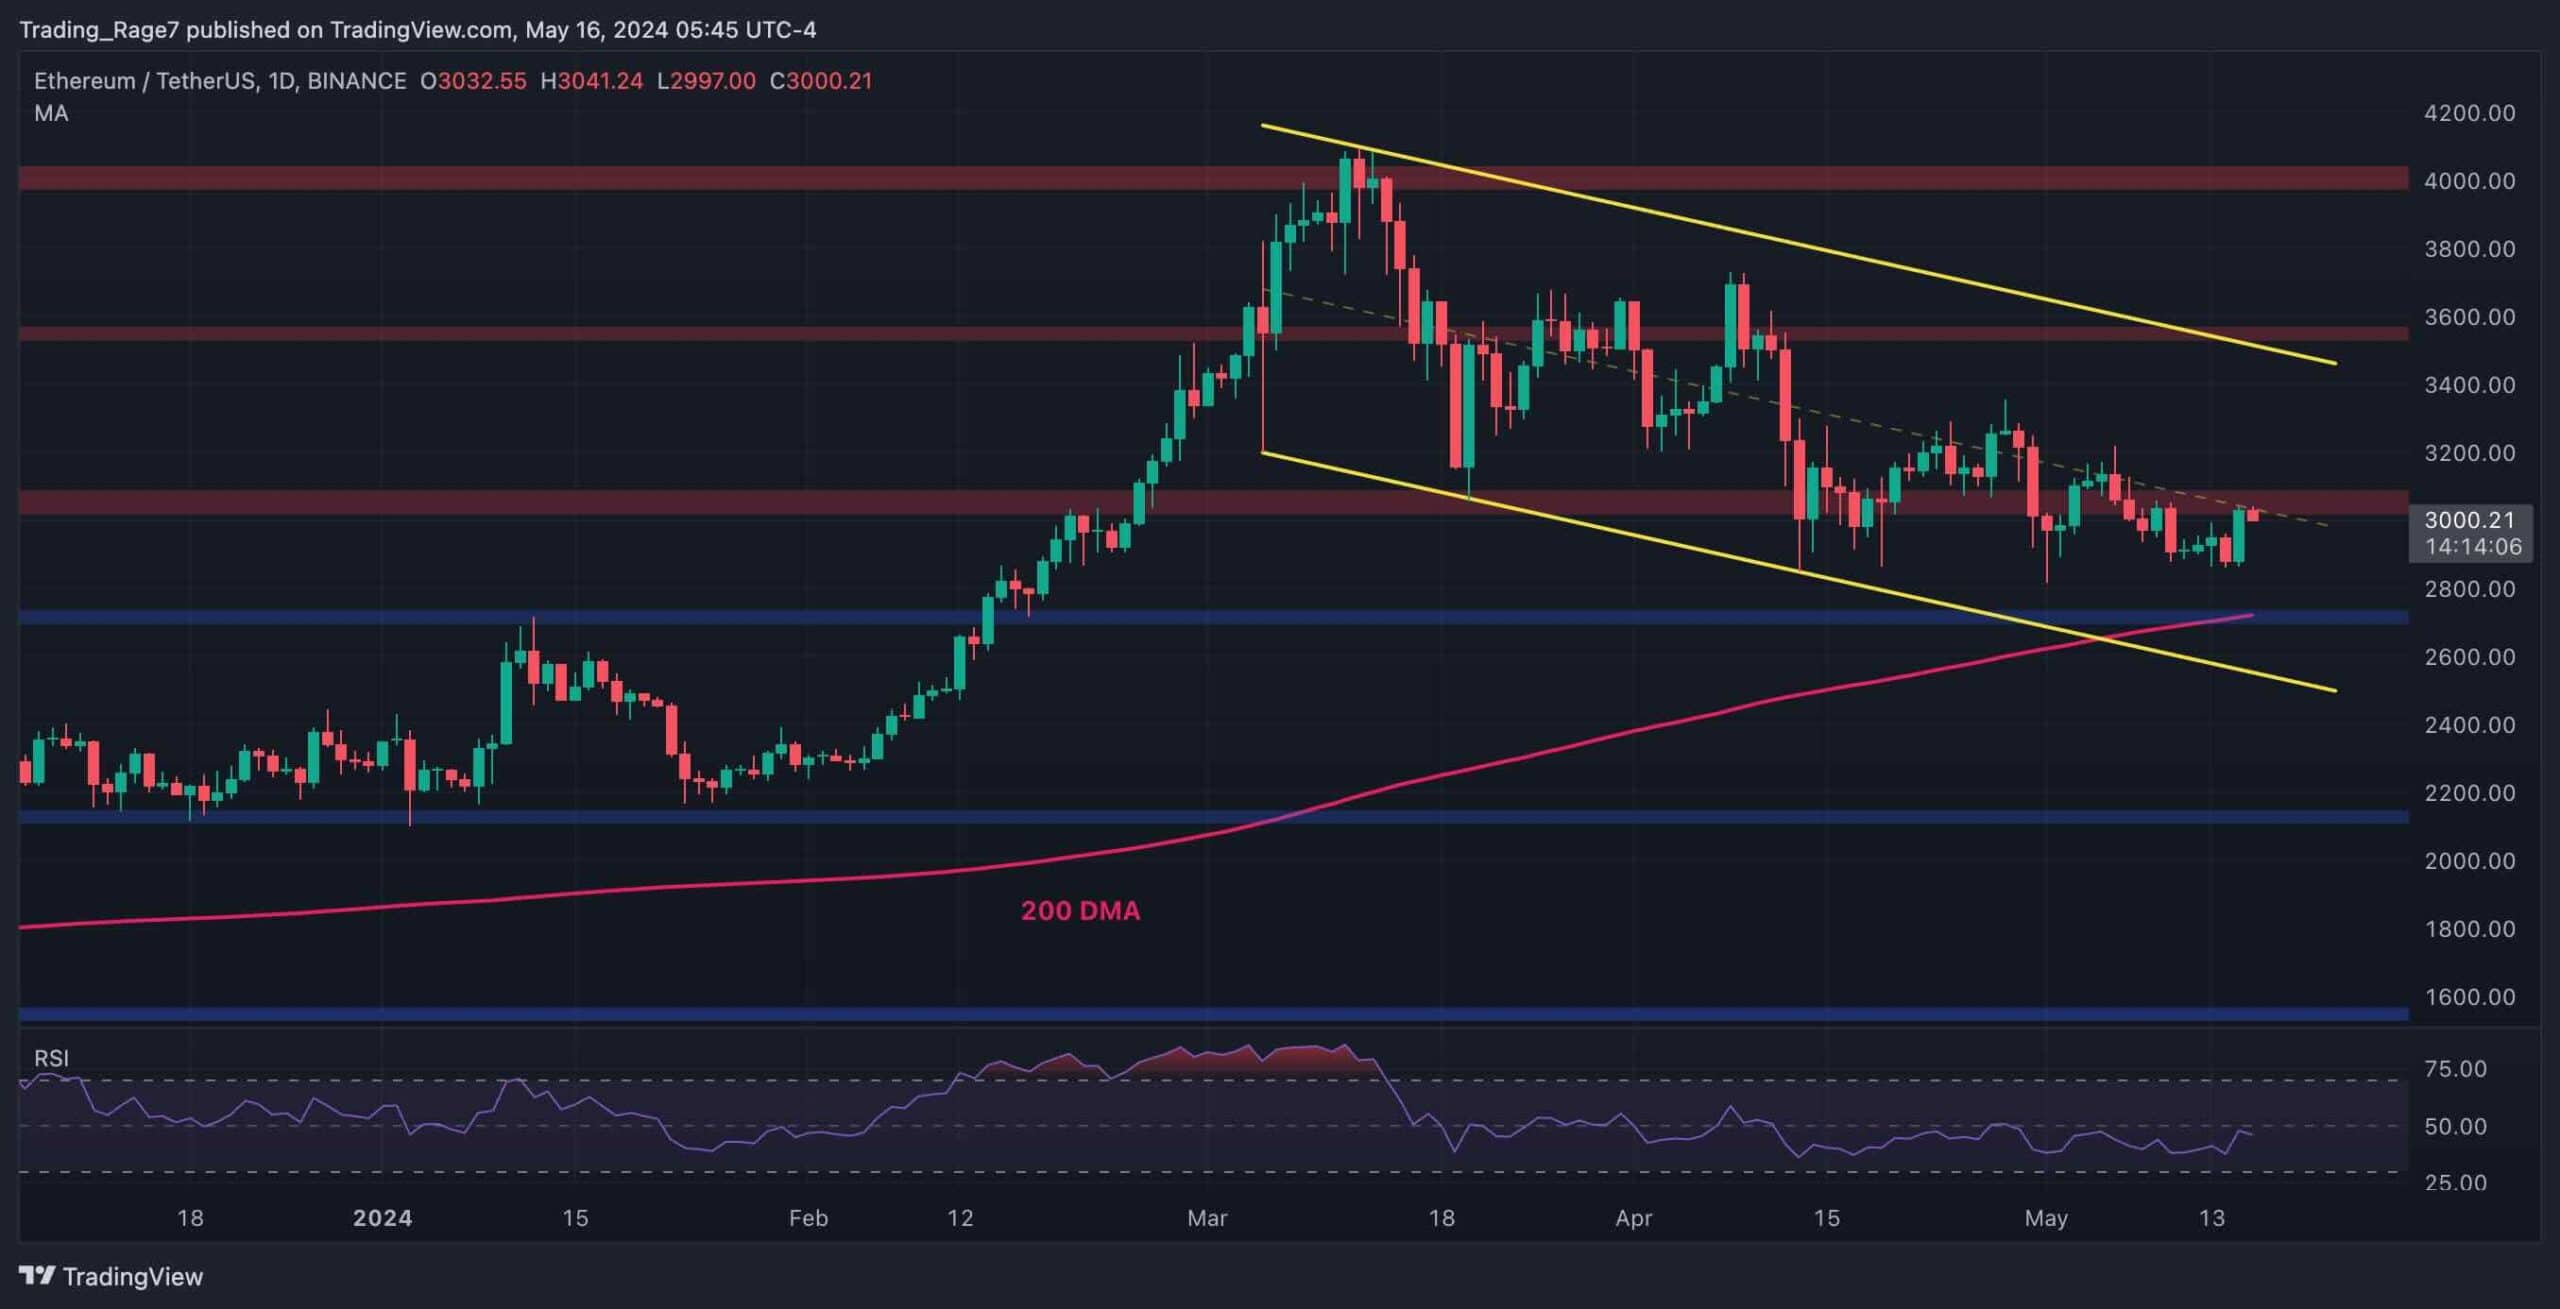
The Daily Chart
Looking at the daily timeframe, Ethereum’s price has been trending lower inside a large descending channel and is yet to break it to either side.
Meanwhile, the cryptocurrency is currently testing the midline of the range and the key $3,000 level. With the 200-day moving average located near the $2,800 support zone, the market seems more likely to rally higher toward the $3,600 resistance zone in the coming weeks.
The 4-Hour Chart
The 4-hour chart paints a more clear picture. Ethereum’s price has been rapidly rising since yesterday, but it is currently being held by the midline of the channel and the $3,000 resistance level.
Meanwhile, the RSI is showing values above 50% at the moment, indicating that the momentum is in favor of the buyers. Therefore, a breakout above the midline of the channel could lead to a quick rally toward the $3,600 resistance area.

Sentiment Analysis
By TradingRage
Exchange Reserve
Ethereum’s price has been following a downward trajectory since its rejection from the $4,000 level. Meanwhile, analyzing the market’s supply and demand dynamics can yield important information.
This chart presents the Exchange Reserve metric and its 30-day moving overage for Ethereum. Rising values are typically associated with an increase in selling pressure, as they usually indicate that the deposits are being exchanged by holders who want to sell their coins.
As the chart demonstrates, the exchange reserve metric has been experiencing an overall decline during the last few months. However, the metric has recently broken above its moving average, a sign that unusual selling has previously materialized during price drops or reversals. Therefore, investors should be hopeful that the supply will be met with sufficient demand, or things could get ugly soon.

Binance Free $600 (CryptoPotato Exclusive): Use this link to register a new account and receive $600 exclusive welcome offer on Binance (full details).
LIMITED OFFER 2024 for CryptoPotato readers at Bybit: Use this link to register and open a $500 BTC-USDT position on Bybit Exchange for free!
Disclaimer: Information found on CryptoPotato is those of writers quoted. It does not represent the opinions of CryptoPotato on whether to buy, sell, or hold any investments. You are advised to conduct your own research before making any investment decisions. Use provided information at your own risk. See Disclaimer for more information.
Cryptocurrency charts by TradingView.

 Forex2 years ago
Forex Today: the dollar is gaining strength amid gloomy sentiment at the start of the Fed’s week
- Forex2 years ago
How is the Australian dollar doing today?
- Forex1 year ago
Unbiased review of Pocket Option broker
- Forex2 years ago
Dollar to pound sterling exchange rate today: Pound plummeted to its lowest since 1985
- Cryptocurrency2 years ago
What happened in the crypto market – current events today
- World2 years ago
Why are modern video games an art form?
- Stock Markets2 years ago
Morgan Stanley: bear market rally to continue
- Economy2 years ago
Crude oil tankers double in price due to EU anti-Russian sanctions