Cryptocurrency
These On-Chain Indicators Show BTC Has More Room for Growth After Surge Above $50K: Bitfinex
Analysts at cryptocurrency exchange Bitfinex have found on-chain data to support a more bullish environment for Bitcoin (BTC), following the asset’s break above the $50,000 level.
According to the latest Bitfinex Alpha report, current on-chain indicators like the Market Value to Realized Value (MVRV) and realized price metrics suggest we are still in the early stages of a bull season.
More Room for Growth
The MVRV ratio analyzes Bitcoin market cycles, particularly identifying tops and bottoms. An MVRV greater than 2.4 indicates the market holds substantial unrealized profits, while a value below 1.0 shows unrealized losses.
The ratio was above its one-year Simple Moving Average for support at writing time. According to historical data, the movement signals the continuation of a major BTC price appreciation phase.
“This crossover essentially reflects a heightened capacity and willingness among holders to maintain their spot positions prior to opting for profit-taking. The tendency for early profit-taking, observed previously, could be ascribed to a kind of post-traumatic stress disorder stemming from bear market experiences, where investors are quick to liquidate positions at the first sign of gains to avoid potential losses,” analysts said.
Besides the MVRV, the short-term holder realized price metric also shows positive signals as this cohort of investors has slowed down in profit-taking, hinting that BTC has more room for growth.
Bitcoin ETFs Accumulate More BTC
As BTC rallies to its yearly high, outflows from Grayscale’s Bitcoin exchange-traded fund (ETF) have slowed while other crypto funds are seeing an uptick in inflows.
Recall that BTC plunged nearly 21% after the ETF approvals last month. The fall was accompanied by large outflows from Grayscale’s GBTC and substantial inflows into the other products.
However, the tide has changed, and investors have slowed down in their sales of GBTC funds. The other nine products now hold 216,309 BTC, surpassing MicroStrategy’s holdings, which began accumulating in August 2020.
Bitfinex expects the inflows to continue as the market anticipates the upcoming Bitcoin halving in April.
“These inflows, coupled with the impending 2024 Bitcoin halving and the sustained high levels of illiquid supply – with more than 70 percent of BTC in the hands of long-term holders – paint an exceptionally bullish picture for BTC price movements,” analysts added.
Binance Free $100 (Exclusive): Use this link to register and receive $100 free and 10% off fees on Binance Futures first month (terms).


Bitcoin has recently experienced an uptick in demand near the crucial support region of the 100-day moving average, leading to a notable rebound.
This price action underscores a bullish sentiment in the market with the potential for a continued rally toward a new all-time high.
Technical Analysis
By Shayan
The Daily Chart
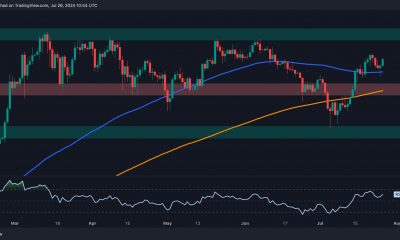
A detailed analysis of Bitcoin’s daily chart reveals that following a resurgence of demand near the critical $53K support area, the cryptocurrency initiated an impulsive bullish rally, surpassing several key resistance levels and introducing a bullish sentiment into the market.
These zones include the 200-day moving average at $60.5K, the 100-day moving average at $64.4K, and the static resistance at $61K. After breaking above the 100-day MA, the price recently exhibited a corrective retracement, completing a pullback to the broken level and validating the breakout.
Currently, Bitcoin has faced heightened buying pressure near the 100-day MA and experienced a bullish rebound toward the $67K threshold. If conditions remain stable, there is potential for the bullish trend toward the significant resistance region of $70K in the mid-term to continue.

The 4-Hour Chart
On the 4-hour chart, after receiving sufficient support near the lower boundary of the multi-month wedge at $54K, the price initiated an impulsive bullish rally, reaching the wedge’s upper trendline at $68K.
This price action clearly indicates that buyers are eager to push above the $70K resistance and set a new ATH for Bitcoin in the mid-term. During the recent rally, the price has formed an ascending short-term trendline, serving as the main support for BTC in the short term.
However, Bitcoin faced increased selling pressure near the wedge’s upper boundary, leading to a notable rejection toward the upslope trendline and the $64K support region.
Yet, the cryptocurrency was supported by the trendline and the $64K threshold, initiating a new surge toward the wedge’s upper boundary. Currently, the price is confined by the dynamic support of the ascending trendline and the dynamic resistance of the wedge’s upper boundary, roughly forming a triangle pattern.
A break above the wedge’s upper trendline will pave the way for a renewed bullish surge toward the $70K threshold. Conversely, a break below the ascending trendline could lead to a retracement toward the $64K mark.

On-chain Analysis
By Shayan
While Bitcoin’s price has experienced a notable bullish reversal, a closer examination is essential to determine if this trend will persist.
The Taker Buy/Sell Ratio, a crucial metric for evaluating futures market sentiment, provides valuable insights into the market dynamics. Values above 1 indicate aggressive buying by bulls, while values below 1 suggest bearish selling pressure.
The chart highlights the Taker Buy/Sell Ratio, which has experienced an impulsive surge above the “1” threshold concurrently with Bitcoin’s bullish revival. This surge signifies strong buying interest in the perpetual market, indicating a notable bullish sentiment and significant buying activity. If the upward trend in the Taker Buy/Sell Ratio continues, it confirms a potential mid-term bullish trend, with the price likely rallying toward the $70K mark.

Binance Free $600 (CryptoPotato Exclusive): Use this link to register a new account and receive $600 exclusive welcome offer on Binance (full details).
LIMITED OFFER 2024 at BYDFi Exchange: Up to $2,888 welcome reward, use this link to register and open a 100 USDT-M position for free!
Disclaimer: Information found on CryptoPotato is those of writers quoted. It does not represent the opinions of CryptoPotato on whether to buy, sell, or hold any investments. You are advised to conduct your own research before making any investment decisions. Use provided information at your own risk. See Disclaimer for more information.
Cryptocurrency charts by TradingView.
Cryptocurrency
MEET48 “2024 GIPR2” Voting Event Final Results on August 3rd, Ranking Top on DappBay and DappRadar

[PRESS RELEASE – Singapore, Singapore, July 26th, 2024]
Recently, the “2024 GIPR2” voting event Dapp of MEET48, a metaverse virtual community based on an AI and WEB3.0 diversified UGC entertainment content ecosystem, has rapidly risen in the rankings on DappBay and DappRadar, attracting widespread attention.
The MEET48 “2024 GIPR2” voting event (https://gipr.meet48.xyz/#/gipr) is divided into the Idol Group, Sprout Group, and Virtual Idol Group. Users can log into the MEET48 official website and app, complete tasks and watch contestant videos to earn points, mint NFTs, and use points to buy voting tickets to vote for idols. The final voting rankings will determine the metaverse and overseas offline performance resources that participants will receive. Users who participate in voting interactions will also be whitelisted for future airdrop eligibility.
As of 12PM on July 26, 2024, the MEET48 event Dapp has become the number one social category Dapp on DappBay and ranked fifth in the social category on DappRadar.
According to DappRadar data, MEET48’s event Dapp recorded 25.25 million on-chain transactions in the past 30 days, with 669.98K active user addresses (UAW). In DappBay’s statistics, MEET48’s event Dapp also performed excellently, with 25.62 million on-chain transactions and 647K users in the past 30 days.
Currently, the MEET48 “2024 GIPR2” voting event Dapp has over 3 million registered users, and the total accumulated votes in the event have exceeded 10 million. These users, who joined through the airdrop, will eventually be integrated into MEET48’s intelligent social metaverse community through the MEET48 content ecosystem matrix products.
With the final results of the “2024 GIPR2” voting airdrop event set to be announced on August 3rd, MEET48’s popularity is expected to continue rising. For those who have not yet participated, there is still an opportunity to complete tasks and earn points to join the airdrop event:
https://gipr.meet48.xyz/#/gipr.
About MEET48
MEET48 currently boasts a technical and R&D team of 500 people, covering regional operations in Singapore, Hong Kong, Taipei, Tokyo, Seoul, and Dubai. This makes it one of the largest Web3 application project teams globally. MEET48 aims to achieve the mass adoption of Web3 technology by focusing on an AI UGC content ecosystem centered on AIGC (Animation, IDOL, GAME, and Comics) Gen Z trend entertainment content and a graphical, intelligent metaverse social base.
For more information users can visit MEET48’s: Official Website | Twitter (X) | Telegram | Discord
Binance Free $600 (CryptoPotato Exclusive): Use this link to register a new account and receive $600 exclusive welcome offer on Binance (full details).
LIMITED OFFER 2024 at BYDFi Exchange: Up to $2,888 welcome reward, use this link to register and open a 100 USDT-M position for free!
Ripple’s price is finally gaining some bullish momentum following months of downtrend and consolidation.
By TradingRage
The USDT Paired Chart
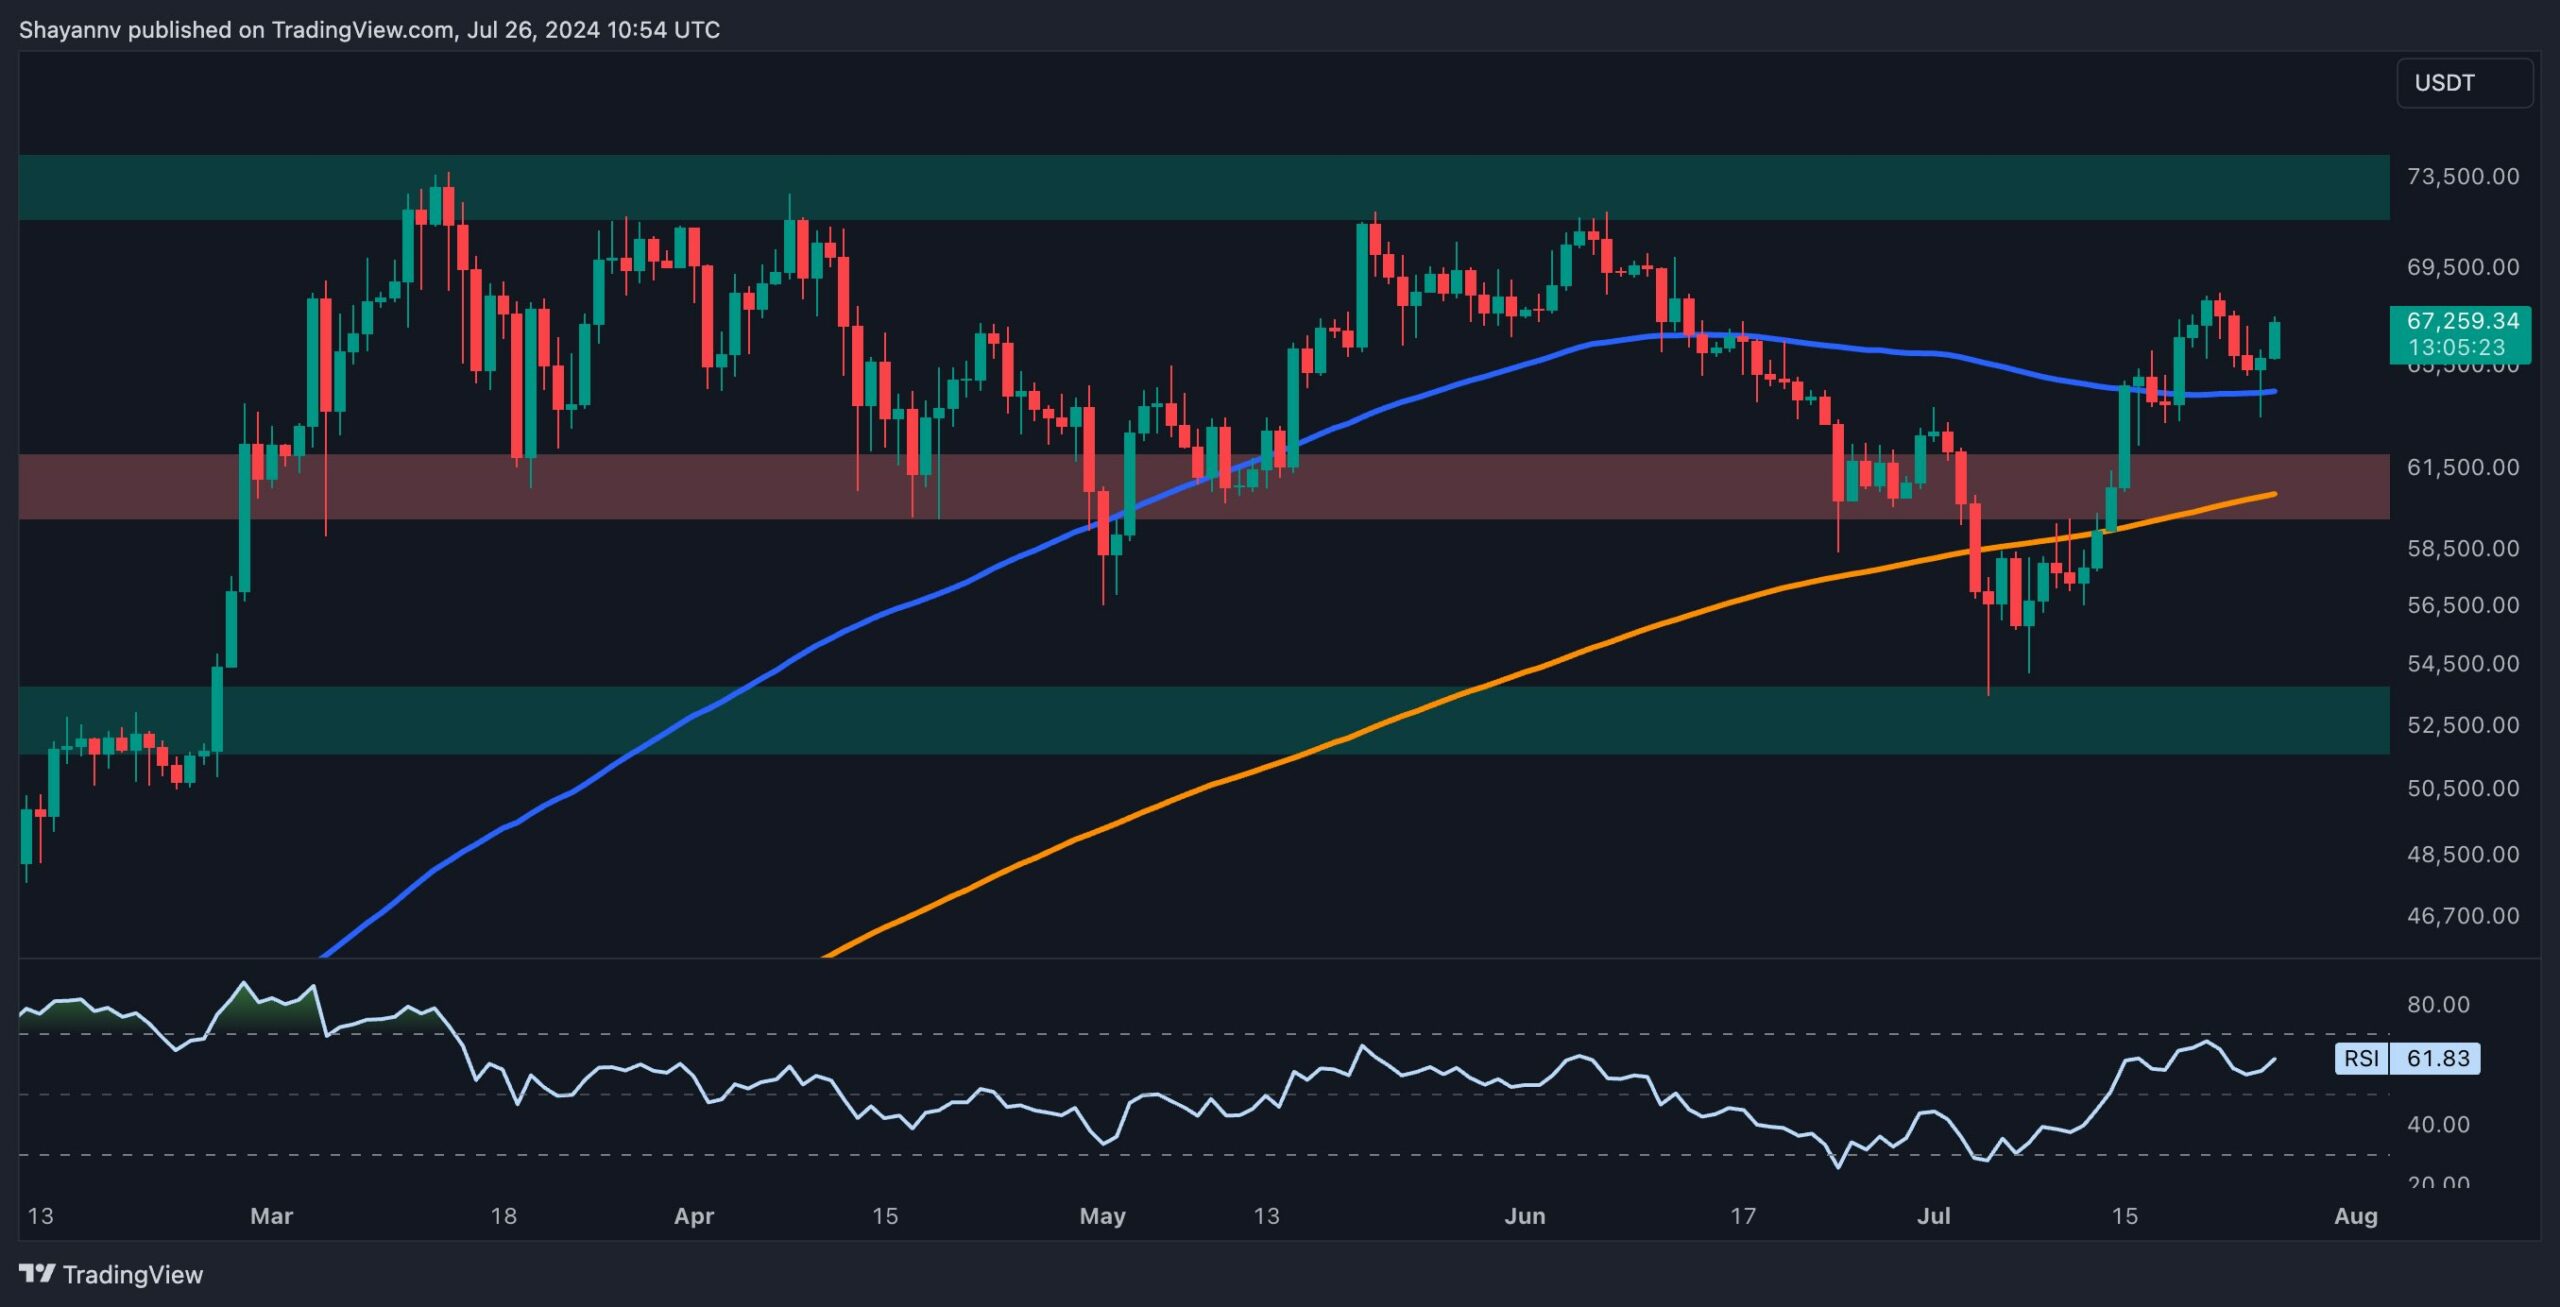
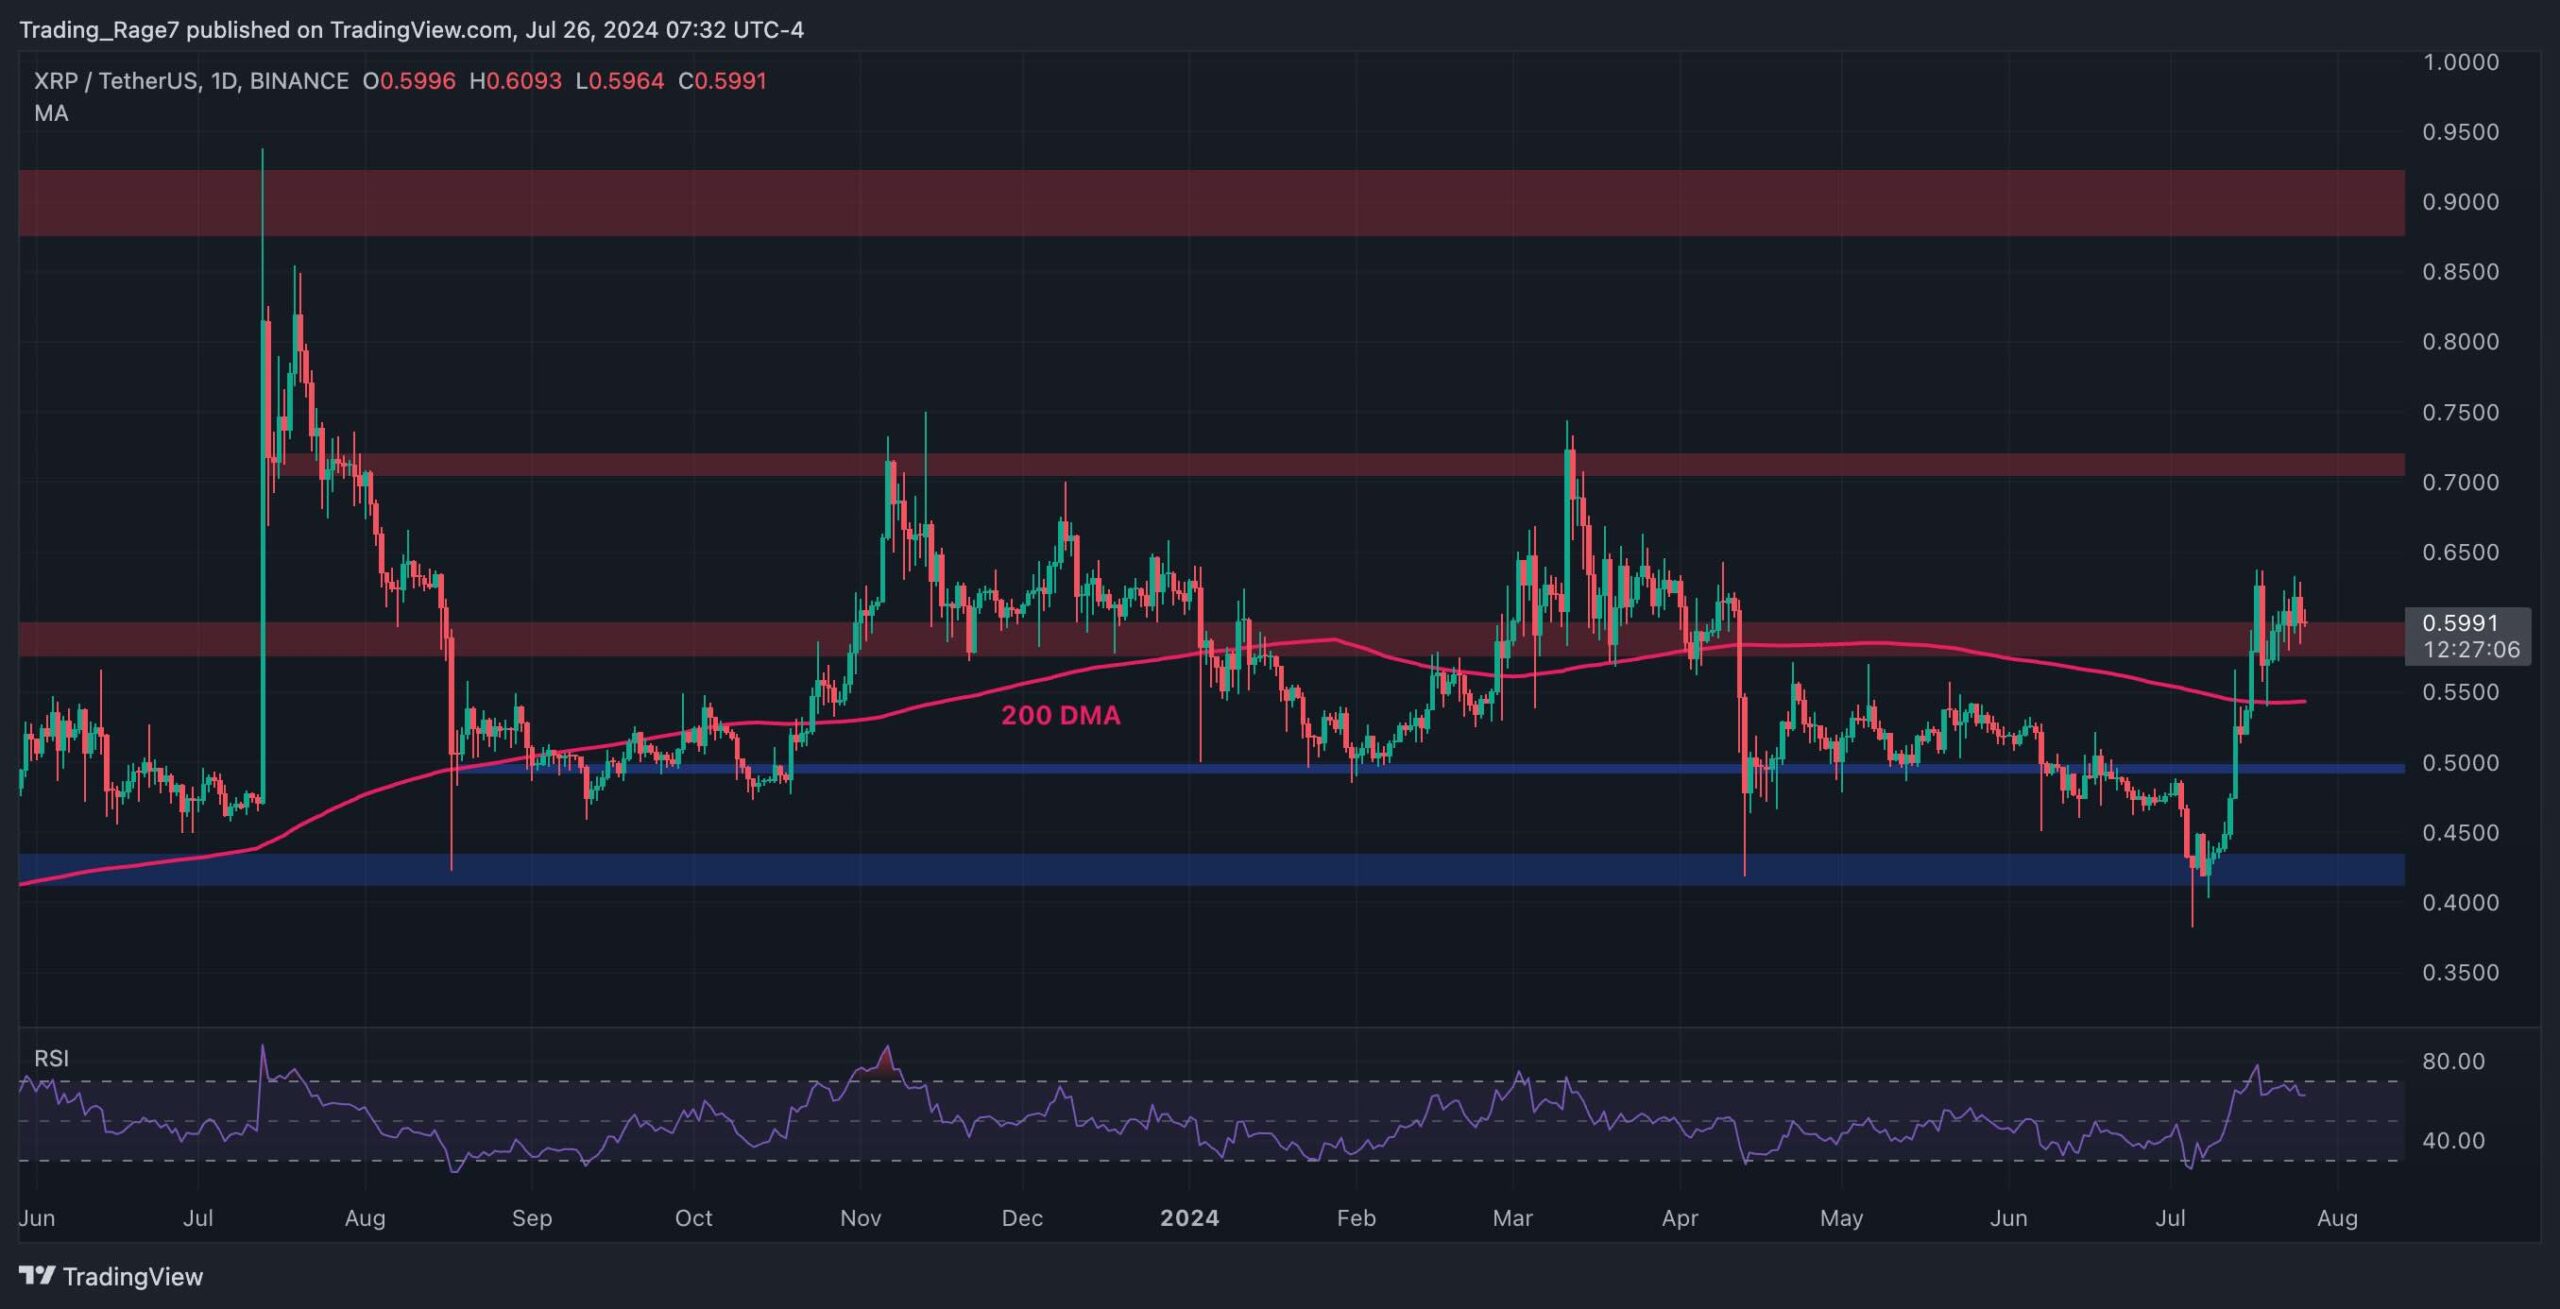
Analyzing the XRP/USDT pair, it is evident that the price has demonstrated a rapid recovery from the $0.43 support level. It broke above both the $0.5 level and the 200-day moving average, located around the $0.55 mark.
The price is currently on the verge of breaking above the $0.59 resistance zone and if it succeeds, a rally higher toward the key $0.72 resistance level would be probable in the coming weeks.

The BTC Paired Chart
The BTC paired chart also displays a similar behavior. The market has rebounded and broken above the 800 SAT level. Yet, the price has yet to break through the 200-day moving average, located around the 900 SAT mark.
Typically, a rise above the 200-day moving average indicates the beginning of a new uptrend. Therefore, if a breakout occurs, XRP will likely significantly appreciate against BTC in the short term.

Binance Free $600 (CryptoPotato Exclusive): Use this link to register a new account and receive $600 exclusive welcome offer on Binance (full details).
LIMITED OFFER 2024 at BYDFi Exchange: Up to $2,888 welcome reward, use this link to register and open a 100 USDT-M position for free!
Disclaimer: Information found on CryptoPotato is those of writers quoted. It does not represent the opinions of CryptoPotato on whether to buy, sell, or hold any investments. You are advised to conduct your own research before making any investment decisions. Use provided information at your own risk. See Disclaimer for more information.
Cryptocurrency charts by TradingView.

 Forex2 years ago
Forex Today: the dollar is gaining strength amid gloomy sentiment at the start of the Fed’s week
- Forex2 years ago
How is the Australian dollar doing today?
- Forex2 years ago
Unbiased review of Pocket Option broker
- Forex2 years ago
Dollar to pound sterling exchange rate today: Pound plummeted to its lowest since 1985
- Cryptocurrency2 years ago
What happened in the crypto market – current events today
- World2 years ago
Why are modern video games an art form?
- Stock Markets2 years ago
Morgan Stanley: bear market rally to continue
- Economy2 years ago
Crude oil tankers double in price due to EU anti-Russian sanctions