Cryptocurrency
War, CPI and $28K BTC price — 5 things to know in Bitcoin this week

Bitcoin (BTC) starts the second week of October up 4% month-to-date as geopolitical instability provides a snap market focus.
BTC price action continues to hold steady at $28,000, but what will happen next as markets react to the war in Israel?
In what could end up a volatile period for risk assets, Bitcoin has yet to offer a significant reaction, spending the weekend in a tight corridor.
That could soon change, however, as the Wall Street open comes amid a hike in oil and gold, along with U.S. dollar strength.
Macroeconomic triggers are also far from lacking, with the coming days due to see the September print of the U.S. Consumer Price Index (CPI). In the wake of surprise employment data last week, the readout holds additional importance for the Federal Reserve.
Beneath the hood, meanwhile, on-chain metrics are pointing to interesting times for Bitcoin, as BTC/USD trades in a key range, which has formed a watershed area since 2021.
Cointelegraph looks at these factors and more in the weekly rundown of potential BTC price triggers to come.
Bitcoin “illiquid and choppy” as weekly close passes
The weekend saw market participants fully focused on the abrupt breakout of war in Israel, and as markets themselves reopen, change is already afoot.
For Bitcoin, however, the ongoing events have yet to deliver a palpable chain reaction, data from Cointelegraph Markets Pro and TradingView shows.
BTC price action has centered on $28,000 since Friday, and that level remains key as traders hope for a resistance/support flip.

“Nothing special going on this weekend,” Daan Crypto Trades summarized on X (formerly Twitter) into the weekly close.
“Would expect volumes to pick up a bit soon but ultimately we should be hovering around this price region until futures open back up tonight.”
A further post noted that Bitcoin had yet to decisively break through the 200-week moving average (MA), which sits at $28,176 at the time of writing.
Analyzing the 4-hour chart, popular trader Skew described BTC price behavior as “illiquid and choppy.”
$BTC 4H
these wicks really say how illiquid & choppy price action is pic.twitter.com/Qq13GsuqfB— Skew Δ (@52kskew) October 9, 2023
“Bitcoin’s bullish flag is still in play — but it is taking too long to play out,” fellow trader Jelle continued, zooming out to monthly performance.
“October is generally the most bullish month of the year, thus I’m still expecting this one to break out upwards.”

War returns to crypto observers’ radar
When it comes to price triggers, however, the unfolding conflict in Israel has Bitcoin and crypto market participants anticipating the bulk of volatility is still to come.
With the memory of Bitcoin’s reaction to the war in Ukraine in February 2022 still in the background, Jelle was cautious over what might happen to BTC/USD next.
“All I do know is that the Ukraine war triggered an 8% down candle, that was erased within a day,” part of the day’s X commentary explained.
Mike McGlone, senior macro strategist at Bloomberg Intelligence, meanwhile described Bitcoin as now showing a “risk-off tilt” among traders.
“My bias is the downward sloping 100-week moving average is likely to win the battle vs. the up trending 50-week. Spiking #crudeoil is a liquidity pressure factor,” he wrote on Oct. 8.

At the time, the 100-week and 50-week MAs were at $28,938 and $24,890, respectively.
McGlone touched on an unfolding macro asset phenomenon, with gold up 1% on the day and Brent crude up 3.25% ahead of the Wall Street open.
“Markets reacting quite defensively,” Skew added, noting renewed strength in the U.S. Dollar Index (DXY), which gained 0.4%.
Last week, the DXY hit its highest levels since late 2022.

CPI leads “huge week for inflation”
In the U.S., attention focuses on the week’s macroeconomic data prints, headlined by the September CPI report.
After jobs data last week showed that employment levels remained resilient despite anti-inflation moves from the Fed, Bitcoin briefly recoiled over fears that officials would enact another interest rate hike, further pressuring liquidity.
While BTC/USD rebounded, those fears remain.
“A good CPI data on Thursday could provide a chance to break out from this range, whereas a hot CPI would push us back into the range lows with the premise that the FED might be forced to hike 25bsp,” part of weekend analysis from popular commentator CrypNuevo read.

According to data from CME Group’s FedWatch Tool, markets are increasingly betting on rates staying at current levels on decision day, set for Nov. 1.
Beyond CPI, this week will see the Producer Price Index (PPI) release, along with more jobless claims and a total of 12 Fed speakers delivering commentary. The minutes of the Fed meeting around the previous rates decision will also be unveiled on Oct. 11.
Key Events This Week:
1. September PPI Inflation – Wednesday
2. Fed Meeting Minutes – Wednesday
3. September CPI Inflation – Thursday
4. OPEC Monthly Report – Thursday
5. Jobless Claims Data – Thursday
6. Total of 12 Fed speaker events
Huge week for inflation and the Fed.
— The Kobeissi Letter (@KobeissiLetter) October 8, 2023
“Huge week for inflation and the Fed,” financial commentary resource The Kobeissi Letter summarized in part of an X thread.
“In addition, markets will react to geopolitical tensions from this weekend. Volatility is the new normal.”
NVT signal spikes to highest since 2018
Within Bitcoin, the network value to transaction (NVT) signal leads the pack on on-chain metric volatility to start the week.
NVT, which its creator, Dmity Kalichkin, describes as a “PE ratio” for Bitcoin, seeks to estimate local BTC price tops and bottoms by comparing market cap to daily on-chain transaction values.
The latest data from on-chain analytics firm Glassnode shows NVT hitting its highest levels in five years — over 1,750 and far beyond its position at the start of 2023.

NVT has undergone various overhauls in recent years, as the dynamics of the BTC supply call for different guidance figures for determining price tops.
“If the trend towards side-chains and private transactions continues, we can expect less-and-less transactions to be captured in the public on-chain data (reducing the relative value of the “T” in NVT),” Charles Edwards, founder of quantitative Bitcoin and digital asset fund Capriole Investments, wrote in part of his own research in 2019.
“This could cause the fair value NVT range to increase with time.”
Analyzing the NVT spike, crypto market intelligence platform IntoTheBlock suggested that it was representative of a broader metamorphosis.
“The lens through which we view Bitcoin’s value is changing,” it wrote at the weekend.
“Transaction value & volume were once the go-to metrics. However, recent spikes in NVT ratios hint that Bitcoin’s value is now moving independently of transactional utility, hinting at its growing role as a store of value.”
Neither fearful, nor greedy
Providing a fleeting insight into crypto market sentiment, the classic Crypto Fear & Greed Index reflects an overall air of indecision.
Related: Bitcoin bull market awaits as US faces ‘bear steepener’ — Arthur Hayes
The average investor is ambivalent when it comes to the market, as shown by the Index sticking rigidly to its “neutral” territory.
As of Oct. 9, Fear & Greed is at 50/100 — exactly half way along its scale between two sentiment extremes.
Zooming out, recent months have marked some of its least volatile conditions on record.
“You know the drill, i will be mass buying when we drop down to Extreme Fear and a $20,000 Bitcoin,” popular trader Crypto Tony reacted to the latest data.
“May take a while, but i feel Q1 / Q2 2024 will be the ticket. If i see a change in behaviour i will re-evaluate.”
Crypto Tony referenced an inkling that BTC/USD will return to $20,000 for a final retest before expanding higher after the 2024 block subsidy halving.

This article does not contain investment advice or recommendations. Every investment and trading move involves risk, and readers should conduct their own research when making a decision.


Bitcoin’s recent market correction that dragged the world’s largest cryptocurrency near the low of $56,500 turned out to be a good opportunity for high-profile investors.
Data shared by CryptoQuant CEO Ki Young Ju revealed that whales have accumulated a whopping 47,000 BTC – worth more than $2.8 billion in current price – over the past 24 hours alone. This shopping spree signals the beginning of “a new era” for the primary cryptocurrency, according to the exec.
Bitcoin whales increasing their holdings may indicate growing confidence in the cryptocurrency’s future trajectory among institutional investors or high-net-worth entities.
The CryptoQuant founder also revealed that the whale wallets in question are mostly custodial ones, including ETFs, but clarified that the recent spike is not ETF-related.
#Bitcoin whales accumulated 47K $BTC in the past 24 hours. We’re entering a new era. pic.twitter.com/SXgzToN8GU
— Ki Young Ju (@ki_young_ju) May 3, 2024
There appears to be a change of heart as just a week ago, long-term bitcoin whales saw a substantial increase in their unrealized profits, especially as the price remained above $60,000.
Although their profits had risen significantly, these whales hadn’t yet cashed out, indicating they were holding onto their positions.
This aligned with a notable increase in bitcoin exchange inflows, mostly attributed to whales, which subsequently led to a market-wide slump.
Following the latest whale accumulation, however, bitcoin climbed by over 6% to surge above $62,000 on Friday, staging a modest relief rally.
The whale known as “Mr. 100” bought over 4,100 BTC worth over $242 million at around $58,000 on May 2nd, marking the wallet’s first bitcoin purchase since April 19, just before the 2024 halving.
LIMITED OFFER 2024 for CryptoPotato readers at Bybit: Use this link to register and open a $500 BTC-USDT position on Bybit Exchange for free!
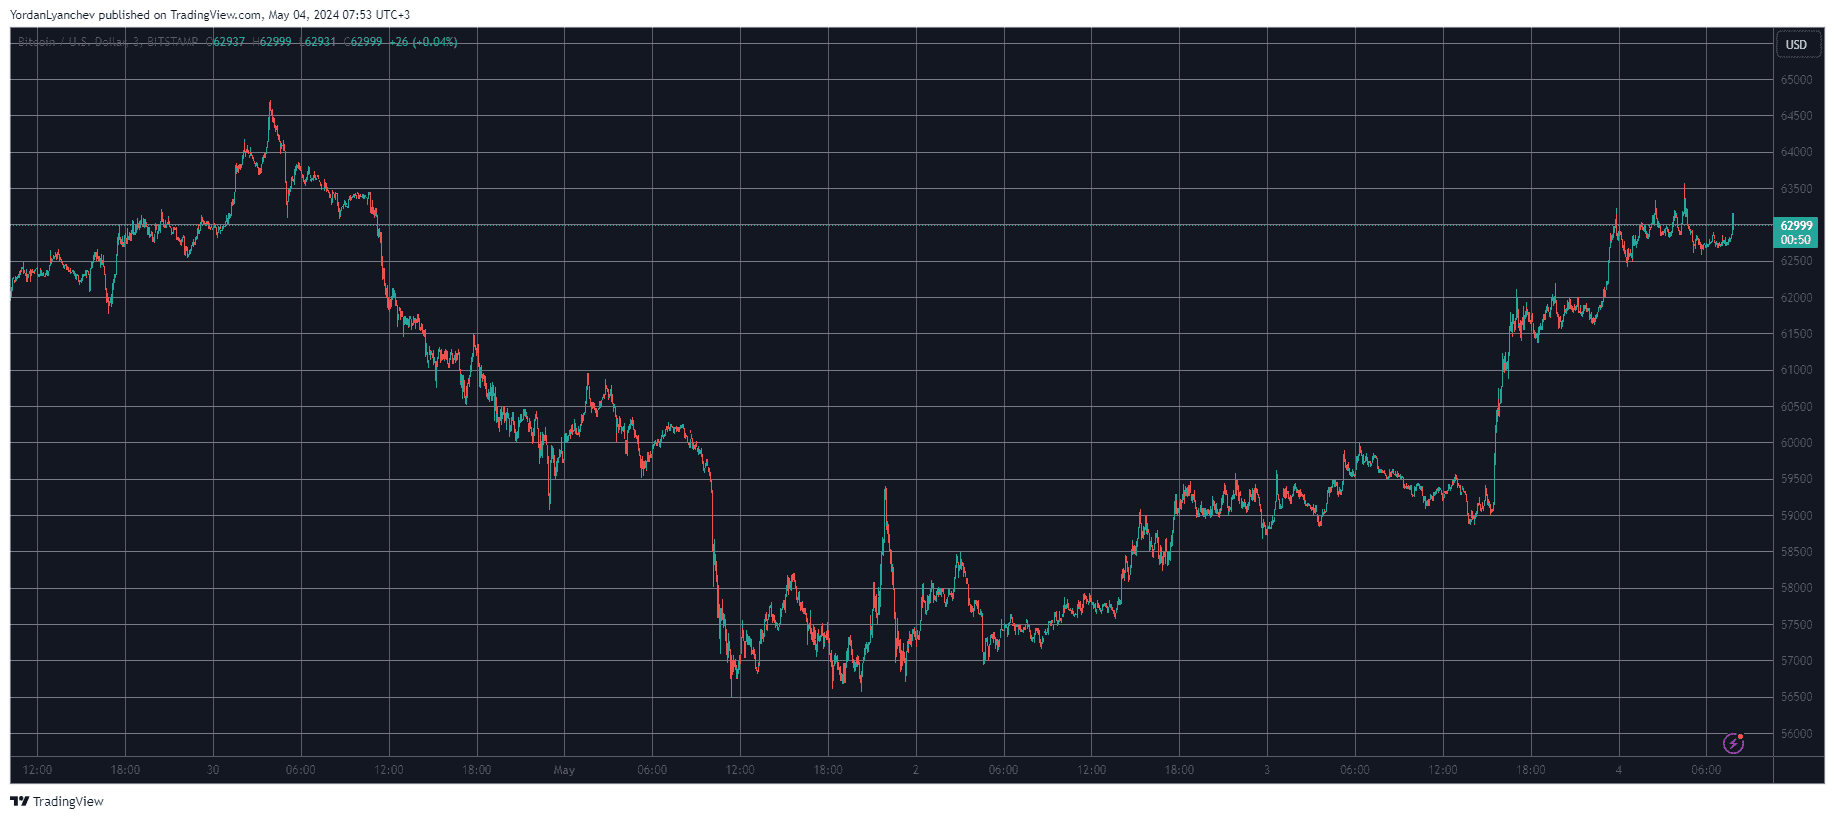
Bitcoin’s recovery tour continues as the cryptocurrency jumped from under $59,000 yesterday to a multi-day peak of over $63,000 earlier today.
Most altcoins have followed suit with impressive gains once again, including the ever-volatile meme coin sector.
BTC Goes After $63K
Bitcoin had a highly adverse trading week as its price dumped hard on a few occasions. It all started positively on Monday morning when BTC pumped to almost $65,000, but the bears took control of the market immediately and pushed it south to $62,000.
The declines were far from over as the asset further slumped to and below $60,000. The correction culminated in a two-month low of $56,500 charted on Wednesday, ahead of the latest US FOMC meeting.
Once that was completed and the Fed said it will not raise the interest rates soon, BTC reacted with a $2,000 pump and dump and returned to its starting position. It started to recover more ground in the following hours and neared $60,000 yesterday, as reported.
It was stopped there at first, but managed to break through that psychological resistance later that day. The bulls kept the pressure on and pushed BTC to a multi-day peak of $63,500. Despite losing some ground since then, bitcoin currently sits at around $63,000.
Its 6% daily increase means that its market cap has risen to $1.240 trillion, while its dominance over the alts stands at 50.5%.
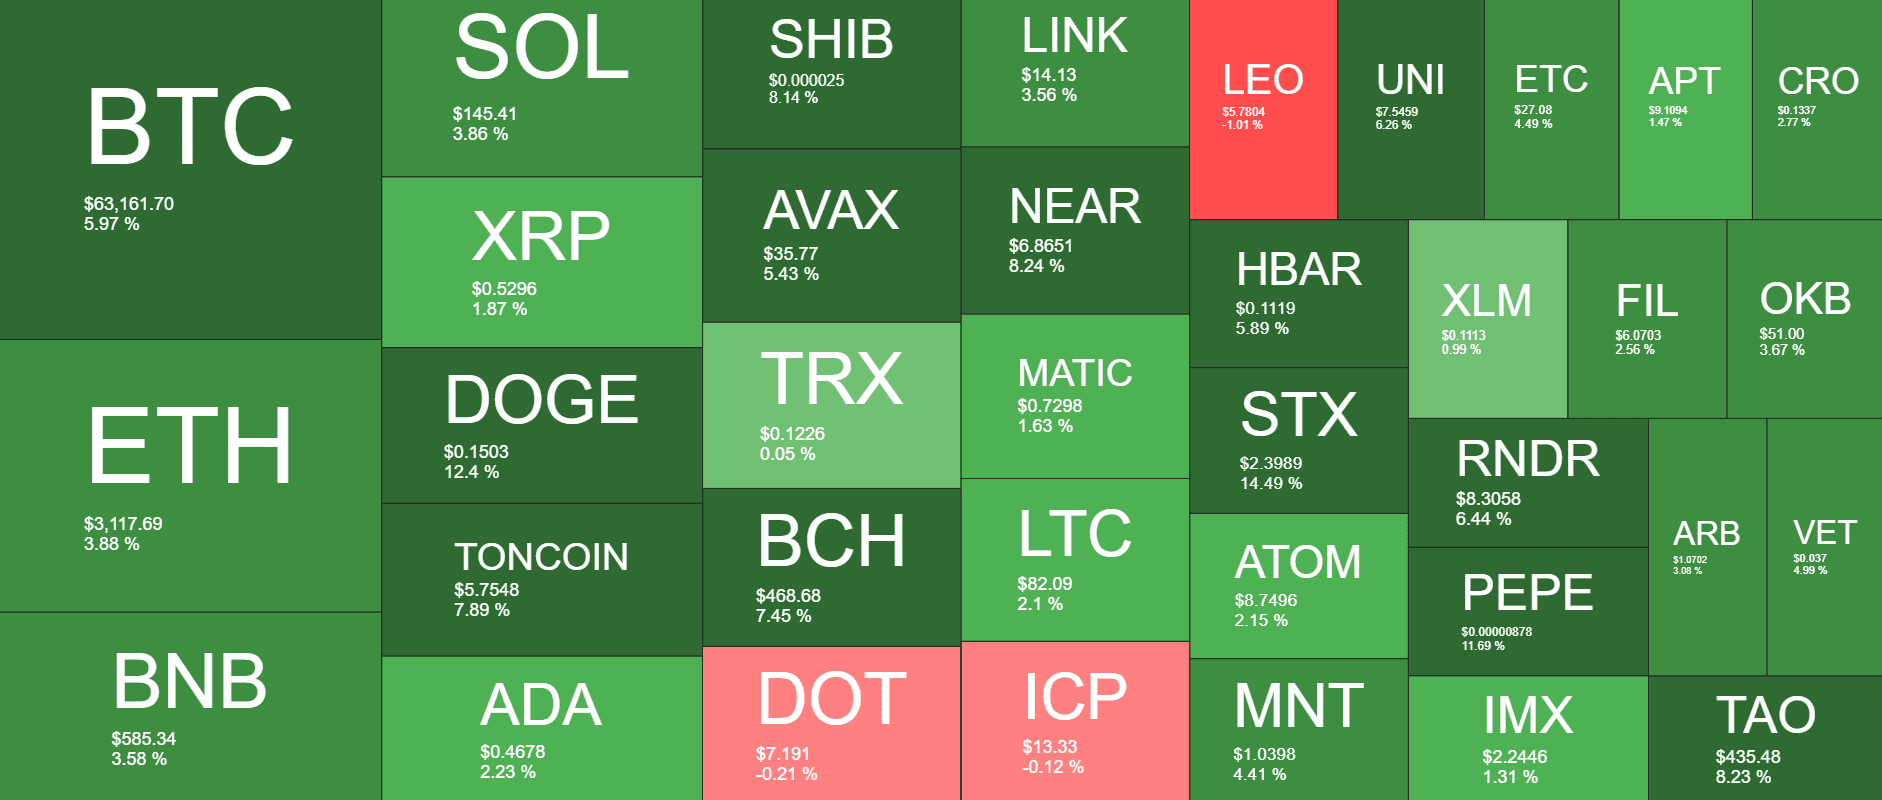
DOGE, SHIB, PEPE on the Rise
The top gainers from the largest altcoins come from the volatile meme coin sector. Dogecoin, the first and largest of the cohort, is up by over 12% and now trades at $0.15. PEPE has followed suit with an 11.7% jump, while SHIB has gained 8% and is above $0.000025. The other highly impressive gainer is STX, which has soared by 14% to $2.4.
Ethereum and Binance Coin have increased by similar percentages of around 3.5%. Consequently, ETH has soared past $3,100, while BNB is at $585.
The rest of the larger-cap alts are also in the green, including TON, BC, AVAX, NEAR, and HBAR. The total crypto market cap has recovered more than $200 billion since the low of Wednesday and is up to $2.460 trillion on CG.
LIMITED OFFER 2024 for CryptoPotato readers at Bybit: Use this link to register and open a $500 BTC-USDT position on Bybit Exchange for free!
Disclaimer: Information found on CryptoPotato is those of writers quoted. It does not represent the opinions of CryptoPotato on whether to buy, sell, or hold any investments. You are advised to conduct your own research before making any investment decisions. Use provided information at your own risk. See Disclaimer for more information.
Cryptocurrency charts by TradingView.

CryptoQuant analysts have found that Bitcoin miners have increased their selling activity in the last month amid slow demand growth for BTC.
According to the latest CryptoQuant weekly report, the decrease in BTC demand is evident in low Bitcoin whale demand, fewer purchases from spot exchange-traded funds in the United States, and the Coinbase premium falling below zero.
Miners Increase Selling Activity
Miners have sent a large amount of BTC to spot exchanges, creating an imbalance in the market. Since the halving was completed on April 19, miners’ revenue has decreased significantly following the reduction of block rewards by 50%.
Presently, mining entities are selling their holdings to cover operational costs; however, if the trend continues and miners’ profitability turns negative, the price of BTC may witness more pressure.
Due to the high miner selling activity, BTC supply is outpacing demand. CryptoQuant head of research Julio Moreno revealed yesterday that the total balance of BTC at over-the-counter (OTC) desks started to increase when the crypto asset peaked at $73,000 in mid-March. OTC supply has remained on the rise since then, hitting its highest level since November 2022, but demand has slowed.
Demand for BTC Slows Down
The monthly growth of BTC demand from permanent holders (investors who purchase BTC and never sell) has plummeted 50% from 200,000 BTC in late March to 96,000 BTC at the time of writing. Analysts noted that accelerating demand growth is needed for prices to bottom and eventually spike.
Demand growth from large investors and Bitcoin whales has also fallen from a peak of 12% in late March to 6% currently. Spot Bitcoin ETFs in the U.S. have recently recorded significant outflows and little to no inflows, falling significantly from a mid-March peak of $1 billion.
Additionally, the funding rate in the perpetual futures market has fallen to its lowest level this year, indicating that selling orders are outpacing buy orders, and traders are not willing to pay as much as before to open long positions. Traders are also opening more short positions in anticipation of further price declines.
With BTC hovering around two-month low levels of $60,000, the asset may target $55,000 to $57,000 in the short term. This range is 10% below traders’ current cost basis of $63,000, a level which acts as a support during bull markets.
LIMITED OFFER 2024 for CryptoPotato readers at Bybit: Use this link to register and open a $500 BTC-USDT position on Bybit Exchange for free!

 Forex2 years ago
Forex Today: the dollar is gaining strength amid gloomy sentiment at the start of the Fed’s week
- Forex2 years ago
How is the Australian dollar doing today?
- Forex1 year ago
Unbiased review of Pocket Option broker
- Forex2 years ago
Dollar to pound sterling exchange rate today: Pound plummeted to its lowest since 1985
- Cryptocurrency2 years ago
What happened in the crypto market – current events today
- World2 years ago
Why are modern video games an art form?
- Stock Markets2 years ago
Morgan Stanley: bear market rally to continue
- Economy2 years ago
Crude oil tankers double in price due to EU anti-Russian sanctions