Stock Markets
FIRST RESOURCE BANCORP, INC. ANNOUNCES 2024 FIRST QUARTER RESULTS; CONTINUED BALANCE SHEET GROWTH OFFSETS MARGIN COMPRESSION

EXTON, Pa., April 25, 2024 /PRNewswire/ — First Resource Bancorp, Inc. (OTCQX: FRSB), the holding company for First Resource Bank, announced financial results for the three months ended March 31, 2024.
Lauren C. Ranalli, President and CEO, stated, “In a market where many of our peers are reducing lending, we’ve seized the chance to further expand the Bank. Our robust loan growth and disciplined pricing strategies have helped offset rising deposit costs to some extent. Net interest income remained largely steady compared to the previous quarter, despite the ongoing margin compression.”
Highlights for the first quarter of 2024 included:
- Total interest income grew 31% over the prior year
- Net interest income grew 7% over the prior year
- Total loans grew 4% during the first quarter, or 14% annualized
- Total deposits grew 3% during the first quarter, or 11% annualized
- Swap loan referral income totaled $182 thousand during the first quarter, more than double the entire prior year
- There were no non-accrual or non-performing loans as of March 31, 2024
- Book value per share grew 3% to $15.34
Net income for the quarter ended March 31, 2024 was $1.3 million, or $0.43 per common share, compared to $1.6 million, or $0.53 per common share, for the previous quarter and $1.3 million, or $0.41 per common share, for the first quarter of the prior year. Annualized return on average assets was 0.92% for the first quarter of 2024 compared to 1.00% for the first quarter of 2023. Annualized return on average equity was 11.39% for the first quarter of 2024 compared to 12.57% for the same period a year prior.
Total interest income increased quarterly by $200 thousand, or 2%, from $8.2 million for the fourth quarter of 2023 to $8.4 million for the first quarter of 2024. This increase was driven by 4% growth in loans during the first quarter.
Total interest income increased $2.0 million, marking a 31% rise from $6.4 million in the first quarter of 2023 to $8.4 million in the corresponding period of 2024. This increase was driven by a 14% expansion in loans compared to the previous year, complemented by an increased rate environment, favorably affecting interest-earning assets.
Total interest expense increased 7% when comparing the first quarter of 2024 to the fourth quarter of 2023. This increase stemmed from an 8 basis point rise in the cost of money market accounts and a 29 basis point increase in the cost of time deposits, alongside a higher volume of time deposits quarter over quarter. Additionally, interest expense on FHLB borrowings increased by 7% due to a rise in the average balance and cost of advances during the first quarter of 2024 compared to the fourth quarter of 2023.
Total interest expense increased by 82%, climbing from $2.0 million in the first quarter of 2023 to $3.7 million for the first quarter of 2024. The primary driver of this increased expense was a 114 basis point rise in the cost of money market deposits and a 198 basis point increase in the cost of time deposits, coupled with a greater volume of money market accounts and time deposits year over year.
“Rising deposit costs are one of the biggest challenges facing the industry at the moment,” commented Ranalli. “To address this, we’ve allocated substantial internal resources towards optimizing our cost of funds while simultaneously growing our deposit portfolio to support loan growth. Our management team has been bolstered by the addition of an experienced retail banking executive and our lending and deposit teams are collaborating closely, creating synergies via joint calling efforts in the pursuit of new deposit relationships.”
In the first quarter of 2024, net interest income saw a slight decrease of $49 thousand, or 1%, compared to the previous quarter. The net interest margin also contracted by 4 basis points, declining from 3.39% in the fourth quarter of 2023 to 3.35% in the first quarter of 2024. The overall yield on interest-earning assets rose by 13 basis points during the first quarter, primarily driven by a 12 basis point increase in the yield on loans and an expanded loan volume, resulting in a total yield on loans of 6.14% for the first quarter of 2024. Conversely, due to increases in costs for money market and time deposit accounts, alongside a rise in the volume of time deposit accounts, the cost of interest-bearing deposits increased by 20 basis points to 3.45% during the first quarter. Consequently, the total cost of deposits increased by 18 basis points, climbing from 2.59% in the fourth quarter of 2023 to 2.77% in the first quarter of 2024.
The provision for credit losses was $64 thousand in the first quarter of 2024 compared to a negative $263 thousand in the fourth quarter of 2023. The negative reserve observed in the fourth quarter of 2023 was unusual, partly due to specific reserves established as of September 30, 2023, for credits that were resolved during the fourth quarter and became unnecessary as of December 31, 2023. Year over year, the provision for credit losses decreased to $64 thousand in the first quarter of 2024 from $66 thousand in the first quarter of 2023.
As of March 31, 2024, the allowance for credit losses to total loans stood at 0.80%, slightly lower than the 0.81% recorded at December 31, 2023, and lower than the 0.91% reported at March 31, 2023. At both March 31, 2024 and December 31, 2023, there were no non-performing assets.
Non-interest income in the first quarter of 2024 amounted to $396 thousand, a notable increase compared to $208 thousand in the previous quarter and $200 thousand in the first quarter of the prior year. Specifically, swap referral fee income totaled $182 thousand in the first quarter of 2024, compared to none in the fourth and first quarters of 2023.
Non-interest expenses increased $210 thousand, or 7%, in the first quarter of 2024 compared to the prior quarter. Increases in salaries & employee benefits, professional fees, data processing, and other costs were partially offset by decreases in occupancy & equipment and advertising.
Non-interest expenses increased $424 thousand, or 15%, when comparing the first quarter of 2024 to the first quarter of 2023. Non-interest expenses to average assets were 2.28% for the first quarter of 2024 compared to 2.15% for the previous quarter and 2.29% for the first quarter of the prior year.
Deposits increased a net $13.9 million, or 3%, from $499.3 million at December 31, 2023 to $513.2 million at March 31, 2024. During the first quarter, non-interest-bearing deposits increased $1.1 million, or 1%, from $95.4 million at December 31, 2023 to $96.4 million at March 31, 2024. Interest-bearing checking balances decreased $3.3 million, or 8%, from $39.8 million at December 31, 2023 to $36.5 million at March 31, 2024. Money market deposits increased $3.5 million, or 1%, from $231.4 million at December 31, 2023 to $234.9 million at March 31, 2024. Certificates of deposit increased $12.6 million, or 10%, from $132.7 million at December 31, 2023 to $145.4 million at March 31, 2024. Between March 31, 2023 and March 31, 2024, total deposits grew 10%, with strong non-interest-bearing checking, money market, and time deposit growth partially offset by a decline in interest-bearing checking. At March 31, 2024, approximately 81% of total deposits were insured or otherwise collateralized, slightly up from 80% in the prior quarter.
The loan portfolio expanded by $18.6 million, representing a 4% increase, from $531.4 million at December 31, 2023 to $550.0 million at March 31, 2024. While there was robust growth in commercial real estate loans and commercial business loans, this was partially offset by decreases in construction loans and consumer loans when comparing loan balances at December 31, 2023 to loan balances at March 31, 2024. The decrease in construction loans was largely attributed to projects reaching completion and transitioning to permanent financing within the commercial real estate portfolio.
Ranalli added “Commercial real estate loans represent a significant concentration for the Bank which we monitor very closely. This type of lending is a core competency for us and we have the proper risk management tools in place to continuously track this exposure.”
The following table illustrates the composition of the loan portfolio:
Mar. 31, 2024 | Dec. 31, 2023 | Mar. 31, 2023 | |||
Commercial real estate | $ 444,909,373 | $ 413,221,898 | $ 383,875,127 | ||
Commercial construction | 35,337,226 | 48,838,199 | 39,761,445 | ||
Commercial business | 51,780,407 | 50,224,869 | 42,682,372 | ||
Consumer | 17,979,804 | 19,099,155 | 16,793,036 | ||
Total loans | $ 550,006,810 | $ 531,384,121 | $ 483,111,980 |
Investment securities totaled $17.4 million at March 31, 2024 as compared to $25.8 million at December 31, 2023. At March 31, 2024, the held-to-maturity investment portfolio book value was $8.7 million, with a fair market value of $7.7 million, resulting in an unrealized loss of $998 thousand. This unrealized loss, net of tax, of $788 thousand is less than 1.7% of total equity at March 31, 2024. The remainder of the investment portfolio was classified as available for sale with a book value of $10.0 million and a fair value of $8.7 million, resulting in an unrealized loss of $1.3 million. This unrealized loss, net of tax, of $1.1 million is included in accumulated other comprehensive loss on the balance sheet.
Total stockholders’ equity saw a $1.3 million increase, representing a 3% rise, from $46.1 million at December 31, 2023 to $47.5 million at March 31, 2024, primarily due to net income generated. During the quarter ended March 31, 2024, book value per share increased by 43 cents, or 3%, reaching $15.34.
Selected Financial Data: Balance Sheets (unaudited) | |||
March 31, | December 31, | ||
Cash and due from banks | $ 22,314,437 | $ 23,820,615 | |
Time deposits at other banks | 100,000 | 100,000 | |
Investments | 17,382,019 | 25,840,840 | |
Loans | 550,006,810 | 531,384,121 | |
Allowance for credit losses | (4,383,877) | (4,311,306) | |
Premises & equipment | 7,683,039 | 7,639,939 | |
Other assets | 17,923,286 | 18,142,682 | |
Total assets | $ 611,025,714 | $ 602,616,891 | |
Noninterest-bearing deposits | $ 96,439,591 | $ 95,384,366 | |
Interest-bearing checking | 36,493,267 | 39,760,054 | |
Money market | 234,873,774 | 231,407,653 | |
Time deposits | 145,383,468 | 132,738,973 | |
Total deposits | 513,190,100 | 499,291,046 | |
Short term borrowings | 28,000,000 | 35,000,000 | |
Long term borrowings | 9,530,000 | 9,530,000 | |
Subordinated debt | 5,981,258 | 5,978,134 | |
Other liabilities | 6,842,893 | 6,682,220 | |
Total liabilities | 563,544,251 | 556,481,400 | |
Common stock | 3,096,138 | 3,093,414 | |
Surplus | 19,796,666 | 19,767,634 | |
Accumulated other comprehensive loss | (1,055,206) | (1,038,486) | |
Retained earnings | 25,643,865 | 24,312,929 | |
Total stockholders’ equity | 47,481,463 | 46,135,491 | |
Total liabilities & stockholders’ equity | $ 611,025,714 | $ 602,616,891 | |
Performance Statistics | |||||
Qtr Ended Mar. 31, 2024 | Qtr Ended Dec. 31, 2023 | Qtr Ended Sep. 30, 2023 | Qtr Ended Jun. 30, 2023 | Qtr Ended Mar. 31, 2023 | |
Net interest margin | 3.35 % | 3.39 % | 3.57 % | 3.64 % | 3.57 % |
Nonperforming loans/ total loans | 0.00 % | 0.00 % | 0.14 % | 0.15 % | 0.16 % |
Nonperforming assets/ total assets | 0.00 % | 0.00 % | 0.13 % | 0.14 % | 0.14 % |
Allowance for credit losses/ total loans | 0.80 % | 0.81 % | 0.88 % | 0.89 % | 0.91 % |
Average loans/average assets | 92.4 % | 91.1 % | 92.2 % | 91.6 % | 91.6 % |
Non-interest expenses/ average assets | 2.28 % | 2.15 % | 2.19 % | 2.29 % | 2.29 % |
Efficiency ratio | 65.5 % | 63.1 % | 60.1 % | 62.5 % | 63.6 % |
Earnings per share “ basic and diluted | $0.43 | $0.53 | $0.51 | $0.47 | $0.41 |
Book value per share | $15.34 | $14.91 | $14.31 | $13.85 | $13.43 |
Total shares outstanding | 3,096,138 | 3,093,414 | 3,090,838 | 3,088,019 | 3,085,576 |
Weighted average shares | 3,094,951 | 3,092,277 | 3,089,441 | 3,086,782 | 3,084,634 |
Annualized |
Per share data for prior periods was restated to reflect the 5% stock dividend paid in June 2023. |
Income Statements (unaudited) | |||||||||
Qtr. Ended Mar. 31, 2024 | Qtr. Ended Dec. 31, 2023 | Qtr. Ended Sep. 30, 2023 | Qtr. Ended Jun. 30, 2023 | Qtr. Ended Mar. 31, 2023 | |||||
INTEREST INCOME | |||||||||
Loans, including fees | $8,228,102 | $7,941,483 | $7,633,163 | $6,923,177 | $6,223,153 | ||||
Securities | 120,713 | 133,125 | 125,882 | 120,133 | 131,350 | ||||
Other | 31,735 | 105,679 | 33,221 | 67,207 | 28,174 | ||||
Total interest income | 8,380,550 | 8,180,287 | 7,792,266 | 7,110,517 | 6,382,677 | ||||
INTEREST EXPENSE | |||||||||
Deposits | 3,519,176 | 3,277,096 | 2,696,301 | 2,267,015 | 1,819,643 | ||||
Borrowings | 105,860 | 98,901 | 195,150 | 64,267 | 126,620 | ||||
Subordinated debt | 93,124 | 93,124 | 93,124 | 93,123 | 93,124 | ||||
Total interest expense | 3,718,160 | 3,469,121 | 2,984,575 | 2,424,405 | 2,039,387 | ||||
Net interest income | 4,662,390 | 4,711,166 | 4,807,691 | 4,686,112 | 4,343,290 | ||||
Provision for credit losses | 63,651 | (263,073) | 71,017 | 20,327 | 66,299 | ||||
Net interest income after provision for credit losses | 4,598,739 | 4,974,239 | 4,736,674 | 4,665,785 | 4,276,991 | ||||
NON-INTEREST INCOME | |||||||||
Service charges and other fees | 100,164 | 94,656 | 109,894 | 107,841 | 99,570 | ||||
BOLI income | 51,356 | 50,730 | 50,237 | 49,281 | 47,691 | ||||
Swap referral fee income | 182,060 | – | 75,649 | – | – | ||||
Other | 62,548 | 62,701 | 61,527 | 55,740 | 53,013 | ||||
Total non-interest income | 396,128 | 208,087 | 297,307 | 212,862 | 200,274 | ||||
NON-INTEREST EXPENSE | |||||||||
Salaries & benefits | 2,045,083 | 1,873,831 | 1,893,558 | 1,844,356 | 1,834,921 | ||||
Occupancy & equipment | 289,202 | 289,361 | 282,025 | 260,284 | 257,741 | ||||
Professional fees | 137,482 | 123,336 | 119,258 | 119,447 | 115,303 | ||||
Advertising | 81,745 | 83,506 | 58,354 | 65,917 | 67,195 | ||||
Data processing | 176,685 | 167,921 | 172,288 | 159,795 | 147,808 | ||||
Other | 584,926 | 567,428 | 543,465 | 611,336 | 468,225 | ||||
Total non-interest expense | 3,315,123 | 3,105,383 | 3,068,948 | 3,061,135 | 2,891,193 | ||||
Income before federal income tax expense | 1,679,744 | 2,076,943 | 1,965,033 | 1,817,512 | 1,586,072 | ||||
Federal income tax expense | 348,807 | 429,920 | 401,490 | 366,371 | 321,784 | ||||
Net income | $1,330,937 | $1,647,023 | $1,563,543 | $1,451,141 | $1,264,288 | ||||
About First Resource Bancorp, Inc.
First Resource Bancorp, Inc. is the holding company of First Resource Bank. First Resource Bank is a locally owned and operated Pennsylvania state-chartered bank with three full-service branches, serving the banking needs of businesses, professionals and individuals in the Delaware Valley. The Bank offers a full range of deposit and credit services with a high level of personalized service. First Resource Bank also offers a broad range of traditional financial services and products, competitively priced and delivered in a responsive manner to small businesses, professionals and residents in the local market. For additional information visit our website at www.firstresourcebank.com. Member FDIC.
This press release contains statements that are not of historical facts and may pertain to future operating results or events or management’s expectations regarding those results or events. These are “forward-looking statements” within the meaning of Section 27A of the Securities Act of 1933 and Section 21E of the Securities and Exchange Act of 1934. These forward-looking statements may include, but are not limited to, statements about our plans, objectives, expectations and intentions and other statements contained in this press release that are not historical facts. When used in this press release, the words “expects”, “anticipates”, “intends”, “plans”, “believes”, “seeks”, “estimates”, or words of similar meaning, or future or conditional verbs, such as “will”, “would”, “should”, “could”, or “may” are generally intended to identify forward-looking statements. These forward-looking statements are inherently subject to significant business, economic and competitive uncertainties and contingencies, many of which are either beyond our control or not reasonably capable of predicting at this time. In addition, these forward-looking statements are subject to assumptions with respect to future business strategies and decisions that are subject to change. Actual results may differ materially from the results discussed in these forward-looking statements. Readers of this press release are accordingly cautioned not to place undue reliance on forward-looking statements. First Resource Bank disclaims any intent or obligation to update publicly any of the forward-looking statements herein, whether in response to new information, future events or otherwise.


By Jonathan Stempel
OMAHA, Nebraska (Reuters) – Two years ago, Warren Buffett branded Berkshire Hathaway (NYSE:)’s energy business one of his conglomerate’s four “giants.” Now he fears its business model may be broken.
Berkshire Hathaway Energy’s PacifiCorp unit faces billions of dollars in potential liabilities from wildfires that have scorched hundreds of thousands of acres in southern Oregon and northern California.
Costs could rise as more fires break out, and from efforts to prevent them. Climate change, reflected in drier and hotter weather and more combustible vegetation, adds to the risks.
“I did not anticipate or even consider the adverse developments in regulatory returns,” Buffett wrote in his annual shareholder letter in February. “I made a costly mistake in not doing so.”
What remains unclear is the extent PacifiCorp’s problems drag on the conglomerate’s overall results, with Berkshire’s deep balance sheet and dozens of other operations being unable to totally counteract.
Buffett, 93, and his designated successor Greg Abel, 61, may face shareholder questions at Berkshire’s May 4 annual meeting in Omaha, Nebraska, about their concerns for the energy company.
“Wildfires make (the utilities) fire insurance companies on top of being utilities,” said Steven Check, who oversees $1.9 billion at Check Capital management, including $600 million in Berkshire stock and options. “It is a material change. Warren Buffett did not see this coming at all.”
ESCALATING CLAIMS
Berkshire Hathaway Energy serves about 5.3 million electric and gas customers through PacifiCorp, MidAmerican Energy and NV Energy in 11 western and Midwestern states, and millions more in England and Alberta, Canada.
remove ads
.
It owns 36,400 miles (58,580 km) of electric transmission lines, and operates 21,000 miles of pipelines.
For many years, Berkshire Hathaway Energy – which is 92% owned by Berkshire Hathaway – had been a steady earnings engine for its parent, typically generating 10% to 12% of overall operating profit.
That fell to just 6% in 2023, as the business’s profit slid 40% to $2.33 billion.
PacifiCorp was a big reason. Jurors have found the Portland, Oregon-based utility liable in several verdicts over wildfires from 2020, blaming losses on its power lines. PacifiCorp has denied negligence.
But it ended 2023 with $2.4 billion of projected wildfire losses, and has said losses could grow to $8 billion.
This week, a group of 1,000 fire victims said PacifiCorp should pay them $30 billion.
One result: PacifiCorp will pay no dividends to Berkshire Hathaway Energy for several years, which could affect the parent’s ability to fund operations.
“It’s key for utilities to recover costs and maintain a strong financial profile so they can ensure reliability for customers,” said Travis Miller, a Morningstar stock analyst.
Utilities can reduce the risk of wildfires by insulating wires to reduce the threat of sparks, trimming or cutting down trees that could contact power equipment, burying transmission lines underground, and temporarily shutting off power.
But mitigation can be expensive, and Buffett pledged that Berkshire “will not knowingly throw good money after bad.”
Toby Shea, senior credit officer at Moody’s (NYSE:) Investors Service, explained: “He’s saying, look, if we basically have to pay out billions and billions of dollars every time there is a big fire, this is not a workable model.”
remove ads
.
BLAME THE LAWYERS This is not the first time Berkshire has encountered big headwinds in a major business.
Berkshire spent years cleaning up poor underwriting at General Re after paying $16 billion for the reinsurer in 1998.
It also overpaid for Precision Castparts, which cost $32.1 billion in 2016, only to see its aircraft parts business collapse during the pandemic. Litigation involving PacifiCorp could drag out for years, and the ultimate cost and timing of payouts are uncertain.
In his shareholder letter, Buffett warned that a “confiscatory resolution” might befall PacifiCorp, but that Berkshire and Berkshire Hathaway Energy were structured to survive it.
Though analysts do not foresee a bankruptcy, Berkshire could decide it might not be worth investing in generating and transmission assets if it were forced to foot several years of big legal bills.
“Our assumption is that if damages at PacifiCorp become unsustainable long term, the company’s support toward PacifiCorp could be limited,” S&P Global analyst Sloan Millman said.
Berkshire Hathaway Energy declined to comment for this article.
PacifiCorp said the $30 billion claim shows the need for legal reform, with its ability to serve customers “threatened by excessive wildfire damages pursued by plaintiffs’ attorneys who have a substantial financial stake in these outcomes.”
Some states are addressing utilities’ risk of bankruptcy from wildfires.
In 2019, California lawmakers created a multibillion-dollar wildfire fund that utilities could tap to pay for damages caused by their equipment.
And in March 2024, Utah lawmakers allowed large utilities to collect surcharges from customers to establish wildfire funds, and capped liability on some claims.
remove ads
.
PacifiCorp could benefit if Oregon took similar steps. For now, Berkshire’s size offers protection from big losses.
Paul Lountzis, president of Lountzis Asset Management in Wyomissing, Pennsylvania, which invests 11% of its assets in Berkshire stock, said diversification “really, really helps. It’s not like Berkshire is one singular utility.”

U.Today – In a heated live debate organized by ZeroHedge and presented on YouTube, billionaire investor Anthony Scaramucci of SkyBridge Capital sparred with top analyst Peter Schiff over whether (BTC) or gold serves as a better inflation hedge.
They were joined by the CEO of ShapeSchift Erik Voorhees and Nouriel Roubini, a professor of economics at NYU.
BTC as digital gold
Bitcoin proponents are attempting to reposition it as a digital version of gold, Schiff said. Still, in his view, it falls short of gold’s intrinsic value derived from its physical properties.
“Bitcoin is no more digital gold than an image of a hamburger is digital food,” Schiff noted.
He emphasized gold’s tangible utility in industries like jewelry and electronics, contrasting it with Bitcoin, which he believes lacks practical uses and utility.
Regarding gold’s enduring value, Schiff asserted that it retains its intrinsic properties over time, serving as a genuine store of value. He also argued that the perceived value of Bitcoin is merely based on speculative demand and does not reflect any inherent usefulness or practical applications.
BTC as asset
He emphasized that Bitcoin, like gold, has a deflationary aspect due to its fixed supply. Scaramucci views Bitcoin as “digital gold,” noting its portability compared to physical gold.
He also pointed that Bitcoin is following an adoption curve that will impact its value over decades, likening it to the trajectory of tech stocks that became standard over time and contributed to the S&P 500 index.
remove ads
.
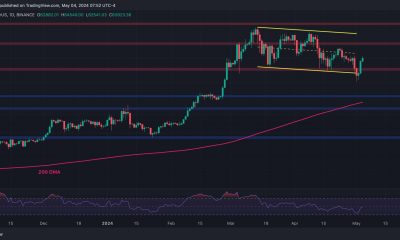
BTC breaks $63K
Source: CoinMarketCapThis surge followed a cooler-than-expected U.S. April jobs report, which alleviated concerns about potential increases in interest rates.

SAO PAULO (Reuters) -The death toll from rains in Brazil’s southernmost state of Rio Grande do Sul rose to 57, local authorities said on Saturday afternoon, while dozens still have not been accounted for.
Rio Grande do Sul’s civil defense authority said 67 people were still missing and more than 32,000 had been displaced as storms have affected nearly two thirds of the 497 cities in the state, which borders Uruguay and Argentina.
Floods destroyed roads and bridges in several regions of the state. The storm also triggered landslides and the partial collapse of a dam at a small hydroelectric power plant. A second dam in the city of Bento Goncalves is also at risk of collapsing, authorities said.
In Porto Alegre, the capital of Rio Grande do Sul, the Guaiba lake broke its banks, flooding streets.
Porto Alegre’s international airport has suspended all flights for an indefinite period.
Rains are expected in the northern and northeastern regions of the state in the next 36 hours, but the volume of precipitation has been declining, and should be well below the peak seen earlier in the week, according to the state meteorology authority.
Still, “rivers water levels should stay high for some days”, Governor Eduardo Leite said on Saturday in a live video on his social media, adding it is difficult to determine for how long.
Rio Grande do Sul is at a geographical meeting point between tropical and polar atmospheres, which has created a weather pattern with periods of intense rains and others of drought.
remove ads
.
Local scientists believe the pattern has been intensifying due to climate change.
Heavy rains had already hit Rio Grande do Sul last September, as an extratropical cyclone caused floods that killed more than 50 people.
That came after more than two years of a persistent drought due to the La Nina phenomenon, with only scarce showers.

 Forex2 years ago
Forex Today: the dollar is gaining strength amid gloomy sentiment at the start of the Fed’s week
- Forex2 years ago
How is the Australian dollar doing today?
- Forex1 year ago
Unbiased review of Pocket Option broker
- Forex2 years ago
Dollar to pound sterling exchange rate today: Pound plummeted to its lowest since 1985
- Cryptocurrency2 years ago
What happened in the crypto market – current events today
- World2 years ago
Why are modern video games an art form?
- Stock Markets2 years ago
Morgan Stanley: bear market rally to continue
- Economy2 years ago
Crude oil tankers double in price due to EU anti-Russian sanctions